. 2023 Sep 2;14(1):5336.
doi: 10.1038/s41467-023-40845-2.

Epigenetic inheritance is unfaithful at intermediately methylated CpG sites

Affiliations

Epigenetic inheritance is unfaithful at intermediately methylated CpG sites

Amir D Hay et al. Nat Commun. .

Abstract

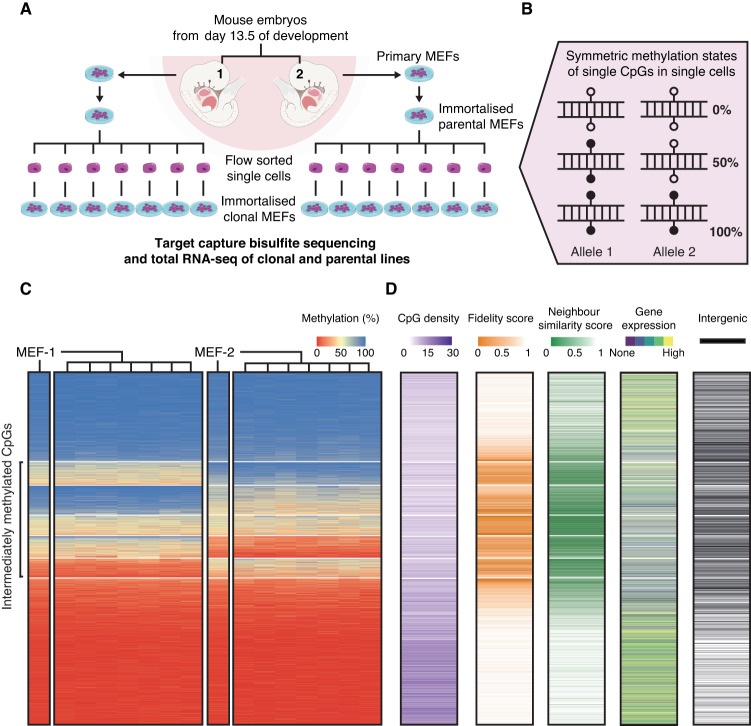
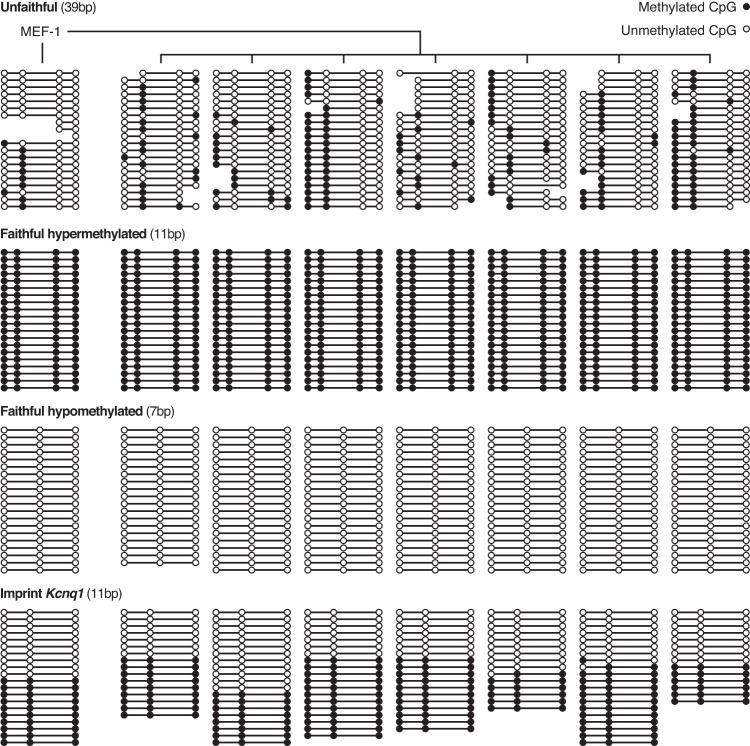
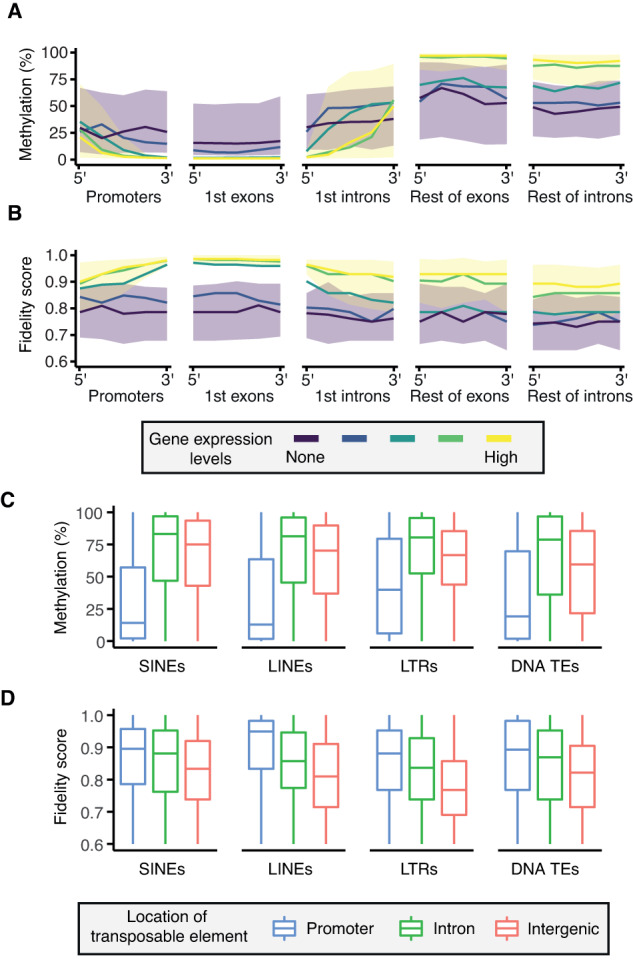
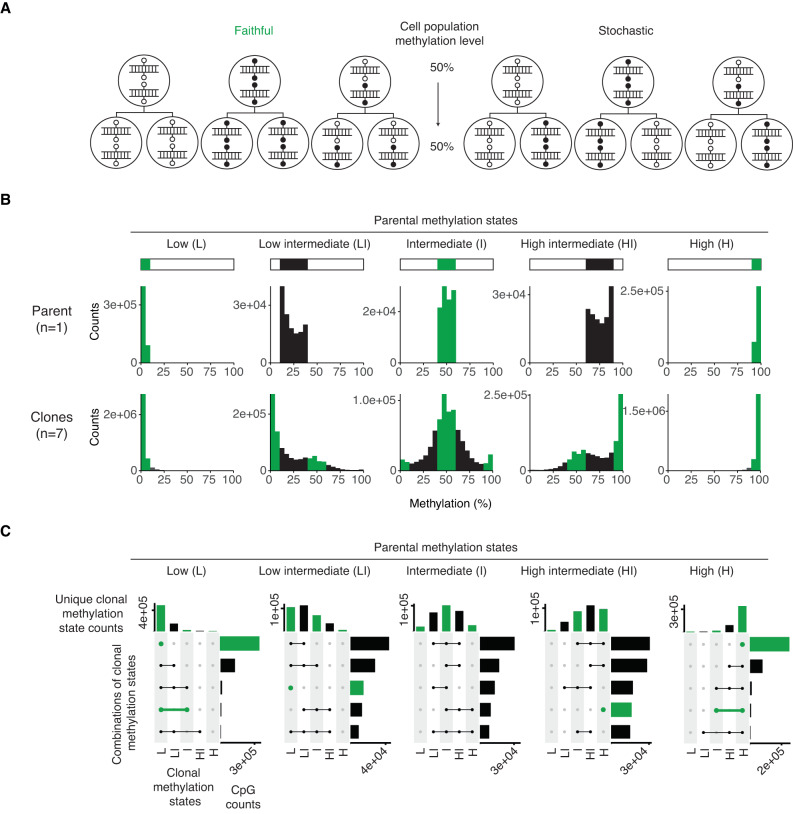
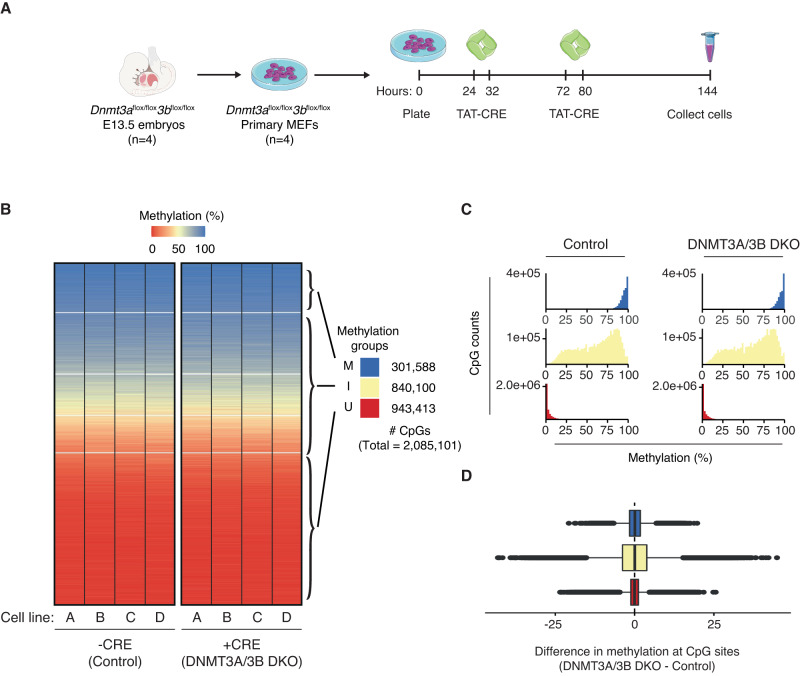
DNA methylation at the CpG dinucleotide is considered a stable epigenetic mark due to its presumed long-term inheritance through clonal expansion. Here, we perform high-throughput bisulfite sequencing on clonally derived somatic cell lines to quantitatively measure methylation inheritance at the nucleotide level. We find that although DNA methylation is generally faithfully maintained at hypo- and hypermethylated sites, this is not the case at intermediately methylated CpGs. Low fidelity intermediate methylation is interspersed throughout the genome and within genes with no or low transcriptional activity, and is not coordinately maintained between neighbouring sites. We determine that the probabilistic changes that occur at intermediately methylated sites are likely due to DNMT1 rather than DNMT3A/3B activity. The observed lack of clonal inheritance at intermediately methylated sites challenges the current epigenetic inheritance model and has direct implications for both the functional relevance and general interpretability of DNA methylation as a stable epigenetic mark.


Conflict of interest statement

The authors declare no competing interests.

Figures

Fig. 1
Fig. 1. Intermediately methylated sites show lower epigenetic inheritance fidelity.
A Mouse embryonic fibroblasts (MEFs) were isolated from E13.5 mouse embryos and immortalised. The resulting cell lines, MEF-1 and MEF-2, are referred to as the “parental” lines. Single cells were randomly selected by flow cytometry from these lines and grown into derivative “clonal” lines. Target capture bisulfite sequencing and total RNA sequencing were performed on both the parental and clonal lines. B Illustration showing that at the single-cell level, there are only three strand-symmetric methylation states that can exist at a single CpG dinucleotide: 0%, 50%, and 100%. C Heatmaps of 1,203,687 CpGs sorted by median methylation (%) within k-means clusters (k = 7, separated by white lines). The two parental lines are denoted as MEF-1 and MEF-2, with the seven clonal lines shown to the right of the corresponding parental line. D Heatmaps of CpG density (in purple) calculated as the number of CpGs within 100 bp of each focal CpG, methylation fidelity score (in orange) calculated as a proxy for the retention of symmetric methylation states from the single cell to a clonal line population, neighbour similarity score (in green) as an approximation of the consistency of methylation between neighbouring CpGs in a clonal line, and transcription quintiles derived from gene expression averages across all the cell lines (no expression in purple, high expression in yellow). Intergenic CpGs (blank lines) are characterised by a lack of overlap with an annotated protein-coding transcript or promoter.
Fig. 2
Fig. 2. Examples of unfaithful, faithful and imprinted regions of the genome.
Unfaithful regions show a sporadic methylation pattern that contrasts with the consistency of methylation states at faithful and imprinted regions of the genome. The parental line is denoted as MEF-1, with the seven clonal lines shown to the right. Reads from the tcBS-seq data are represented by lines and CpGs are shown as circles with accurate mapping of respective distance in base pairs between them. Methylated CpGs are shown as filled circles, while unmethylated CpGs are shown as open circles. Reads are ordered by average methylation of the covered CpG sites. The example regions shown above are each represented by between 15 and 20 reads at the following genomic coordinates: (mm10): unfaithful (chr15:79,251,875–79,251,914), faithful hypermethylated (chr1:34,302,911–34,302,922), faithfully hypomethylated (chr4:124,751,396–124,751,403) and imprint Kcnq1 (chr7:143,295,599–143,295,610).
Fig. 3
Fig. 3. Unfaithful intermediate methylation associates with the lack of transcription.
A Methylation levels and B fidelity score characterised along the following regions of protein-coding genes: promoters, 1st exons, 1st introns, the rest of exons, and the rest of introns. Each region is split into five tiles at which median (lines) or interquartile range (ribbons) of methylation or fidelity score is shown. Only regions covered by at least three CpGs are considered; single-exon genes are excluded. Gene expression levels are represented by colours ranging from purple (no expression) to yellow (high expression). Interquartile range ribbons for both methylation and fidelity score are only shown for the genes that are not expressed (light purple) or highly expressed (light yellow). C Boxplots showing methylation and D fidelity score of transposable elements (SINEs [n = 2145], LINEs [n = 597], LTRs [n = 2816], and DNA transposons [n = 338]) that exist in promoter (blue; # of SINEs =  316, # of LINEs = 58, # of LTRs = 105, # of DNA TEs = 35), intronic (green; # of SINEs = 926, # of LINEs = 246, # of LTRs = 611, # of DNA TEs = 128), or intergenic regions (orange; # of SINEs = 903, # of LINEs = 293, # of LTRs = 2100, # of DNA TEs = 175) of the genome. Methylation levels and fidelity score are calculated as the mean across CpGs in each TE. For C and D, the box of the boxplot shows the 25th, 50th, and 75th percentiles; the whiskers extend to 1.5*IQR beyond the edges of the box (where IQR = 75th−25th percentile), with outliers shown as dots.
Fig. 4
Fig. 4. Intermediately methylated CpGs are prone to probabilistic inheritance through clonal expansion.
A Two ways by which DNA methylation at a given CpG site can be transmitted through clonal expansion: faithful and stochastic. Each large circle represents a cell—the top row represents the parental cells, and the bottom row represents the daughter cells that arise from cell division. Symmetric methylation at a single CpG site is illustrated as a small filled-in circle on either one or both alleles, whereas the absence of methylation is illustrated as a small empty circle. B Clonal line methylation distributions from different parental line methylation states for the MEF-1 cell lines. C UpSet plots of clonal line methylation states per CpG from different parental line methylation states for the MEF-1 cell lines. In each panel, the top bar plots show the number of unique clonal methylation states represented per CpG. The horizontal bar plots show the CpG counts that exhibit a certain combination of clonal methylation states. Only the five most representative clonal methylation state combinations are shown. Green bars represent cases of potential faithful methylation inheritance because this kind of methylation inheritance will only result in 0%, 50%, or 100% methylation states in the clonal lines. Similarly, green dots and lines in the UpSet plots represent cases and combinations of potential faithful methylation inheritance. Methylation states are defined quantitatively as the following: Low = 0–10%, Low intermediate = 10–40%, Intermediate = 40–60%, High intermediate = 60–90%, High = 90–100% methylation.
Fig. 5
Fig. 5. Intermediate methylation does not arise due to DNMT3a/3b de novo activity.
A Primary MEFs were established from Dnmt3aflox/flox3bflox/flox E13.5 embryos (n = 4). The cells were then plated and 24 h later, treated with recombinant TAT-CRE protein for 8 h. 48 h after the initial treatment, the cells were treated with TAT-CRE again for 8 h. 72 h after the second TAT-CRE treatment, the cells were collected for DNA/RNA extraction. We generated tcBS-seq libraries for four individual control MEF lines and four matched TAT-CRE treated MEF lines. B Heatmaps of 2,085,101 CpGs sorted by median methylation (%) within k-means clusters (k = 5) for untreated (control) and TAT-CRE treated (DNMT3A/3B) primary MEF cell lines A–D. Methylation groups are classified using the k-means clusters as shown. U (red) = consistently unmethylated across all the cell lines. I (off-white) = potential to be intermediately methylated. M (blue) = consistently methylated across all the cell lines. C Methylation percentage distributions of the methylation groups for both the control and DNMT3A/3B DKO cell lines. D Boxplot showing the difference in methylation at CpG sites between DNMT3A/3B DKO and control cell lines. Differences per CpG were calculated as the difference in average methylation across the four DNMT3A/3B DKO cell lines and the four control cell lines at a given CpG site. U (red; n = 943,413); I (off-white; n = 840,100); M (blue; n = 301,588). For D, the box of the boxplot shows the 25th, 50th, and 75th percentiles; the whiskers extend to 1.5*IQR beyond the edges of the box (where IQR = 75th−25th percentile), with outliers shown as dots.

Similar articles

Cited by

References

    1. Robertson KD. DNA methylation and human disease. Nat. Rev. Genet. 2005;6:597–610. - PubMed
    1. Smith ZD, Meissner A. DNA methylation: roles in mammalian development. Nat. Rev. Genet. 2013;14:204–220. - PubMed
    1. Holliday R. DNA methylation and epigenetic inheritance. Philos. Trans. R. Soc. Lond. B Biol. Sci. 1990;326:329–338. - PubMed
    1. Bestor TH, Tycko B. Creation of genomic methylation patterns. Nat. Genet. 1996;12:363–367. - PubMed
    1. Probst AV, Dunleavy E, Almouzni G. Epigenetic inheritance during the cell cycle. Nat. Rev. Mol. Cell Biol. 2009;10:192–206. - PubMed

Publication types