. 2023 Sep 2;20(1):201.
doi: 10.1186/s12974-023-02880-0.

Mesenchymal-derived extracellular vesicles enhance microglia-mediated synapse remodeling after cortical injury in aging Rhesus monkeys

Affiliations

Mesenchymal-derived extracellular vesicles enhance microglia-mediated synapse remodeling after cortical injury in aging Rhesus monkeys

Yuxin Zhou et al. J Neuroinflammation. .

Abstract

Understanding the microglial neuro-immune interactions in the primate brain is vital to developing therapeutics for cortical injury, such as stroke or traumatic brain injury. Our previous work showed that mesenchymal-derived extracellular vesicles (MSC-EVs) enhanced motor recovery in aged rhesus monkeys following injury of primary motor cortex (M1), by promoting homeostatic ramified microglia, reducing injury-related neuronal hyperexcitability, and enhancing synaptic plasticity in perilesional cortices. A focal lesion was induced via surgical ablation of pial blood vessels over lying the cortical hand representation of M1 of aged female rhesus monkeys, that received intravenous infusions of either vehicle (veh) or EVs 24 h and again 14 days post-injury. The current study used this same cohort to address how these injury- and recovery-associated changes relate to structural and molecular interactions between microglia and neuronal synapses. Using multi-labeling immunohistochemistry, high-resolution microscopy, and gene expression analysis, we quantified co-expression of synaptic markers (VGLUTs, GLURs, VGAT, GABARs), microglia markers (Iba1, P2RY12), and C1q, a complement pathway protein for microglia-mediated synapse phagocytosis, in perilesional M1 and premotor cortices (PMC). We compared this lesion cohort to age-matched non-lesion controls (ctr). Our findings revealed a lesion-related loss of excitatory synapses in perilesional areas, which was ameliorated by EV treatment. Further, we found region-dependent effects of EVs on microglia and C1q expression. In perilesional M1, EV treatment and enhanced functional recovery were associated with increased expression of C1q + hypertrophic microglia, which are thought to have a role in debris-clearance and anti-inflammatory functions. In PMC, EV treatment was associated with decreased C1q + synaptic tagging and microglia-spine contacts. Our results suggest that EV treatment may enhance synaptic plasticity via clearance of acute damage in perilesional M1, and thereby preventing chronic inflammation and excessive synaptic loss in PMC. These mechanisms may act to preserve synaptic cortical motor networks and a balanced normative M1/PMC synaptic function to support functional recovery after injury.

Keywords: C1q; Cortical injury; Extracellular vesicles; Microglia; Neuroinflammation; Synaptic plasticity.


Conflict of interest statement

The authors declare that they have no competing interests.

Figures
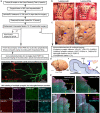
Fig. 1
Fig. 1
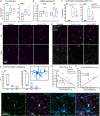
Experimental design and representative images of immunolabeled markers, lesion, and sampling location. a Experimental workflow as described in Moore et al., [12]. The brains were harvested 14 to 16 weeks after the surgery using two methods: (a1) During Krebs buffer perfusion, 1–2 cm fresh tissue block was harvested from the ventral perilesional M1 and PMC, with caudal 1/4 processed for qPCR and the rostral ¾ was cut into 300 µm acute slices for whole-cell patch-clamp recording and intracellular filling of layer 3 pyramidal cells. (a2) The remainder of the brain containing the lesion and dorsal PMC was fixed with 4% paraformaldehyde then cut into serial coronal sections for IHC labeling. b, c Photographs showing the hand representation (sites with black dots) mapped with electrical stimulation of M1 and (b) the lateral surface of the fixed brain (c) showing the M1 and PMC, with the lesion area (blue arrow), and locations of sampled sites in dorsal (dPMC) and ventral (vPMC taken out) PMC, as described in previous studies [12, 14]. Sulci: A, arcuate; C, central (black arrow); L, lateral; axes: D, dorsal; V, ventral; M, medial; L, lateral. d Photograph of ipsilesional hemisphere and coronal section (gray matter with intact pia indicated with black line) thorough the surgical lesion (lesion volume is outlined with blue dotted line, lesion surface indicated with red line and depth measurement with orange arrow), with black arrows indicating perilesional M1 underlying the lesion, and adjacent dorsal PMC. e Example confocal images of multi-channel IHC fluorescence labeling tiled (4 × low mag yellow inset shown in 20×) in M1 and PMC from veh or EV group. Sampling sites are shown in yellow (M1) and white (PMC). f-g Example maximum z-projection of high-resolution confocal images used for analyses: f Representative pyramidal neurons intracellularly filled with 1% biocytin and visualized with Alexa 488 streptavidin conjugate, together with immunolabeled microglia. g Representative images showing immunolabelling of synaptic, microglial, and complement markers that were immuno-labeled included
Fig. 2
Fig. 2
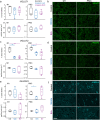
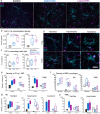
The expression of excitatory synaptic markers in perilesional M1 and PMC. a Box-and-whisker plots with vertical scatter plots of individual cases showing the density (% area labeled) and average particle size (area in µm2) of VGLUT1 + puncta in perilesional M1 and in PMC of each monkey. b Representative confocal images of VGLUT1 immuno-labeling in M1 and PMC. c Box-and-whisker plots with vertical scatter plots of individual cases of the density and average size of VGLUT2 + puncta in perilesional M1 and in PMC. The density of VGLUT2 + puncta was significantly lower in groups with lesions compared with Ctr in both perilesional M1 (one-way ANOVA, main effect, p < 0.001; Fisher’s LSD post hoc, ctr. vs veh: p = 0.004; ctr vs EV: p = 0.001) and in PMC (one-way ANOVA, main effect, p = 0.05; Fisher’s LSD post hoc, ctr. vs veh: p = 0.04; ctr vs EV: p = 0.02). d Representative maximum-projection confocal images of VGLUT2 immuno-labeling in M1 and PMC. e Box-and-whisker plots with vertical scatter plots of individual cases of the density (% area label) and average size (µm2) of GluR2/3 + puncta in perilesional M1 and in PMC. The density of GLUR2/3 + puncta in PMC was significantly lower in the vehicle group (one-way ANOVA, main effect, p = 0.1; Fisher’s LSD post hoc, p = 0.036) but not in the EV group (Fisher’s LSD post hoc, p = 0.49) as compared with non-lesion controls. f Representative maximum-projection confocal images of GLUR2/3 immuno-labeling in M1 and PMC. For a-f Ctr: n = 3. Veh: n = 4. EV: n = 5 monkeys Scale bar: 20 µm. Box-and-whisker plots: bars show interquartile range and median (horizontal line) with error bars = 95% confidence interval; *p < 0.05, **p < 0.01
Fig. 3
Fig. 3
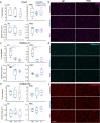
The expression of inhibitory synaptic markers in perilesional M1 and PMC. a Box-and-whisker plots with vertical scatter plots of individual cases showing the particle density and average size of VGAT+ puncta in perilesional M1 and in PMC (Ctr: n = 3; Veh group: n = 5; EV group: n = 5 monkeys). b Representative maximum-projection confocal images of VGAT immuno-label in M1 and PMC. c Box-and-whisker plots with vertical scatter plots of individual cases of the density and average size of GABAa α1+ puncta in perilesional M1 and in PMC. The density of GABAa α1 subunit in perilesional M1 was significantly lower in both veh and EV group as compared with non-lesion controls (one-way ANOVA, main effect, p = 0.004; Fisher’s LSD post hoc, ctr. vs. Veh, p = 0.038; ctr. vs. EV, p = 0.009). The density of GABAa α1 in PMC was lower in veh and EV group (one-way ANOVA, main effect, p = 0.016; Fisher’s LSD post hoc, ctr. vs. veh, p = 0.05; ctr. vs. EV, p = 0.02). The size of GABAa α1 in M1 was significantly smaller in the EV group (p < 0.001). d Representative maximum-projection confocal images of GABAa α1 receptor subunit immuno-label in M1 and PMC. e Box-and-whisker plots with vertical scatter plots of individual cases showing the particle density and average size of GABAb R2+ puncta in perilesional M1 and PMC. f Representative maximum-projection confocal images of GABAb R2 subunit immuno-label in M1 and PMC. For c-f Ctr: n = 3; Veh group: n = 4; EV group: n = 5 monkeys. Scale bar: 20 µm. Box-and-whisker plots: bars show interquartile range and median (horizontal line) with error bars = 95% confidence interval; *p < 0.05, **p < 0.01
Fig. 4
Fig. 4
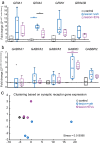
Glutamate and GABA receptors subunit mRNA expression in perilesional cortex. a Box-and-whisker plots with vertical scatter plots of individual cases showing relative fold changes in glutamate receptor subunit gene expression. The gene expression of GRIA2 (GLUR2) was significantly higher in the veh group, as compared with non-lesion controls (t-test, p < 0.001) and the EV group (p = 0.01). b Fold changes of GABA receptor subunit gene expression. The gene expression of GABRD (GABAa ∂) was significantly higher in the EV group as compared with non-lesion controls (t-test, p = 0.004). Gene names: GRIA1 (AMPA GLUR1), GRIA2 (AMPA GLUR2), GRIN1 (NMDA NR1), GRIN2B (NMDA NR2B), GABRA1 (GABAa α1), GABRA2 (GABAa α2), GABRA5 (GABAa α5), GABRD (GABAa ∂), GABBR2 (GABAb R2). Ctr: n = 2; Veh: n = 5; EV: n = 4 monkeys. c MDS plot showing clustering of cases based on mRNA expression profiles of Glu and GABA receptor subunits. The proximity of points indicates the relative similarity-based pair-wise correlation of these multiple mRNA expression variables. Ctr: n = 2; Veh: n = 5; EV: n = 3 monkeys. Box-and-whisker plots: bars show interquartile range and median (horizontal line) with error bars = 95% confidence interval; *p < 0.05, **p < 0.01
Fig. 5
Fig. 5
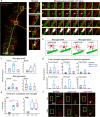
Microglia apposition on synaptic structures. a Representative images of microglia interactions with dendritic spines/shaft at different z-levels of stack. Neuronal dendrites and spines were filled with biocytin and stained with streptavidin-Alexa 488 (green) and microglia were visualized with Iba1 and P2RY12 + (red) immuno-labeling. White pixels indicate an overlap between two channels. Scale bars: 20 µm and 5 µm. b Schematic diagram of criteria for determining microglia appositions on dendritic shafts or spines, classified as either contact (touching) or neighboring (within 1 microns). c Box-and-whisker plots with vertical scatter plots of individual neurons showing the density of microglia appositions (contacting and neighboring) on dendritic shaft and spine. The vehicle group had higher densities of microglial–apical shaft (one-way ANOVA, main effect, p = 0.07; Fisher’s LSD post hoc, veh vs. EV, p = 0.009) and microglial–apical spine (p = 0.038) appositions compared to EV group, and a trend for greater total appositions in the vehicle than in the control group was found (ctr. vs. veh., p = 0.058). d Total microglial appositions (contacts and neighboring on spines and shafts) on different segments of apical/basal dendrites in ventral PMC. Mid-apical dendrites had higher densities of microglial contacts only in veh compared to control (ctr. vs veh, p = 0.03; ctr. vs EV, p = 0.84). For c-d Ctr: n = 10 cells from 3 monkeys; Veh group: n = 10 cells from 3 monkeys; EV group: n = 7 cells from 2 monkeys. e Box-and-whisker plots with vertical scatter plots of individual cases showing the fraction of VGLUT2 colocalized with microglia, which was higher in both groups with lesions in M1 compared to control group (ctr. vs. veh, p = 0.009; ctr. vs. EV, p < 0.001). Ctr: n = 3; Veh group: n = 4; EV group: n = 5 monkeys. f Representative images of dual channel labeling of microglia (red) and VGLUT2 (green), with right panel showing the inset (yellow box) at higher resolution, with colocalized VGLUT2–microglia label masked in white. Box-and-whisker plots: bars show interquartile range and median (horizontal line) with error bars = 95% confidence interval; *p < 0.05, **p < 0.01
Fig. 6
Fig. 6
C1q co-expression on VGLUT2 + axon terminals and Iba1 microglia. Box-and-whisker plots with vertical scatter plots of individual cases showing: a The density (% area label) of C1q + puncta in perilesional M1 and PMC (one-way ANOVA, main effect, p = 0.07; Fisher’s LSD post hoc, M1: ctr. vs EV p = 0.028). Ctr: n = 3. Veh: n = 4. EV: n = 5 monkeys. b Fold changes of C1QA and C3 gene expression in perilesional M1 (t-test, veh. vs. EV, p = 0.027; Ctr: n = 3. Veh: n = 4. EV: n = 4). Ctr: n = 3; Veh: n = 4; EV: n = 4 monkeys; and c the density (% area label) of VGLUT2 + puncta colocalized with C1q + puncta (one-way ANOVA, main effect, p = 0.03; Fisher’s LSD post hoc, ctr. vs. veh, p = 0.02). Ctr: n = 3; Veh: n = 4; EV: n = 5 monkeys. d Representative maximum-projection confocal images of C1q + puncta immuno-labeling in M1 and PMC. Scale bar: 20 µm. e Representative maximum-projection confocal images showing dual channel labeling of C1q (magenta) and VGLUT2 (green), with colocalized VGLUT2-C1q points masked in white. f Box-and-whisker plots with vertical scatter plots of individual cases showing the distance between the C1q-VGLUT2 colocalized points and microglia (Iba1)-VGLUT2 colocalized points. Inset shows schematic diagram of how C1q-VGLUT2-Iba1 distance was determined. Ctr: n = 3; Veh: n = 4; EV: n = 5 monkeys. g Linear regression showing increasing C1q expression correlated with decreasing expression of VGLUT2 + (R2 = 0.378, p = 0.034) in M1. h Linear regression showing greater C1q expression correlated with greater VGLUT2–microglia colocalization (R.2 = 0.372, p = 0.035). i Representative maximum-projection confocal images of 9 optical slices showing single/dual/triple channel labeling (left to right) of colocalized VGLUT2 (green), Iba1 (cyan) and C1q (magenta). Box-and-whisker plots: bars show interquartile range and median (horizontal line) with error bars = 95% confidence interval; *p < 0.05
Fig. 7
Fig. 7
C1q expression in different microglia phenotypes. a Representative images of dual labeling of microglia (Iba1, cyan) and C1q (magenta) in all three groups. b-c Box-and-whisker plots with vertical scatter plots of individual cases showing: b the density (% area label) of Iba1 + colocalized with C1q + puncta. (M1: one-way ANOVA, main effect, p = 0.001; Fisher’s LSD post hoc, ctr. vs. veh, p = 0.046; ctr. vs. EV, p = 0.003; veh vs. EV, p = 0.009; PMC: main effect, p = 0.04; post hoc, ctr. vs. EV p = 0.004); c the fraction of C1q + puncta colocalized with microglia (Iba1). Higher fraction of C1q + puncta colocalized with microglia (Iba1) in EV than in veh (main effect, p = 0.06; post hoc, p = 0.05). For b-c, Ctr: n = 3. Veh: n = 4. EV: n = 5 monkeys. d Representative images of dual labeling of microglia (Iba1, cyan) and C1q (magenta), with examples of different microglia morphologies with or without C1q. e–h Box-and-whisker plots with vertical scatter plots of individual cases showing the cell densities of: e microglia by C1q expression. In M1, EV but not veh had greater C1q + microglia density than control (two-way ANOVA group*area, main effect, ‘group’: p = 0.009; post hoc: ctr. vs. veh: p = 0.07; ctr. vs. EV: p = 0.03); and C1q- microglia had greater density in lesion than in controls (main effect, ‘group’: p = 0.006; post hoc: con. vs. veh: p < 0.001; ctr. vs. EV: p = 0.004). In PMC, greater density of C1q + microglia in veh than control group (p = 0.02). f Microglia by morphology (Rami, Hyper and Ame; two-way ANOVA group*area). In M1, hypertrophic microglia had greater density in lesion compared to control group (main effect, ‘group’: p = 0.003; post hoc: con. vs. veh: p = 0.01; con. vs. EV: p = 0.008). g Microglia by both C1q expression and morphology in M1. In M1, the EV group showed higher density of C1q- ramified microglia than control group (p = 0.01). Both groups with lesion had higher density of hypertrophic C1q + microglia than controls (main effect, ‘group’: p < 0.001; post hoc: ctr. vs. veh: p = 0.047; ctr. vs. EV: p < 0.001). However, only veh group had a higher density of hypertrophic C1q- microglia than controls (main effect, ‘group’: p = 0.036; post hoc: p = 0.005). h Microglia by both C1q expression and morphology in PMC revealed no between-group differences. For e–h Ctr: n = 3; Veh: n = 4; EV: n = 5 monkeys. Box-and-whisker plots: bars show interquartile range and median (horizontal line) with error bars = 95% confidence interval; *p < 0.05, **p < 0.01
Fig. 8
Fig. 8
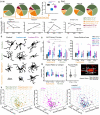
The expression of different microglia phenotypes in M1 and PMC. a Pie charts of %microglia by morphology and C1q expression in M1 and b PMC. Right inset in a shows a Box-and-whisker plot of the ratio of Hyper + to the total Hyper microglia (two-way ANOVA group*area: interaction, p < 0.01; Fisher’s LSD post hoc, p < 0.05, see Table S3). c Line plots showing the mean relative proportion of Rami + , Hyper + , Hyper-, and Total C1q + as a percentage of total microglia in M1 and PMC (two-way ANOVA: main effect ‘group’ %Hyper + ; ‘group*area’ interactions %Rami + , %Hyper-, and %Total C1q + , p < 0.05). Between-area comparisons: in control, %Rami + and %C1q is greater in M1 than PMC; and in vehicle, %Rami + is greater in PMC than in M1, but %Hyper- is greater in M1 than in PMC (Fisher’s LSD, p < 0.05; Ctr: n = 3; Veh: n = 4; EV; n = 5 monkeys). d Representative reconstructions of microglia morphological subtypes. e–g Morphological parameters measured from partial 3D reconstructions (Ctr: n = 36 cells; Veh: n = 58 cells; EV: n = 71 cells each from 1 monkey): e number of primary process (three-way ANOVA group*morphology*C1q ± , main effect ‘morphology’: p = 0.02; ‘group’: p = 0.01; Table S3). Between-group comparisons: Hyper ± microglia in EV had more primary processes than in veh/ctr. Between-morphology comparisons: In EV, Hyper ± microglia had more primary processes than Rami ± microglia (Fisher’s LSD, p < 0.05). f Microglia soma surface area (three-way ANOVA, main effect ‘group’: p = 0.006; ‘C1q ± ’: p = 0.004). Between-group comparisons: Hyper + and Rami + microglia in EV had greater soma surface area than in ctr (p < 0.05). g Soma aspect ratio was greater in C1q- microglia than in C1q + (main effect ‘C1q ± ’: p = 0.03). Left panel shows plots by microglia morphology and C1q subtype. Middle panel shows plot by total C1q+ vs C1q- microglia. Right panel shows example image with aspect ratio measurement. h 3D scatter plot of morphological parameters. Annotations based on morphology, C1q expression, and experimental group. Box-and-whisker plots: bars show interquartile range and median (horizontal line) with error bars = 95% confidence interval; *p < 0.05, **p < 0.01. Table S3 for exact p-values
Fig. 9
Fig. 9
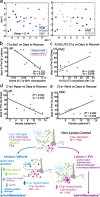
Relationship of synaptic and microglia properties to behavior outcome measures. a NMDS plots showing clustering of cases, annotated by experimental group (left) and cortical area (right), based on 21 synaptic and microglia outcome measures (%area VGLUT1, VGLUT2, VGAT, GLUR2/3, GABAA alpha1, GABAB R2; % of VGLUT1, VGLUT2 or VGAT with Iba1; % of Iba1 with VGLUT1, VGLUT2 or VGAT; % area C1q; % of VGLUT2 with C1q; % C1q with VGLUT2; cell densities of ramified, hypertrophic, amoeboid C1q + and C1q- microglia). The proximity of points indicates the relative similarity-based on pair-wise correlation of these multiple variables. b-e Significant linear correlations between synaptic–microglial measures and behavioral outcome measures: b increased density of C1q and Iba1 colocalization in M1 correlated with faster recovery time (less days to return to pre-operative latency to retrieve food reward; R2 = 0.752, p = 0.002). c Increased fraction of VGLUT2 colocalized with C1q in PMC correlated with slower recovery time (more days return to preoperative grasp pattern; R2 = 0.589, p = 0.016). d Greater expression of C1q + hypertrophic microglia in M1 was correlated with faster recovery time (R2 = 0.533, p = 0.026). d Greater expression of C1q + ramified microglia in PMC was associated with slower recovery time (R2 = 0.490, p = 0.036). f A schematic showing summary of findings and proposed model of the lesion and EV treatment effects on microglia–synapse modulation and C1q signaling pathways. Cortical lesion in M1 induces acute damage in neuronal structures that triggers an acute increase in C1q + signaling cascade to initiate phagocytotic clearance. The veh group had accumulation of further damage and downstream C1q pathway related proteins that sustains a chronic pro-inflammatory response (C1q- hypertrophic microglia). The EV treatment upregulated C1q + mediated clearance of debris and facilitated an early shift to the anti-inflammatory C1q + hypertrophic microglia phenotype that persisted in the chronic stages, thereby supporting functional recovery

Update of

Similar articles

Cited by

References

    1. Winship IR, Murphy TH. Remapping the somatosensory cortex after stroke: insight from imaging the synapse to network. Neuroscientist. 2009;15:507–524. doi: 10.1177/1073858409333076. - DOI - PubMed
    1. Edwards I, Singh I, Rose’meyer R. The role of cortisol in the development of post-stroke dementia: a narrative review. Heart Mind. 2022;6:151. doi: 10.4103/hm.hm_32_22. - DOI
    1. Carmichael ST. Brain excitability in stroke: the Yin and Yang of stroke progression. Arch Neurol. 2012;69:161–167. doi: 10.1001/archneurol.2011.1175. - DOI - PMC - PubMed
    1. Patel AR, Ritzel R, McCullough LD, Liu F. Microglia and ischemic stroke: a double-edged sword. Int J Physiol Pathophysiol Pharmacol. 2013;5:73. - PMC - PubMed
    1. Brown GC, Neher JJ. Microglial phagocytosis of live neurons. Nat Rev Neurosci. 2014;15:209–216. doi: 10.1038/nrn3710. - DOI - PubMed

LinkOut - more resources