. 2023 Sep 2;14(1):5343.
doi: 10.1038/s41467-023-41028-9.

MAVS integrates glucose metabolism and RIG-I-like receptor signaling

Affiliations

MAVS integrates glucose metabolism and RIG-I-like receptor signaling

Qiao-Qiao He et al. Nat Commun. .

Abstract

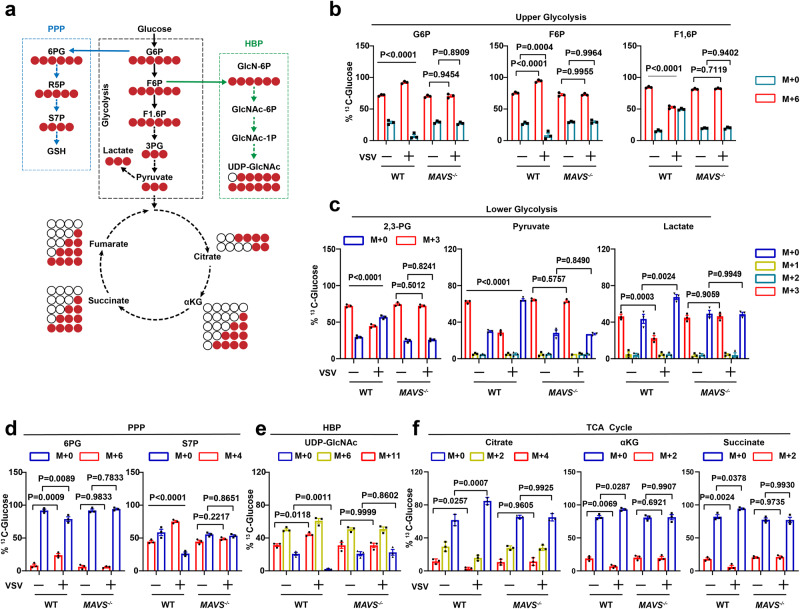
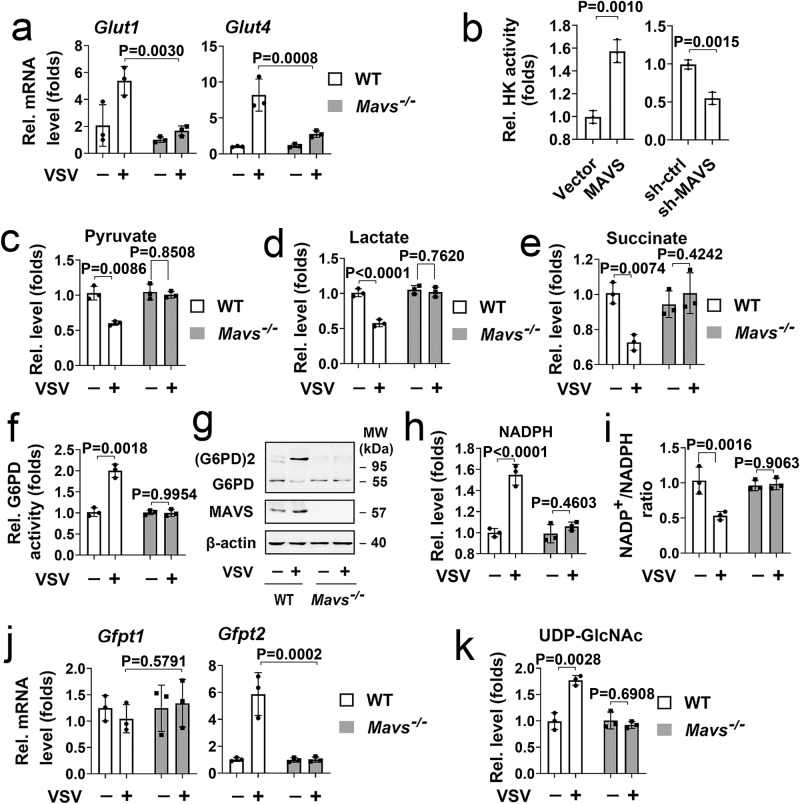
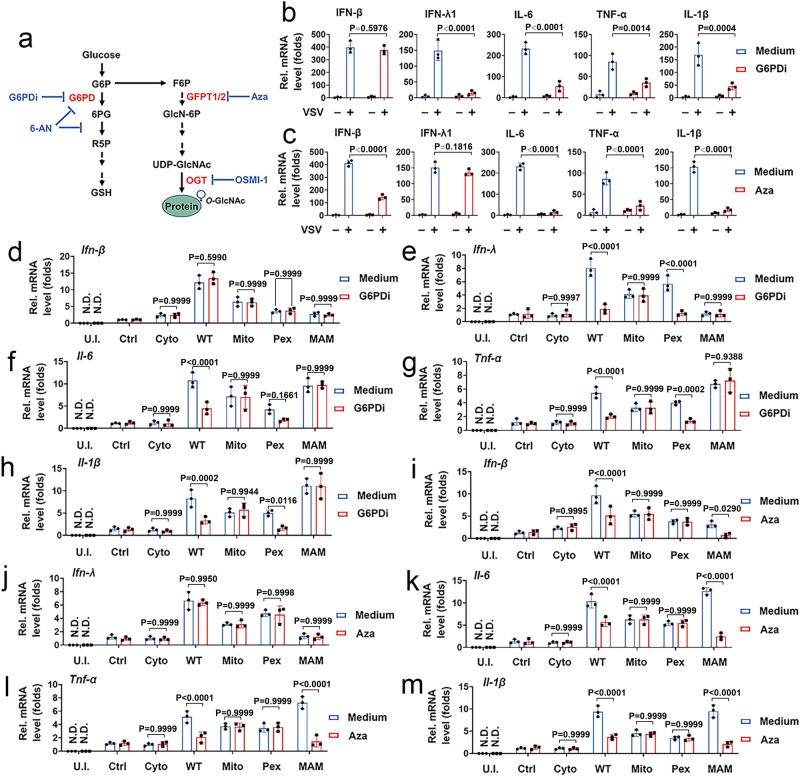
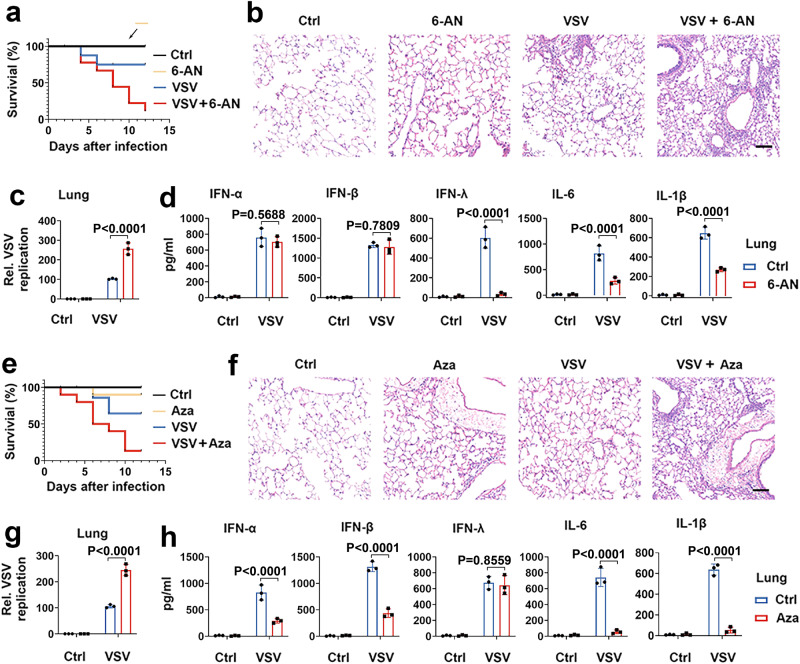
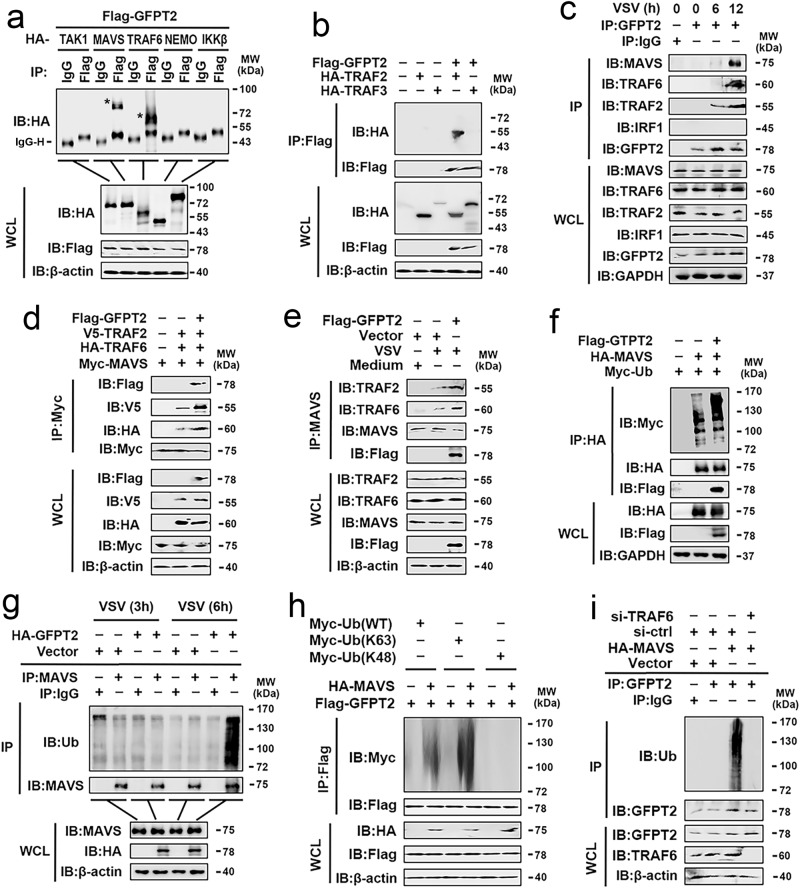
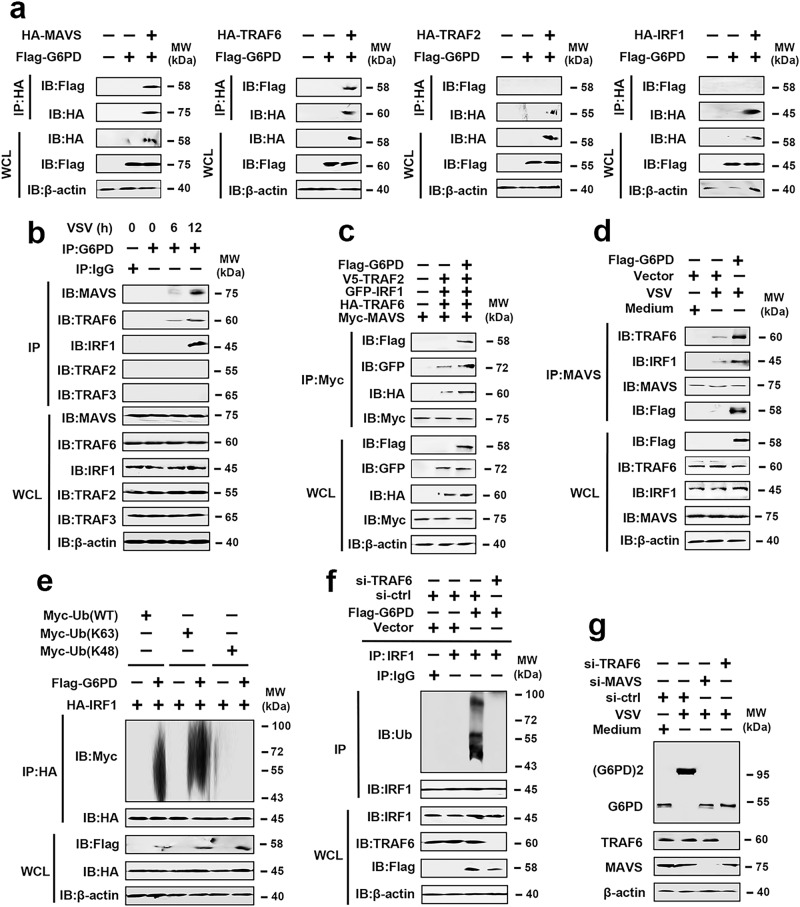
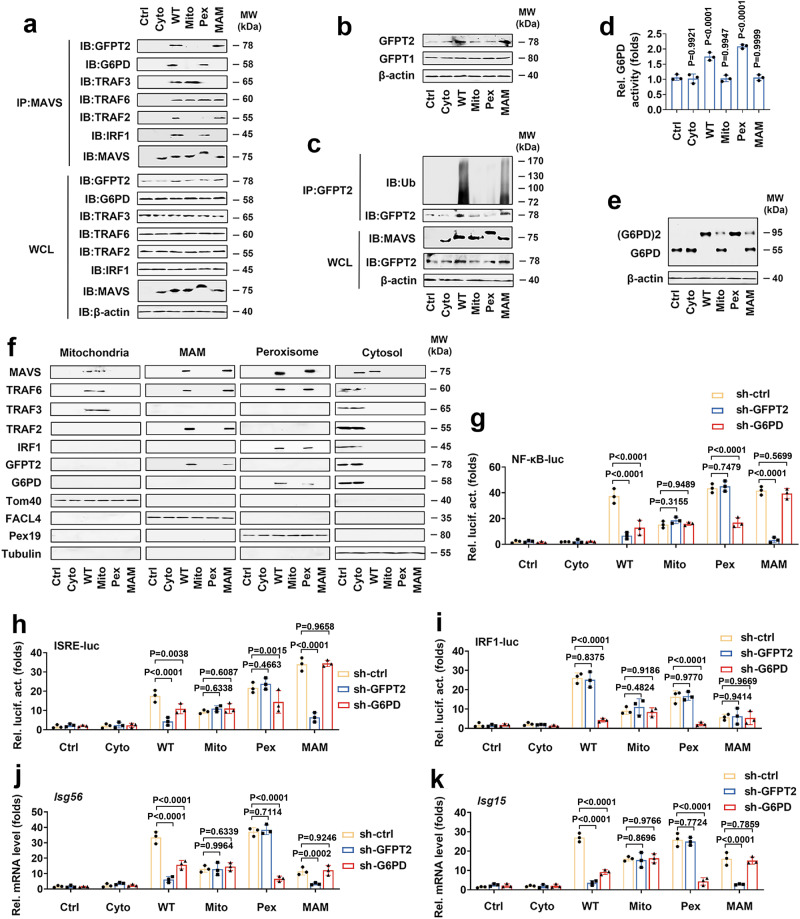
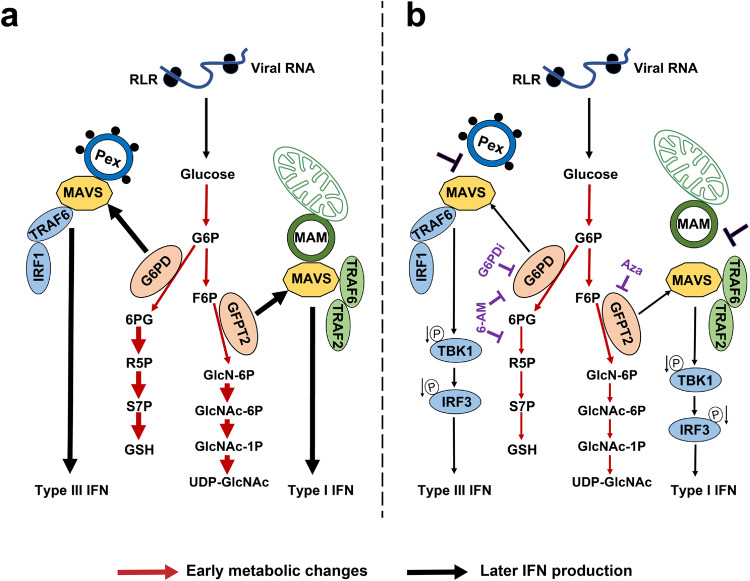
MAVS is an adapter protein involved in RIG-I-like receptor (RLR) signaling in mitochondria, peroxisomes, and mitochondria-associated ER membranes (MAMs). However, the role of MAVS in glucose metabolism and RLR signaling cross-regulation and how these signaling pathways are coordinated among these organelles have not been defined. This study reports that RLR action drives a switch from glycolysis to the pentose phosphate pathway (PPP) and the hexosamine biosynthesis pathway (HBP) through MAVS. We show that peroxisomal MAVS is responsible for glucose flux shift into PPP and type III interferon (IFN) expression, whereas MAMs-located MAVS is responsible for glucose flux shift into HBP and type I IFN expression. Mechanistically, peroxisomal MAVS interacts with G6PD and the MAVS signalosome forms at peroxisomes by recruiting TNF receptor-associated factor 6 (TRAF6) and interferon regulatory factor 1 (IRF1). By contrast, MAMs-located MAVS interact with glutamine-fructose-6-phosphate transaminase, and the MAVS signalosome forms at MAMs by recruiting TRAF6 and TRAF2. Our findings suggest that MAVS mediates the interaction of RLR signaling and glucose metabolism.


Conflict of interest statement

The authors declare no competing interests.

Figures

Fig. 1
Fig. 1. RLR activation shifts glucose flux from glycolysis to PPP and HBP via MAVS.
a Schematic of 13C6-glucose carbon labeling through glycolysis (upper and lower glycolysis), HBP, PPP, and TCA cycle. bf WT and Mavs−/− BMDMs were infected with or without VSV (MOI = 1) for 6 h. 13C-glucose incorporation into upper glycolytic metabolites (b), lower glycolysis (c), PPP (d), HBP (e), and the TCA cycle (f) were analyzed (n = 3 mice per condition, two-way ANOVA, mean ± SEM). See also Supplementary Fig. 1, 2. Source data are provided as a Source Data file.
Fig. 2
Fig. 2. RLR activation alters intermediates of glucose metabolism via MAVS.
a WT and Mavs−/−BMDMs were infected with or without VSV (MOI = 1) for 6 h before qPCR analyses (n = 3 mice per condition, repeated measures two-way ANOVA). b HepG2 cells were transfected with control vector or pCMV-MAVS (left panel), shRNA-control, or shRNA-MAVS (right panel) for 36 h, followed by an analysis of mitochondria HK activity (Data represent the means ± SD, two-sided Student’s t-test). ci WT and Mavs−/− BMDMs were infected with or without VSV (MOI = 1) for 6 h, followed by measuring total pyruvate (c), lactate (d), and succinate (e) levels, G6PD activity (f), or G6PD dimerization (g), and NADPH (h) and NADP+/NADPH (i) ratio levels. j WT and Mavs−/− BMDMs were infected with or without VSV (MOI = 1) for 6 h before qPCR analyses. k WT and Mavs−/− BMDMs were infected with or without VSV (MOI = 1) for 6 h, followed by measuring UDP-GlcNAc levels. Data in (cf) and (hk) are presented as means ± SEMs, n = 3 per condition, two-way ANOVA. See also Supplementary Fig. 3. Source data are provided as a Source Data file.
Fig. 3
Fig. 3. MAVS subcellular localization is critical for glucose metabolism reprogramming.
ae Mavs−/− BMDMs were transfected with a control vector or indicated MAVS alleles for 24 h. 13C6-glucose incorporation into upper glycolytic metabolites (a), lower glycolysis (b), the TCA cycle (c), the HBP (d), and the PPP (e) are presented as means ± SEMs, n = 3 per condition, repeated measures one-way ANOVA. See also Supplementary Figs. 4–6. Source data are provided as a Source Data file.
Fig. 4
Fig. 4. The PPP and the HBP regulate antiviral immune responses in response to RLR activation.
a Schematic of PPP and HBP. The enzyme/pathway targeted by each inhibitor is shown. b THP-1 cells were infected with or without VSV (MOI = 1) for 6 h and treated with or without G6DPi (50 μM for 4 h) before qPCR analyses. c Experiments were performed as described in (b), except that Aza (0.5 mM for 6 h) were used. dh Mavs−/− BMDMs were transfected with a control vector or indicated MAVS alleles for 24 h and treated with or without G6DPi (50 μM for 4 h) before qPCR. im Experiments were performed as described in (dh), except that Aza (0.5 mM for 6 h) was used. Data in (b) and (c) are presented as means ± SD, two-way ANOVA. Data in (dm) are expressed as means ± SEMs, n = 3 mice per condition, two-way ANOVA. See also Supplementary Figs. 7–9. Source data are provided as a Source Data file.
Fig. 5
Fig. 5. The PPP and the HBP are critical for the activation of antiviral immune signaling in vivo.
a C57BL/6 mice were infected with VSV (2 × 107 pfu/g) and treated with PBS (Ctrl) or 6-AN (4 mg/kg per day) by intraperitoneal injection. Survival curves show data collected until day 12 after infection. Statistical analysis was performed using the log-rank test (n = 5 for each group). b, c C57BL/6 mice were treated with PBS or 6-AN (4 mg/kg per day) for 24 h and infected with VSV (2 × 107 pfu/g) for 24 h, followed by an analysis of the lung tissue (b), VSV RNA in the lungs (c). Scale bar, 100 μm. d C57BL/6 mice were treated with PBS or 6-AN (4 mg/kg per day) for 24 h and infected with VSV (2 × 107 pfu/g) for 24 h, followed by an analysis of levels of proinflammatory cytokines and IFN in the lung. eh Experiments were performed as described in (ad), except that azaserine (Aza) (2.5 mg/kg per day) was used. Data in (c), (d), (g) and (h) are presented as means ± SEMs, n = 3 mice per condition, two-way ANOVA. See also Supplementary Fig. 10. Source data are provided as a Source Data file.
Fig. 6
Fig. 6. GFPT2 associates with the MAVS/TRAF2/TRAF6 complex.
a, b HEK293 cells were transfected with indicated plasmids for 48 h. Co-IP and immunoblot analyses were performed using the indicated antibodies. c A549 cells were mock-infected or infected with VSV (MOI = 1) for the indicated times and subjected to Co-IP and immunoblotting analysis with the indicated antibodies. d HEK293 cells were transfected with indicated plasmids for 48 h. Co-IP and immunoblot analyses were performed with the indicated antibodies. e A549 cells were transfected with vector control or Flag-GFPT2 for 36 h and infected with VSV (MOI = 1) for 12 h. Co-IP and immunoblot analyses were performed with the indicated antibodies. f HEK293 cells were transfected with HA-MAVS, FLAG-GFPT2, and myc-tagged ubiquitin (Ub) plasmids for 24 h. Co-IP and immunoblot analyses were performed with the indicated antibodies. g HEK293 cells were transfected with vector or GFPT2 expression plasmid. Twenty-four hours later, the cells were infected with VSV (MOI = 1) for 3 h or 6 h, respectively. Co-IP and immunoblot analyses were performed with the indicated antibodies. h A549 cells were transfected with indicated plasmids for 48 h. Co-IP and immunoblot analyses were performed with the indicated antibodies. i A549 cells were transfected with indicated plasmids or siRNAs for 36 h. Co-IP and immunoblot analyses were performed with the indicated antibodies. All experiments were repeated at least three times. See also Supplementary Fig. 11, 12. Source data are provided as a Source Data file.
Fig. 7
Fig. 7. G6PD is associated with the MAVS/TRAF6 complex.
a HEK293 cells were transfected with indicated plasmids for 48 h. Co-IP and immunoblot analyses were performed with the indicated antibodies. b THP-1 cells were mock-infected or infected with VSV (MOI = 1) for the indicated times and subjected to Co-IP and immunoblotting analysis with the indicated antibodies. c HEK293 cells were transfected with indicated plasmids for 48 h. Co-IP and immunoblot analyses were performed with the indicated antibodies. d THP-1 cells were transfected with vector control or Flag-G6PD for 36 h and infected with VSV (MOI = 1) for 6 h. Co-IP and immunoblot analyses were performed with the indicated antibodies. e HEK293 cells were transfected with indicated plasmids for 48 h. Co-IP and immunoblot analyses were performed with the indicated antibodies. f THP-1 cells were transfected with vector control, Flag-G6PD, si-ctrl, or si-TRAF6 for 36 h. Co-IP and immunoblot analyses were performed with the indicated antibodies. g THP-1 cells were transfected with vector si-ctrl, si-MAVS, or si-TRAF6 for 36 h and infected with VSV (MOI = 1) for 6 h, followed by an analysis of G6PD dimerization. All experiments were repeated at least three times. See also Supplementary Fig. 13. Source data are provided as a Source Data file.
Fig. 8
Fig. 8. The specific subcellular localization of MAVS regulates different signaling pathways via the recruitment of GFPT2/TRAF6/TRAF2 or G6PD/TRAF6/IRF1.
ac Mavs−/− BMDMs were transfected with a control vector or indicated MAVS alleles for 48 h. Co-IP and immunoblot analyses (a, c) and Western blot analyses (b) were performed with the indicated antibodies. d, e Mavs−/− BMDMs were transfected with the control vector or indicated MAVS alleles for 48 h, followed by an analysis of G6PD activity (d) or G6PD dimerization (e) (n = 3 mice per condition, means ± SEMs, one-way ANOVA). f Mavs−/− BMDMs were transfected with the control vector or indicated MAVS alleles for 48 h. Subcellular fractions were isolated for immunoblot analysis. Fractionation markers: mitochondria (Tom40); MAMs (FACL4); peroxisomes (Pex19); cytosol (Tubulin). g Mavs−/− BMDMs were transfected with NF-κB-luc and indicated MAVS alleles for 48 h before luciferase assays. h, i Experiments were performed similar to those in (g), except ISRE-luc (h) or IRF1-luc (i) were used. j, k Mavs−/− BMDMs were transfected with si-ctrl, si-GFPT2, si-G6PD, or indicated MAVS alleles for 36 h before qPCR analyses. Data in (ac, f) are representative from three independent experiments. Data in (gk) are presented as means ± SEMs, n = 3 mice per condition, two-way ANOVA. See also Supplementary Fig. 14. Source data are provided as a Source Data file.
Fig. 9
Fig. 9. A hypothetical model for differential MAVS placement regulating metabolism and innate immunity.
In RLR signaling, MAVS translocated to peroxisomes and recruits G6PD, leading to the activation of the PPP. Then, TRAF6 and IRF1 interact with MAVS initiating signaling cascades that lead to the production of type III IFN. Conversely, MAVS translocated to MAMs and recruits GFPT2, leading to the activation of the HBP. Then, TRAF6, and TRAF2 interact with MAVS, leading to the production of type I IFN (a) (Fig. 9a). When PPP and HBP are inhibited by drugs (b) (Fig. 9b), phosphorylation of TBK1 and IRF3 downstream of MAVS is inhibited, resulting in a decrease of the respective IFN responses. Red arrows indicate early metabolic changes. Black arrows indicate later IFN production. The thickness of the arrow represents the enhancement or weakening of the reaction.

Similar articles

Cited by

References

    1. Puleston DJ, Villa M, Pearce EL. Ancillary activity: beyond core metabolism in immune cells. Cell Metab. 2017;26:131–141. doi: 10.1016/j.cmet.2017.06.019. - DOI - PMC - PubMed
    1. Lin J, Liu G, Chen L, Kwok HF, Lin Y. Targeting lactate-related cell cycle activities for cancer therapy. Semin. Cancer Biol. 2022;86:1231–1243. doi: 10.1016/j.semcancer.2022.10.009. - DOI - PubMed
    1. Wolf AJ, et al. Hexokinase is an innate immune receptor for the detection of bacterial peptidoglycan. Cell. 2016;166:624–636. doi: 10.1016/j.cell.2016.05.076. - DOI - PMC - PubMed
    1. Chen L, et al. NADPH production by the oxidative pentose-phosphate pathway supports folate metabolism. Nat. Metab. 2019;1:404–415. doi: 10.1038/s42255-019-0043-x. - DOI - PMC - PubMed
    1. Garcia-Dominguez E, et al. Glucose 6-P dehydrogenase-an antioxidant enzyme with regulatory functions in skeletal muscle during exercise. Cells. 2022;11:3041. doi: 10.3390/cells11193041. - DOI - PMC - PubMed

Publication types

LinkOut - more resources