. 2023 Sep 2;14(1):5350.
doi: 10.1038/s41467-023-40826-5.

Theranostic imaging and multimodal photodynamic therapy and immunotherapy using the mTOR signaling pathway

Affiliations

Theranostic imaging and multimodal photodynamic therapy and immunotherapy using the mTOR signaling pathway

Huiling Zhou et al. Nat Commun. .

Abstract

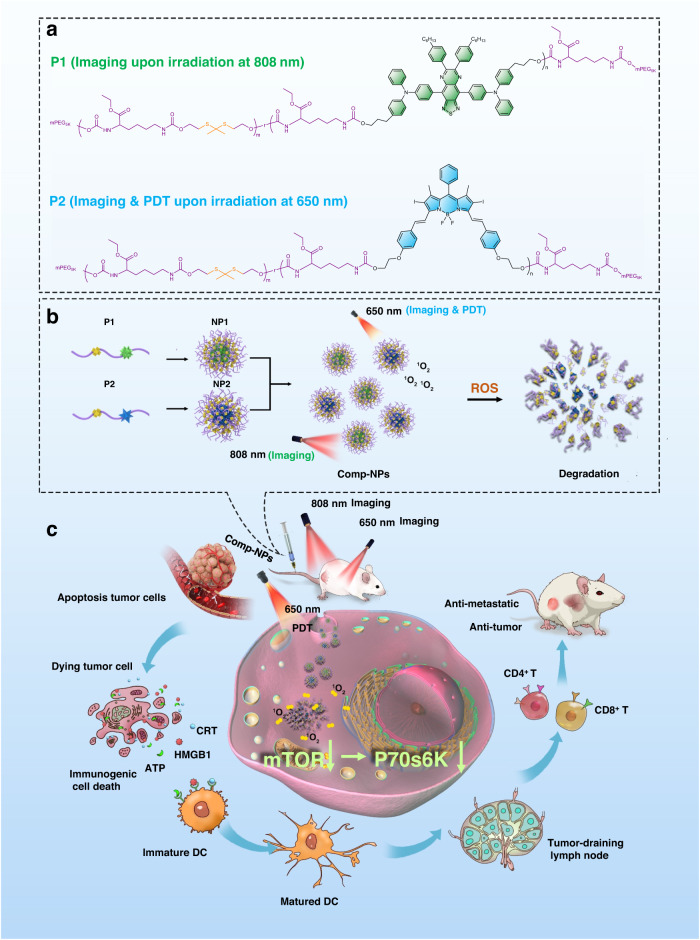
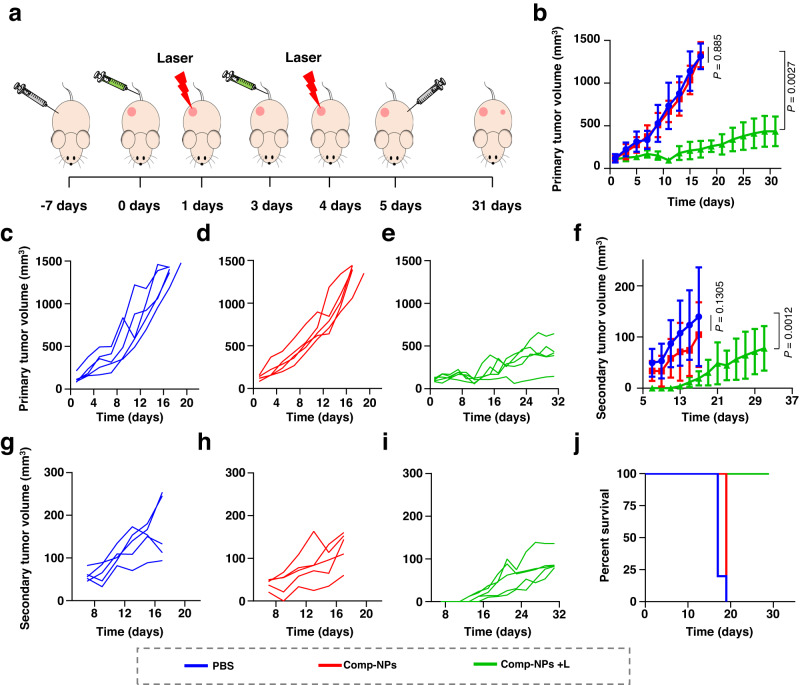
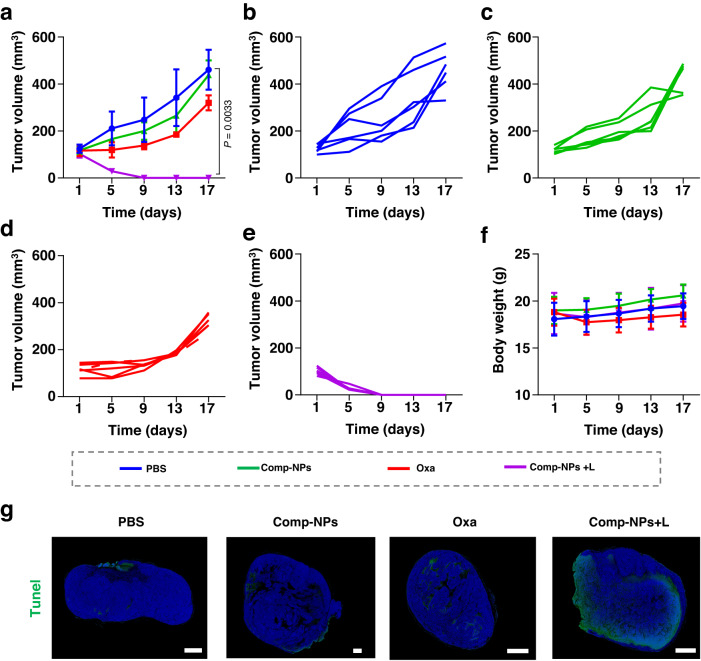
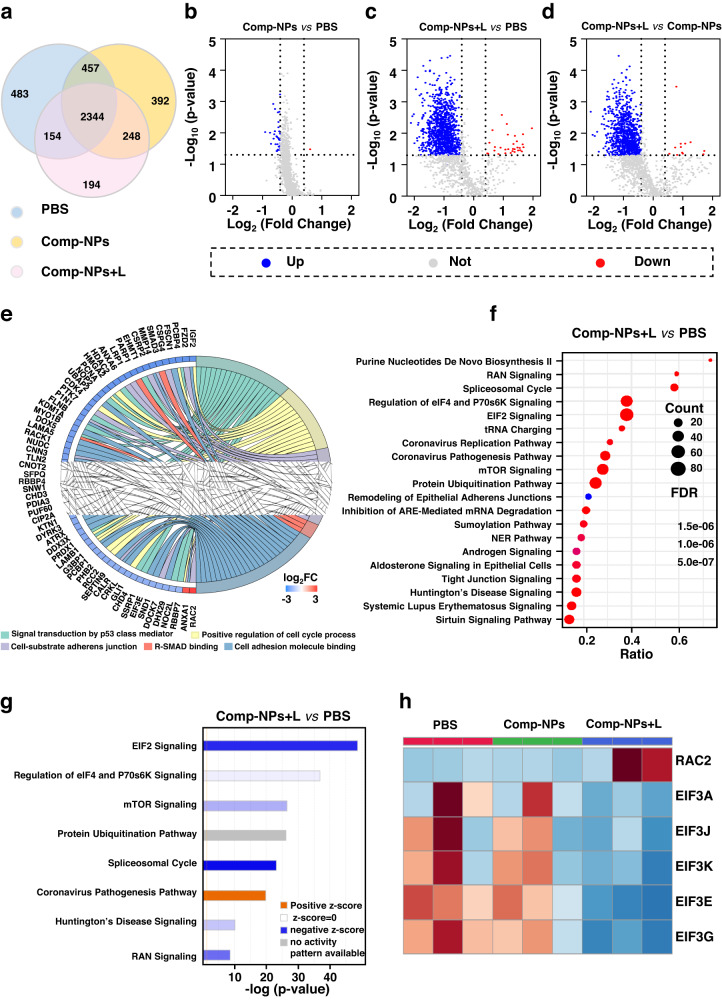
Tumor metastases are considered the leading cause of cancer-associated deaths. While clinically applied drugs have demonstrated to efficiently remove the primary tumor, metastases remain poorly accessible. To overcome this limitation, herein, the development of a theranostic nanomaterial by incorporating a chromophore for imaging and a photosensitizer for treatment of metastatic tumor sites is presented. The mechanism of action reveals that the nanoparticles are able to intervene by local generation of cellular damage through photodynamic therapy as well as by systemic induction of an immune response by immunotherapy upon inhibition of the mTOR signaling pathway which is of crucial importance for tumor onset, progression and metastatic spreading. The nanomaterial is able to strongly reduce the volume of the primary tumor as well as eradicates tumor metastases in a metastatic breast cancer and a multi-drug resistant patient-derived hepatocellular carcinoma models in female mice.


Conflict of interest statement

The authors declare no competing interests.

Figures

Fig. 1
Fig. 1. Structures and mechanism of action of Comp-NPs for the diagnosis by imaging and treatment of tumors by multimodal photodynamic therapy and immunotherapy.
a Chemical structures of a polymer incorporating a chromophore for imaging upon irradiation at 808 nm (P1) or a photosensitizer for PDT upon irradiation at 650 nm (P2). b Self-assembly of the polymers into the nanoparticles NP1 and NP2. The theranostic nanoparticle formulation Comp-NPs is generated by mixing NP1 and NP2. c Biological mechanism of action of Comp-NPs by combined photodynamic therapy and immunotherapy.
Fig. 2
Fig. 2. Physical and photophysical characterization of Comp-NPs.
ac Absorption and phosphorescence spectra of M1 in DCM (a, λex = 650 nm), M2 in DCM (b, λex = 808 nm) and Comp-NPs in phosphate-buffered saline (c, λex = 808 nm) (n = 3 independent samples). d Representative transmission electron microscope image of Comp-NPs. (n = 3 independent samples). The experiment was repeated independently 3 times with similar results. scale bar = 200 nm. e Representative scanning transmission electron microscopy coupled with energy-dispersive X-ray spectroscopy images of Comp-NPs for oxygen, sulfur, fluorine, and nitrogen. scale bar = 50 nm. (n = 3 independent samples). f Size distribution of Comp-NPs in water determined by dynamic light scattering measurements. g Electron paramagnetic resonance spectra of Comp-NPs with or without laser irradiation (wavelength: 650 nm, power: 0.1 W cm−2, 60 J cm−2 time: 10 min) (n = 3 independent samples). h, i Gel permeation chromatography (GPC) measurements of P1 or P2 upon the addition of H2O2. (n = 3 independent samples). j TEM images of Comp-NPs and upon addition of H2O2. k Average particle size (left) and particle size distribution (right) of Comp-NPs in the presence or absence of 10 mM H2O2 measured by dynamic light scattering (n = 3 independent samples). scale bar = 200 nm. Error bars represent mean ± SD. Source data are provided as a Source Data file.
Fig. 3
Fig. 3. Cellular uptake, ROS generation, and cell death mechanism of Comp-NPs in a 4T1 monolayer cancer cell model or 4T1 multicellular tumor spheroids.
a CLSM images of 4T1 cells incubated with Comp-NPs at 37°C for 1 h, 4 h and 7 h. The experiment was repeated independently 3 times with similar results. scale bar = 10 μm. b CLSM images of 4T1 MCTS with a diameter of ~700 μm incubated with Comp-NPs at 37 °C for 7 h and the ROS specific probe for 30 min, followed by exposure to irradiation (650 nm, 0.1 W cm−2, 30 J cm−2, 5 min). The experiment was repeated independently 3 times with similar results. scale bar = 100 μm. c CLSM images of 4T1 cells incubated with the CRT fluorescent probe (CRT, green) and DAPI (blue) upon various treatments in the light (650 nm, 0.1 W cm−2, 2 min). scale bar = 20 μm. d, e Quantification of the translocation of CRT to the cell surface of 4T1 cells and quantification of extracellular adenosine triphosphate (ATP)upon various treatments in the light (650 nm, 0.1 W cm−2, 2 min) by flow cytometry (n = 3 biologically independent samples). f CLSM images of 4T1 cells incubated with the HMGB1 protein fluorescent probe (HMGB1, green) and DAPI (blue) upon various treatments in the light (650 nm, 0.1 W cm−2, 2 min). scale bar = 20 μm. g Quantification of the release of the HMGB1 protein from (f) (n = 5 biologically independent cells). h Cell migration wound healing assay of 4T1 cells upon various treatments in the light (650 nm, 0.1 W cm−2, 30 J cm−2, 5 min). The experiment was repeated independently 3 times with similar results. scale bar = 50 μm. i, j Quantification of the maturation of DCs upon various treatments in the light (650 nm, 0.1 W cm−2, 30 J cm−2, 5 min) (n = 3 biologically independent samples). Statistical analysis was performed by one-way ANOVA with Tukey’s multiple comparisons test. All data are presented as mean ± SD. Source data are provided as a Source Data file.
Fig. 4
Fig. 4. Imaging and PDT properties of Comp-NPs were evaluated in a 4T1 tumor-bearing mouse model.
a Biodistribution of Comp-NPs inside the living animal model determined upon irradiation at 808 nm and 650 nm. b Phosphorescence images of the major organs and the tumor after the sacrifice of the mouse model which was 48 h before intravenously injected in the tail vein with Comp-NPs. λex = 650 nm, λem = 735 nm. c Quantification of the accumulation of Comp-NPs from (b) (n = 3 mice). Error bars represent mean ± SD. d Tumor growth inhibition curves (n = 5 mice) upon treatments with Comp-NPs (6 mg BODIPY kg−1) or cisplatin (0.5 mg Pt kg−1) in the dark or upon irradiation (650 nm, 0.1 W cm−2, 60 J cm−2, 10 min). Error bars represent mean ± SD. Statistical analysis was performed by two-tailed unpaired t test. e Body weight of the mice (n = 5 mice) upon various treatments with Comp-NPs (6 mg BODIPY kg−1) or cisplatin (0.5 mg Pt kg−1) in the dark or upon irradiation (650 nm, 0.1 W cm−2, 60 J cm−2, 10 min). Error bars represent mean ± SD. Statistical analysis was performed by one-way ANOVA with a Tukey’s multiple comparisons test. f Photographs of the tumors after various treatments. (n = 5 mice). g Weight of the tumors from (f) (n = 5 mice). Error bars represent mean ± SD. Statistical analysis was performed by one-way ANOVA with Tukey’s multiple comparisons test. h Photographs of metastatic nodules (highlighted white circles) in the lungs and H&E stain of tissue slices of this organ. scale bar = 100 μm. i Quantification of the amount of metastatic lung nodules after various treatments (n = 5 mice). Error bars represent mean ± SD. Statistical analysis was performed by two-tailed unpaired t test as a Source Data file.
Fig. 5
Fig. 5. Mechanism of the immunogenic PDT response inside a 4T1 tumor-bearing mouse model upon treatment with Comp-NPs and exposure to irradiation.
a Schematic diagram of immune response test after Comp-NPs upon the 650 nm laser. b CLSM images of tumor slices obtained from variously treated 4T1 mouse xenograft models incubated with DAPI (blue, λex = 410 nm, λem = 506 nm) and top: CRT specific fluorescent probe (CRT, red, λex = 488 nm, λem = 525 nm), middle: HMGB1 protein fluorescent probe (HMGB1, red, λex = 488 nm, λem = 525 nm), bottom: CD8+ T-cells fluorescent probe (red, λex = 488 nm, λem = 525 nm). (The images are representative of 3 mice per group). The experiment was repeated independently 3 times with similar results. scale bar = 20 μm. cd Analysis of the levels of activated dendritic cells (CD80+, CD86+) in tumor slices obtained from variously treated 4T1 mouse models (n = 3 mice). Error bars represent mean ± SD. Statistical analysis was performed by two-tailed unpaired t test. e, f Analysis of the levels of activated dendritic cells (CD80+, CD86+) in lymph nodes slices obtained from variously treated 4T1 mouse models. (n = 3 mice). Error bars represent mean ± SD. Statistical analysis was performed by two-tailed unpaired t test. g, h Analysis of the levels of effector T-cells (activated CD8+ T-cells, activated CD4+ T-cells) in tumor slices obtained from variously treated 4T1 mouse models. (n = 3 mice). Error bars represent mean ± SD. Statistical analysis was performed by two-way ANOVA with Šídák’s multiple comparisons test. Source data are provided as a Source Data file.
Fig. 6
Fig. 6. PDT properties of Comp-NPs evaluated in a mouse model bearing a primary and secondary distant tumor.
a Schematic illustration of the establishment of a dual primary and secondary tumor mouse model, administration and treatment schedules with Comp-NPs (6 mg BODIPY kg−1) in the dark or upon irradiation (650 nm, 0.1 W cm−2, 60 J cm−2, 10 min). Phosphate-buffered saline (PBS) was used as a control. b Mean tumor growth inhibition curves (n = 5 mice) of the primary tumor upon treatment. Error bars represent mean ± SD. Statistical analysis was performed by two-tailed unpaired t test. ce Individual tumor growth inhibition curves (n = 5 mice) of the primary tumor upon treatment. f Mean tumor growth inhibition curves (n = 5 mice) of the secondary tumor upon treatment. Error bars represent mean ± SD. Statistical analysis was performed by two-tailed unpaired t test. gi Individual tumor growth inhibition curves of the secondary tumor upon treatment. j Long-term survival of the animal models (n = 5 mice) upon treatment. Source data are provided as a Source Data file.
Fig. 7
Fig. 7. PDT properties of Comp-NPs (6 mg BODIPY kg−1) in comparison to clinically approved chemotherapeutic drug oxaliplatin (Oxa, 0.5 mg Pt kg−1) in the dark or upon irradiation (650 nm, 0.1 W cm−2, 60 J cm−2, 10 min) evaluated in a multi-drug resistant patient-derived breast carcinoma inside a mouse model.
a Cumulative tumor growth inhibition curves (n = 6 mice) upon treatment. Error bars represent mean ± SD. Statistical analysis was performed by two-tailed unpaired t test. be Individual tumor growth inhibition curves (n = 6 mice) upon treatment. f Body weight of the mice (n = 6 mice) upon treatment. Error bars represent mean ± SD. g Terminal deoxynucleotidyl transferase dUTP nick end labeling (green) and DAPI (blue) stain of tumor tissue slices after various treatments (the images are representative of 6 mice per group). scale bar = 1 mm. Source data are provided as a Source Data file.
Fig. 8
Fig. 8. PDT properties of Comp-NPs evaluated towards a multi-drug resistant patient-derived hepatocellular carcinoma inside a mouse model.
a Schematic illustration of the establishment of the mouse model as well as the subsequent administration and treatment schedules with Comp-NPs. Phosphate-buffered saline (PBS) and cisplatin (CisPt) were used as controls. b Tumor growth inhibition curves (n = 5 mice) upon treatments with Comp-NPs (6 mg BODIPY kg−1) or cisplatin (0.5 mg Pt kg−1) in the dark or upon irradiation (650 nm, 0.1 W cm−2, 60 J cm−2, 10 min). Error bars represent mean ± SD. Statistical analysis was performed by two-tailed unpaired t test. c Body weight of the mice (n = 5 mice) upon various treatments with Comp-NPs (6 mg BODIPY kg−1) or cisplatin (0.5 mg Pt kg−1) in the dark or upon irradiation (650 nm, 0.1 W cm−2, 60 J cm−2, 10 min). Error bars represent mean ± SD. d Photographs of the tumors after various treatments. e Weight of the tumors from (d) (n = 5 mice). Error bars represent mean ± SD. Statistical analysis was performed by two-tailed unpaired t test. f H&E as well as terminal deoxynucleotidyl transferase dUTP nick end labeling stain of tumor tissue slices. (The images are representative of 5 mice per group). The experiment was repeated independently 3 times with similar results. Tunel: scale bar = 50 μm. H&E: scale bar = 100 μm. Source data are provided as a Source Data file.
Fig. 9
Fig. 9. Biochemical mechanism of action of the treatment of multi-drug resistant patient-derived hepatocellular carcinoma inside a mouse model with Comp-NPs.
a Venn diagram of the number of proteins detected upon the respective treatment (n = 3 mice). bd Volcanic plot of the differences in protein expression levels inside the animal models upon the respective treatment. The up-regulated proteins are highlighted in blue, down-regulated proteins are highlighted in red, and the unchanged proteins are marked in gray (Log2FC > 0.8 and p < 0.05) (n = 3 mice). Statistical analysis was performed by two-tailed unpaired t test. e Proteins enrichment GOcircos analysis upon treatment with Comp-NPs and exposure to irradiation (n = 3 mice). f KEGG pathway enrichment analysis upon treatment with Comp-NPs and exposure to irradiation (n = 3 mice). Statistical analysis was performed by two-tailed unpaired t test. g Positive and negative correlation of differential pathway analysis upon treatment with Comp-NPs and exposure to irradiation (n = 3 mice). Statistical analysis was performed by two-tailed unpaired t test. h Expression of mTOR pathway-related proteins (n = 3 mice).
Fig. 10
Fig. 10. PDT properties of Comp-NPs evaluated in a mouse model bearing a 4T1 tumor.
a Schematic illustration of the establishment of the tumor mouse model, administration and treatment schedules with Comp-NPs (6 mg BODIPY kg−1), Leucien, and/or αCD8 in the dark or upon irradiation (650 nm, 0.1 W cm−2, 60 J cm−2, 10 min). Phosphate-buffered saline (PBS) was used as a control. b Mean tumor growth inhibition curves (n = 6 mice) of the tumor upon treatment. Error bars represent mean ± SD. Statistical analysis was performed by one-way ANOVA with Tukey’s multiple comparisons test. c Body weight of the mice (n = 6) upon treatment. Error bars represent mean ± SD. d, e Analysis of the levels of CD8+ T-cells inside the spleens of the treated mouse models (n = 3 mice). Error bars represent mean ± SD. Statistical analysis was performed by two-tailed unpaired t test. Source data are provided as a Source Data file.

References

    1. Steeg PS. Targeting metastasis. Nat. Rev. Cancer. 2016;16:201–218. - PMC - PubMed
    1. Massagué J, Obenauf AC. Metastatic colonization by circulating tumour cells. Nature. 2016;529:298–306. - PMC - PubMed
    1. Chaffer CL, Weinberg RA. A perspective on cancer cell metastasis. Science. 2011;331:1559–1564. - PubMed
    1. Fidler IJ. The pathogenesis of cancer metastasis: the ‘seed and soil’ hypothesis revisited. Nat. Rev. Cancer. 2003;3:453–458. - PubMed
    1. Nishikawa M. Reactive oxygen species in tumor metastasis. Cancer Lett. 2008;266:53–59. - PubMed

Publication types

Substances