

Heptanoic and medium branched-chain fatty acids as anaplerotic treatment for medium chain acyl-CoA dehydrogenase deficiency
- PMID: 37660571
- PMCID: PMC10840664
- DOI: 10.1016/j.ymgme.2023.107689
Heptanoic and medium branched-chain fatty acids as anaplerotic treatment for medium chain acyl-CoA dehydrogenase deficiency
Abstract
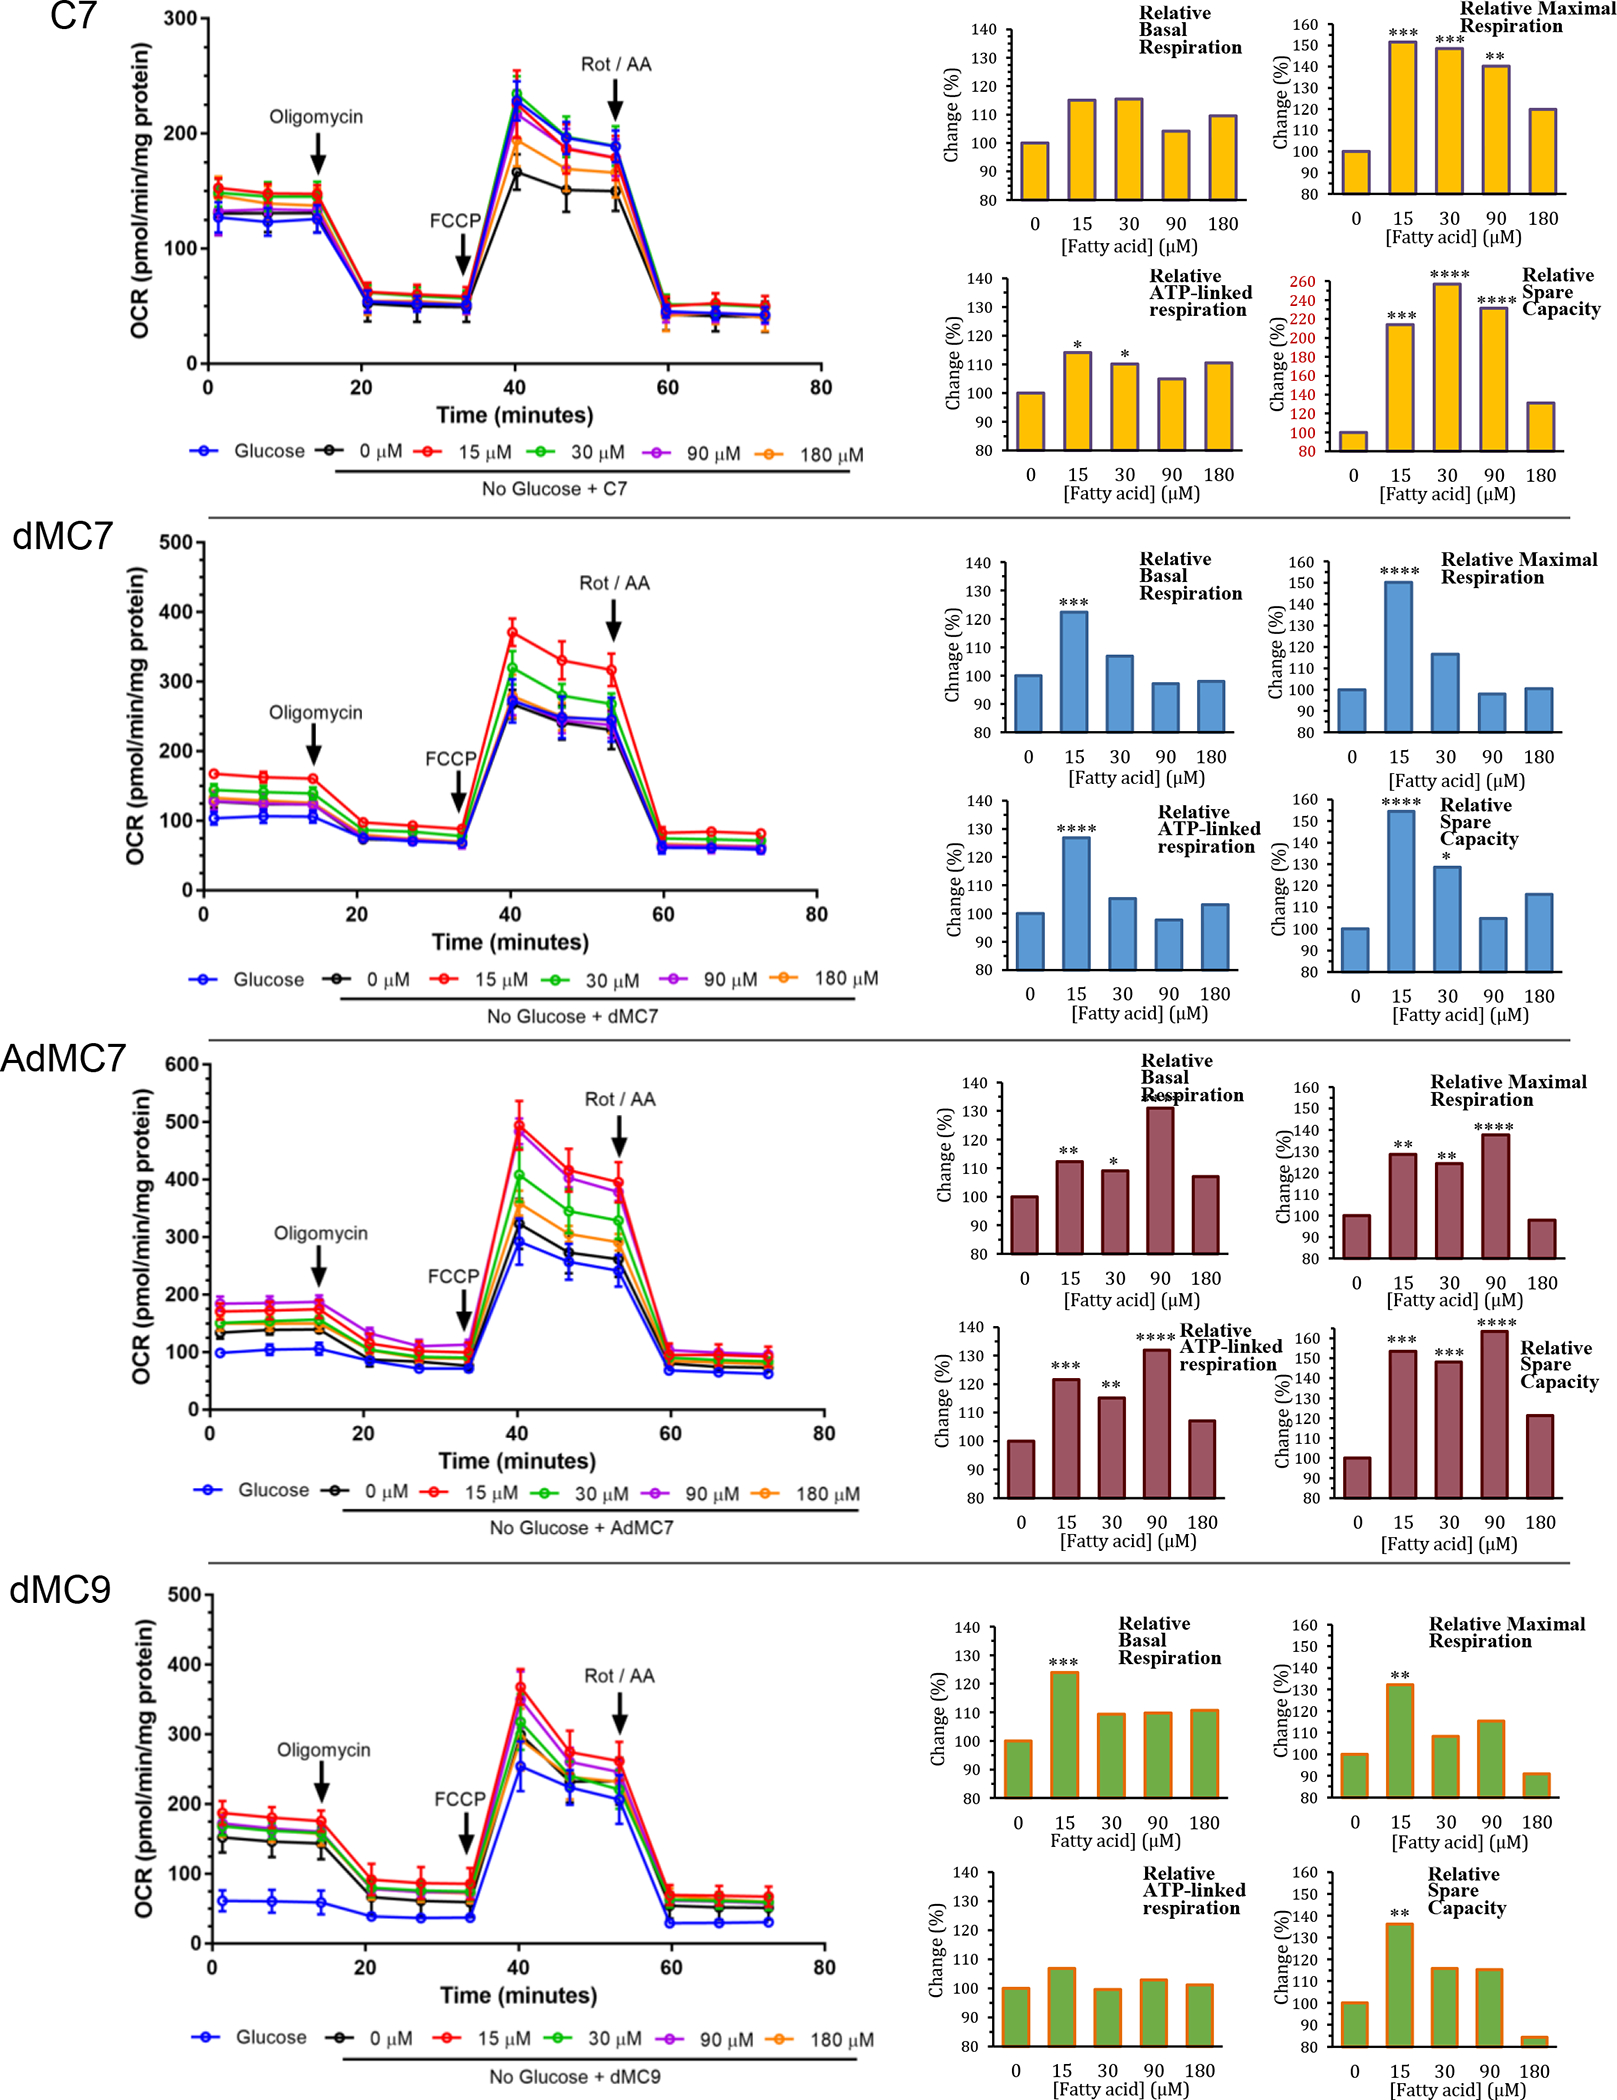
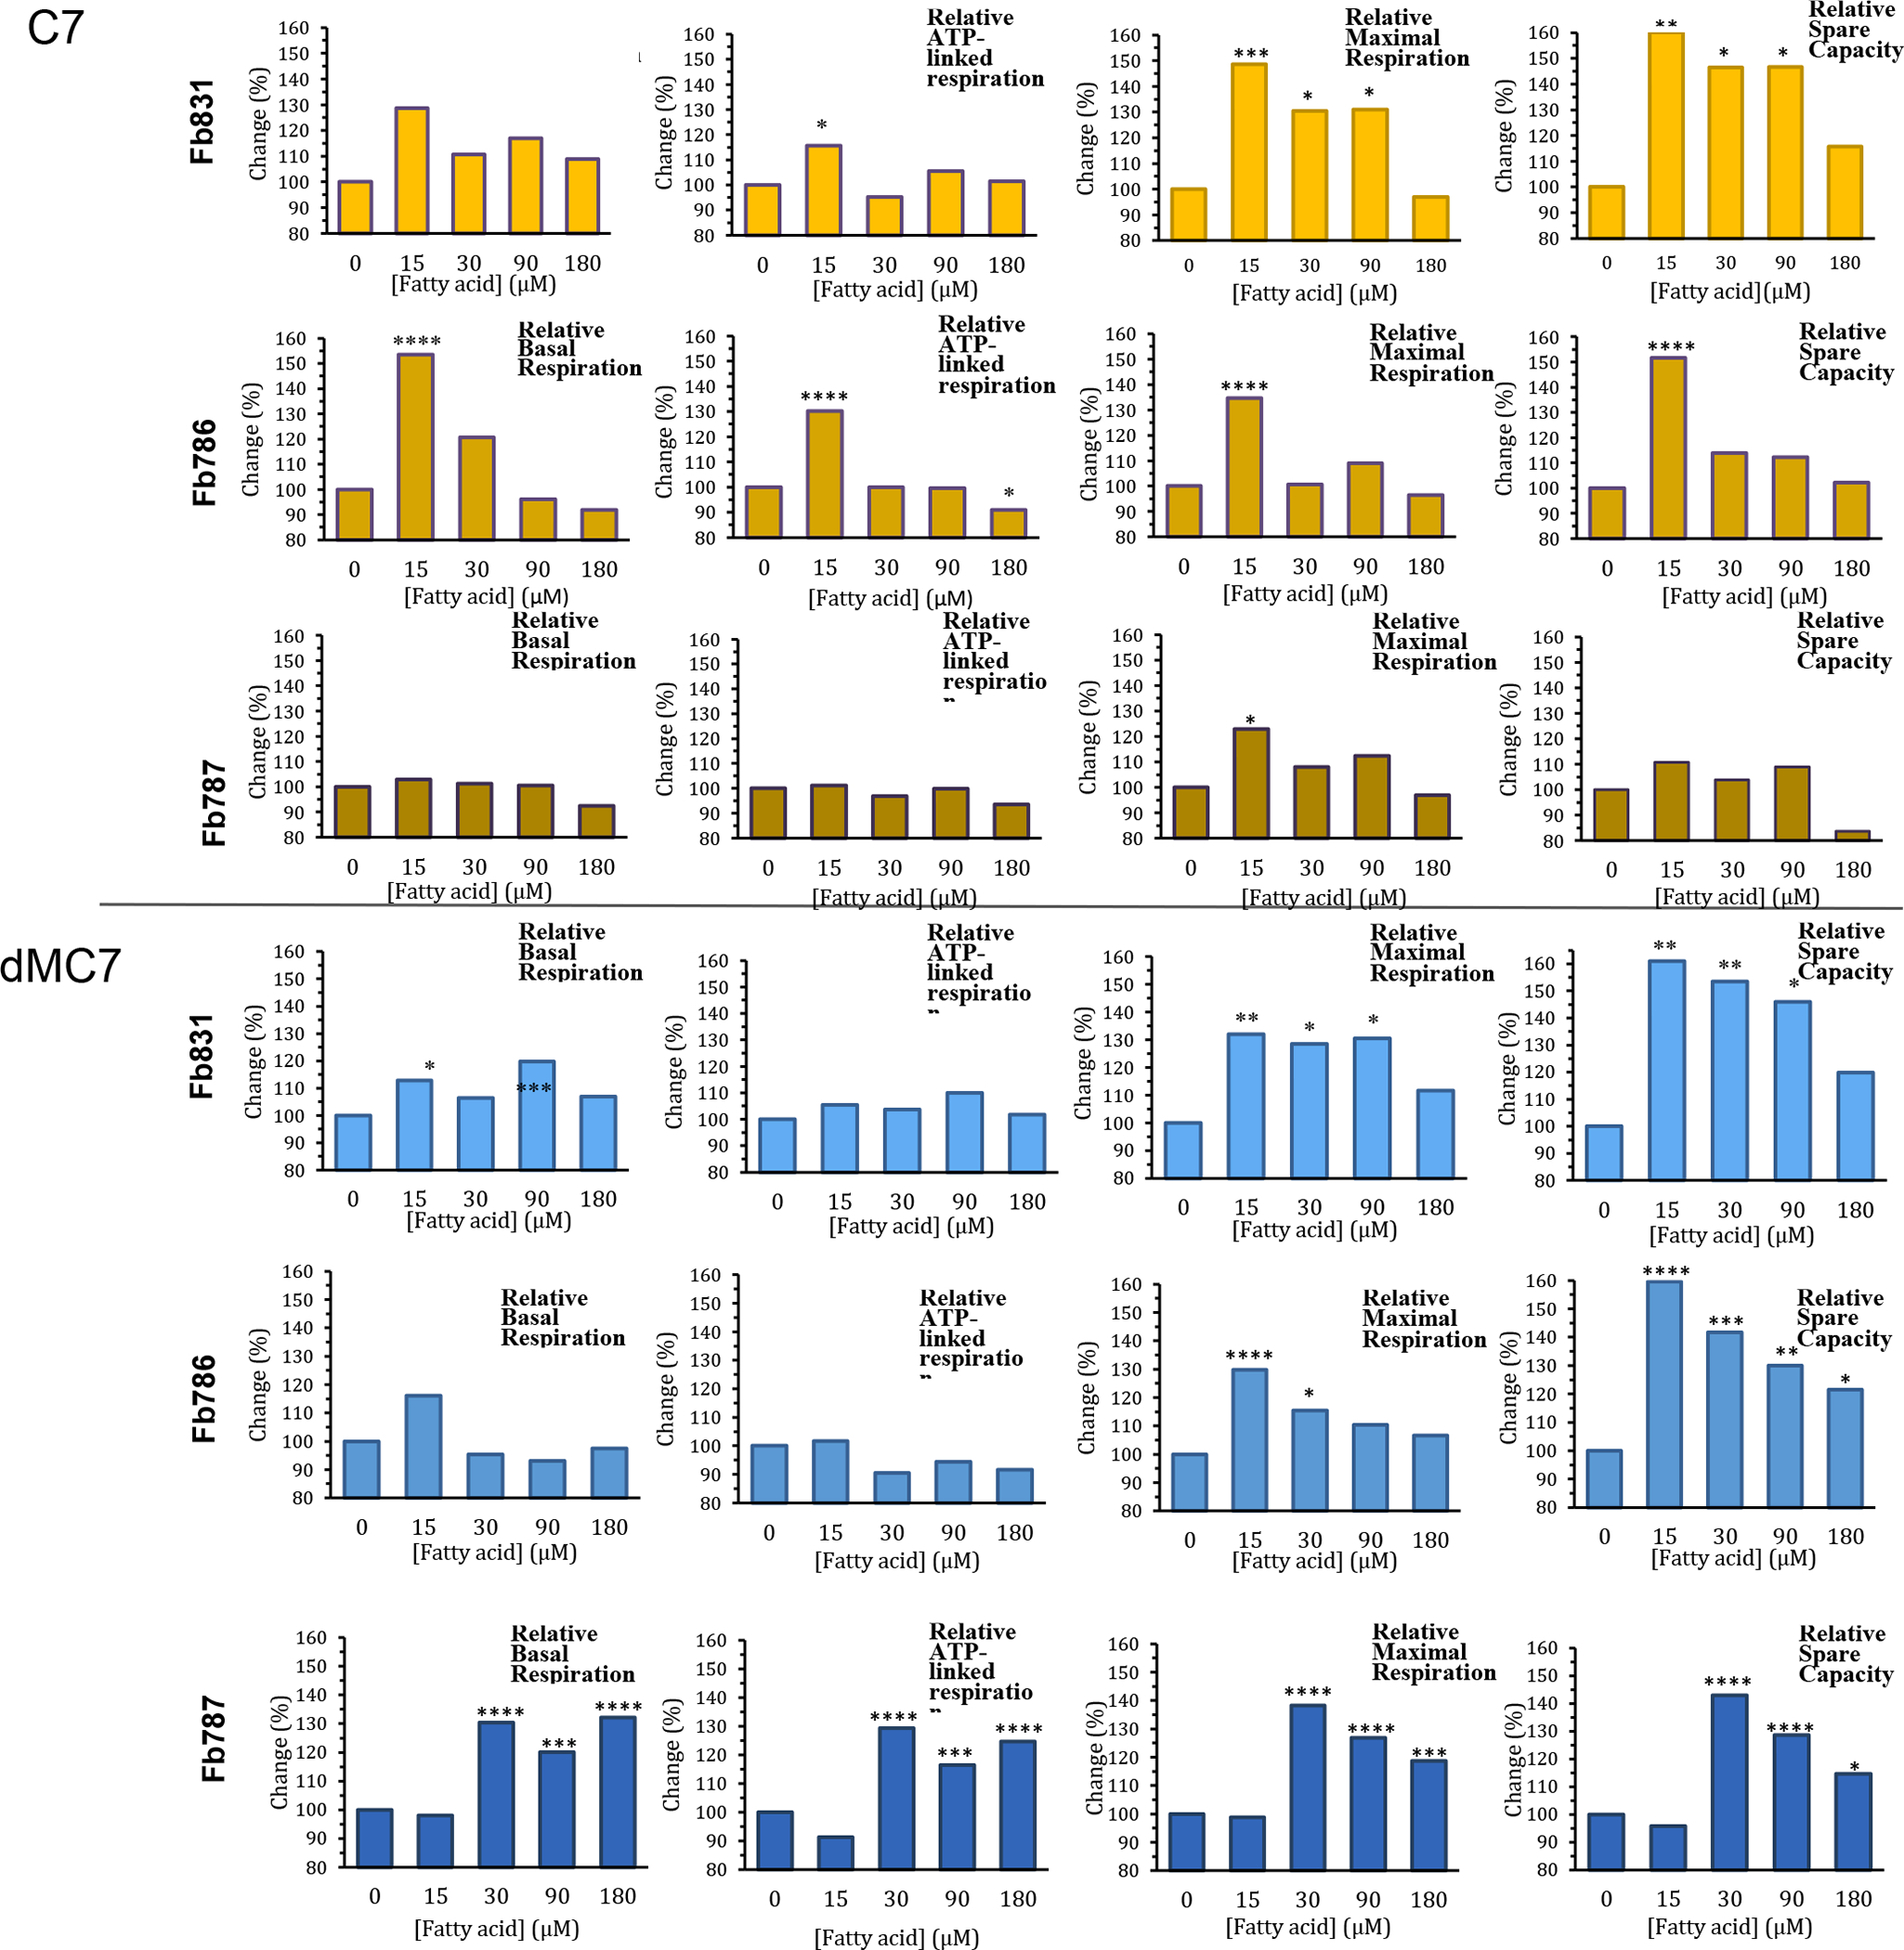
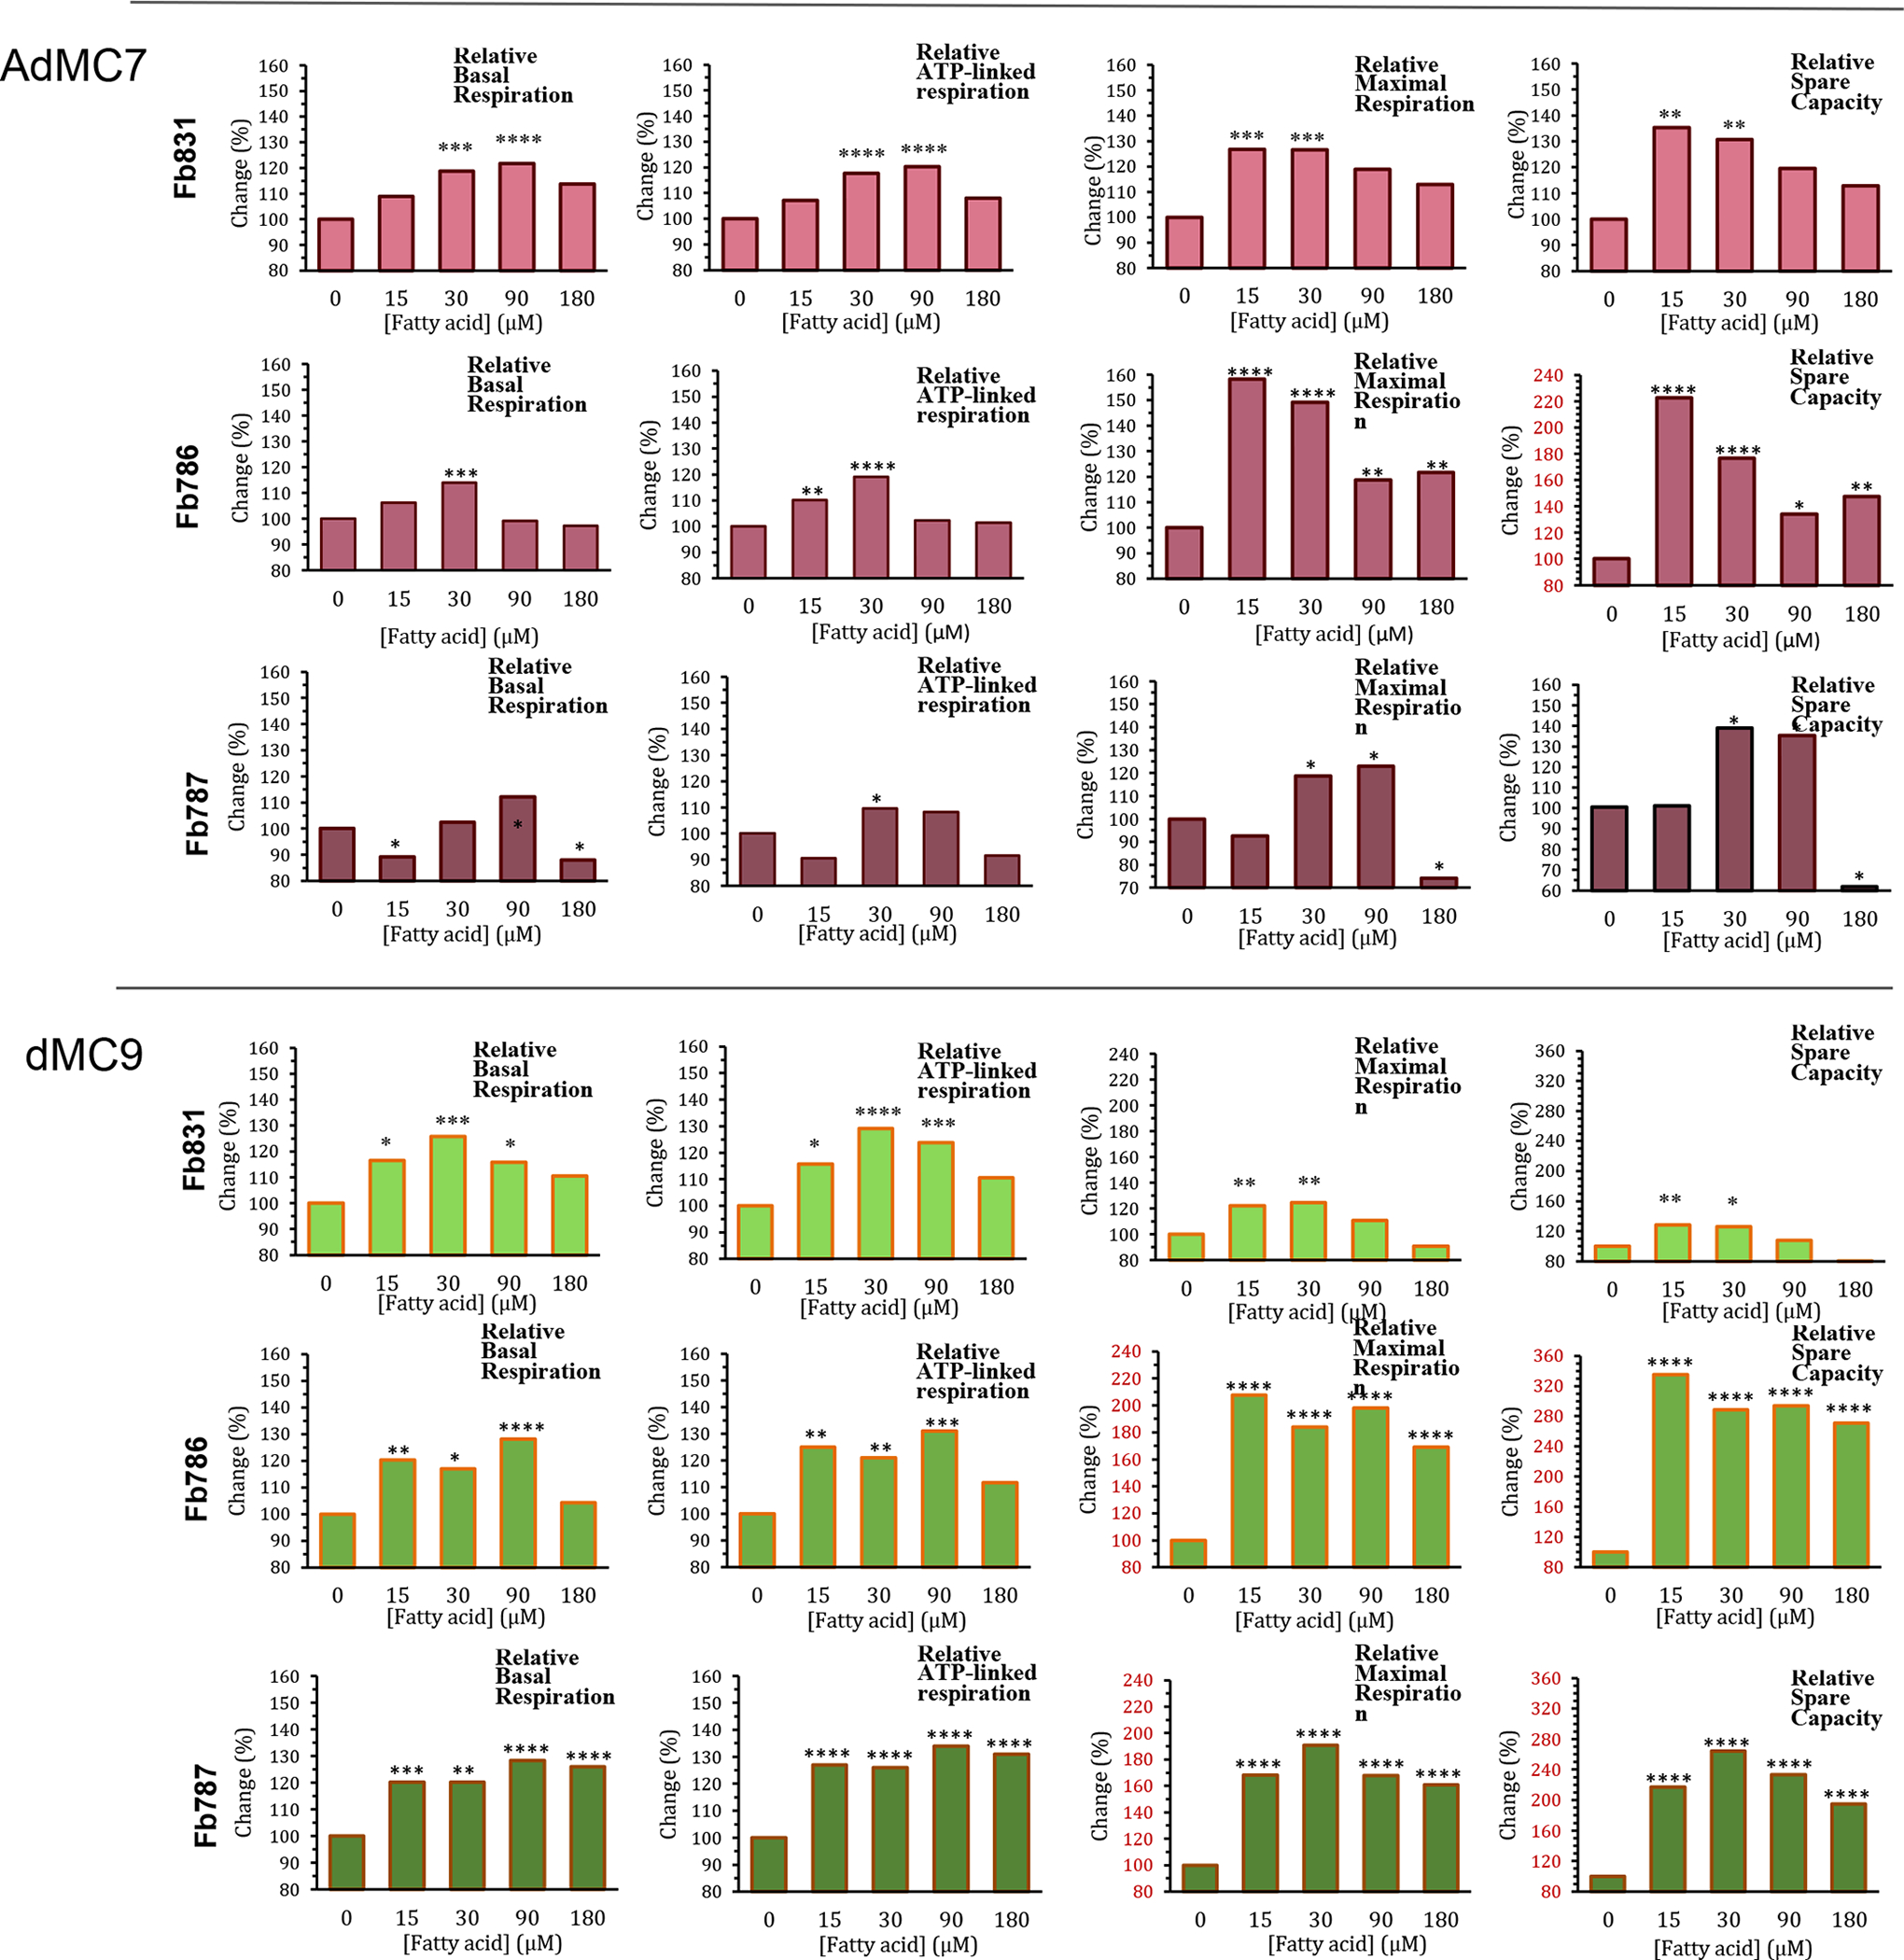
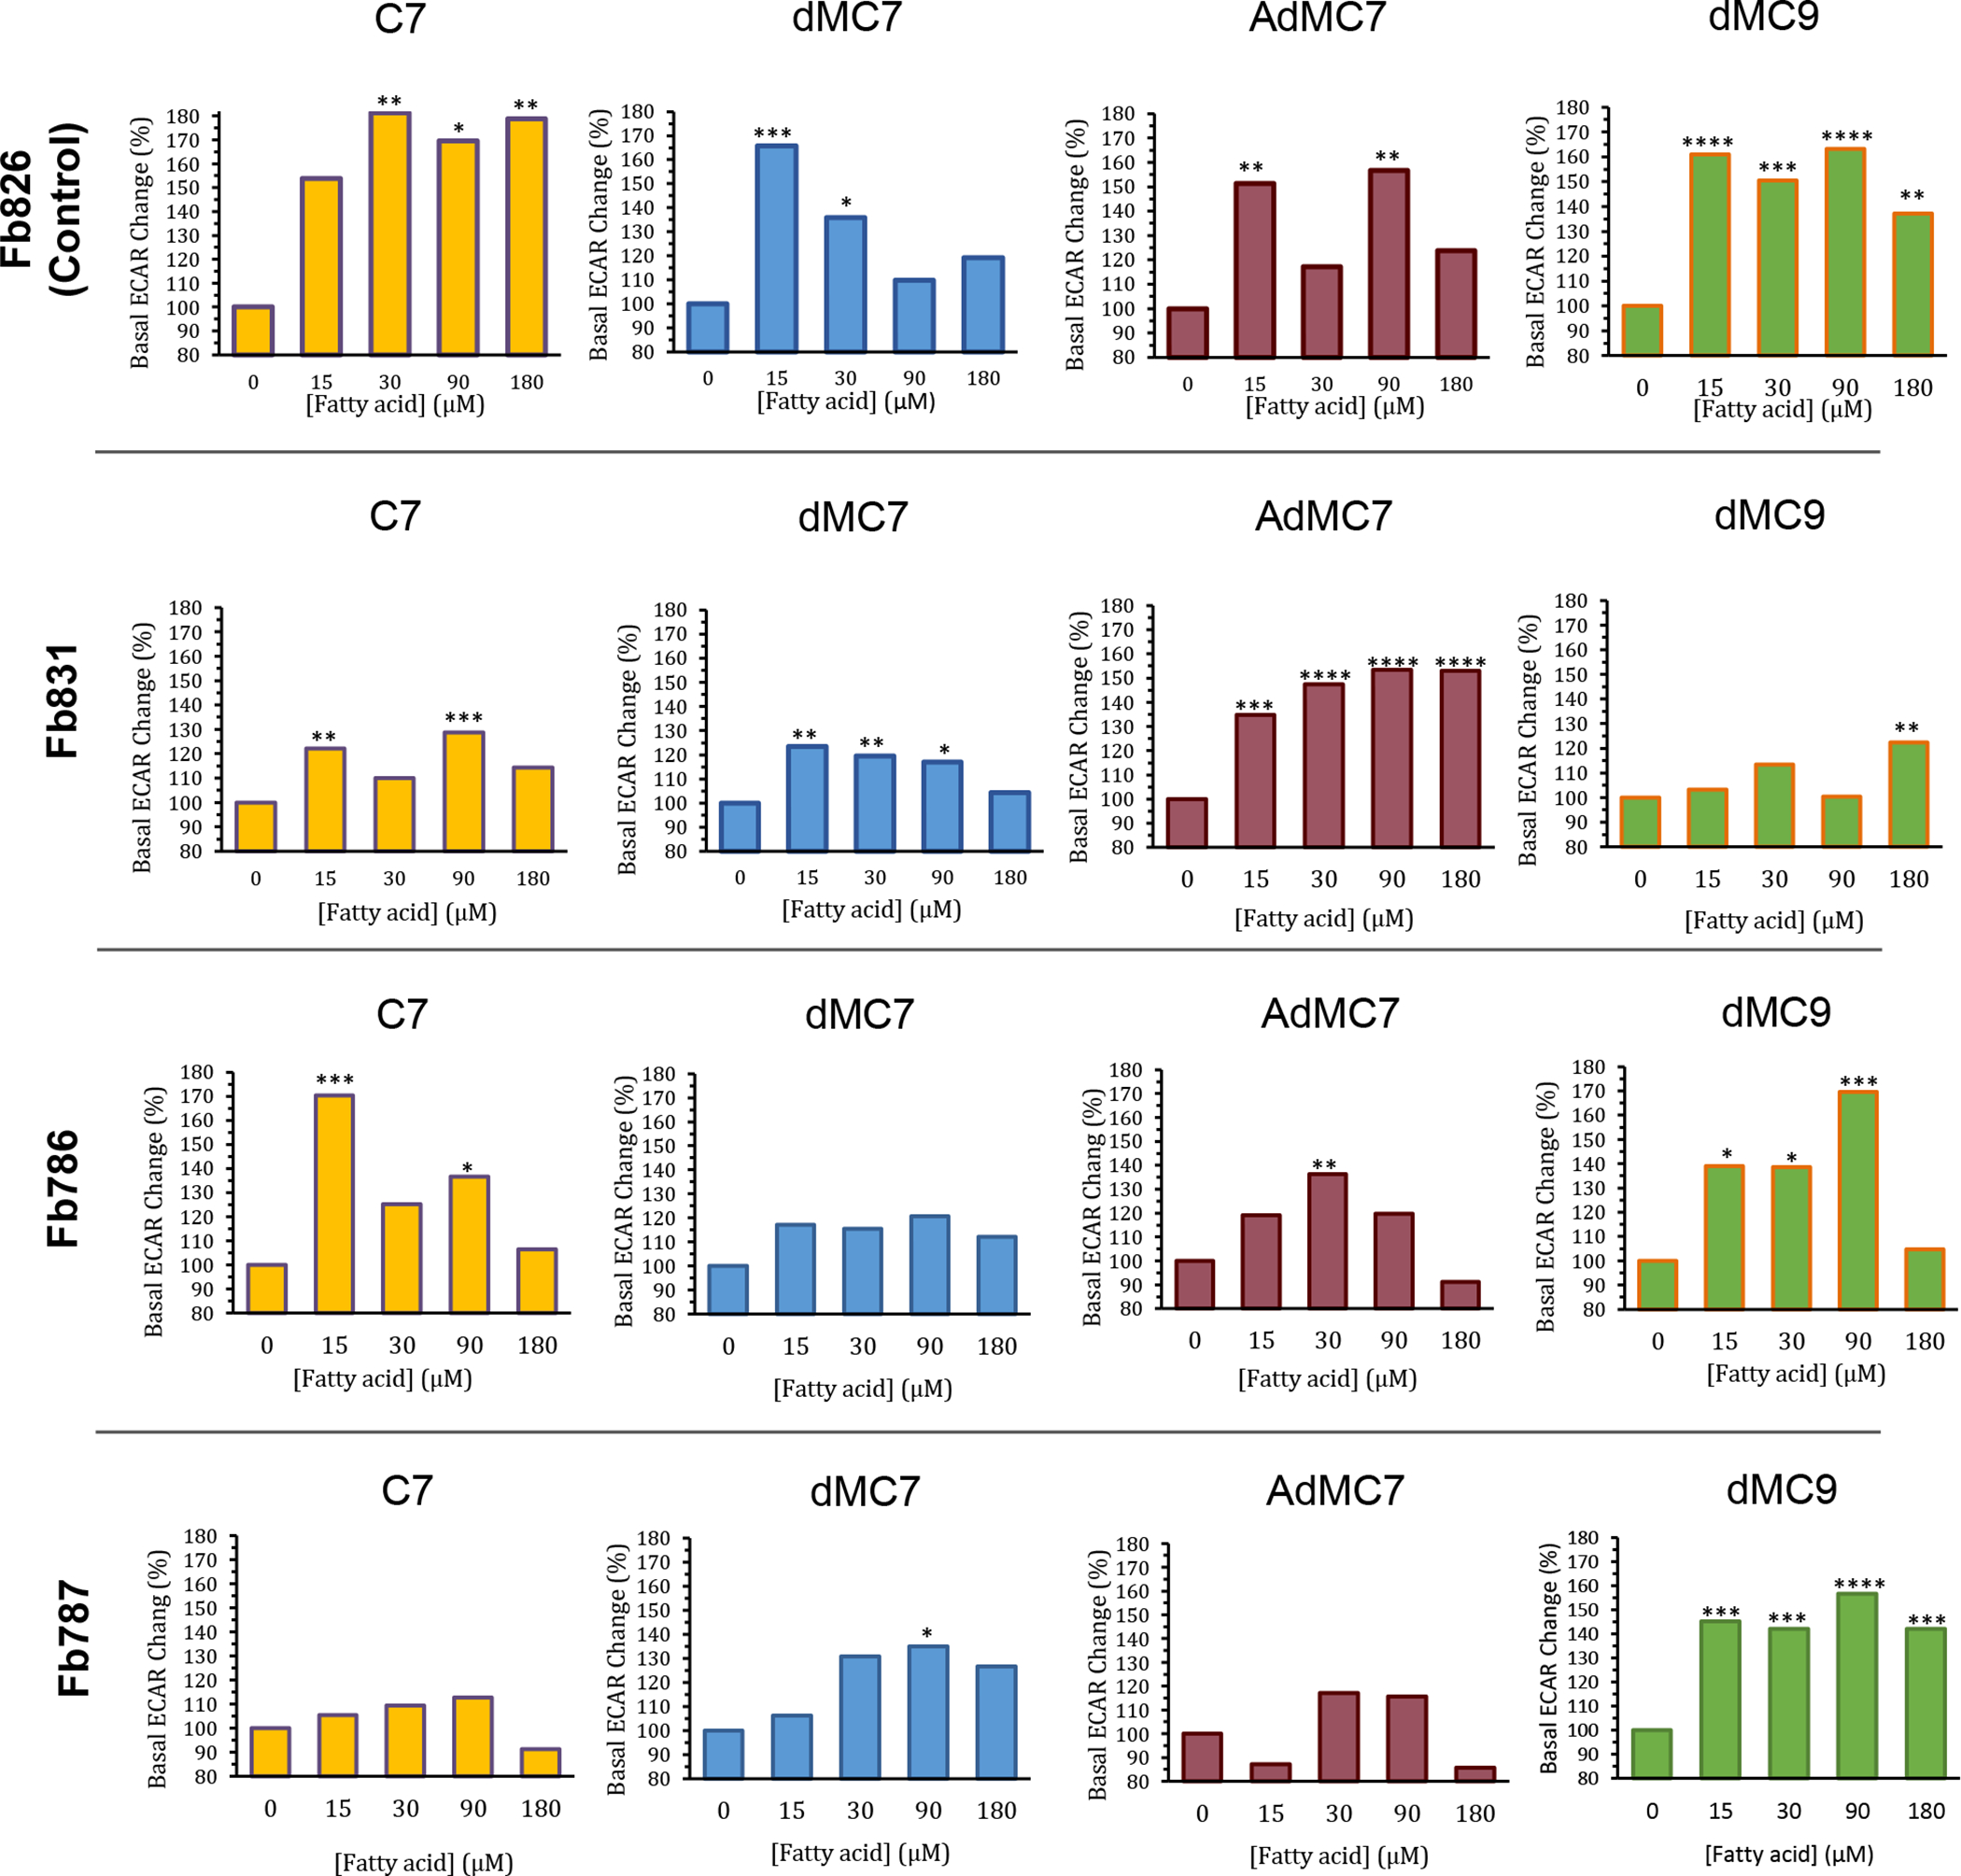
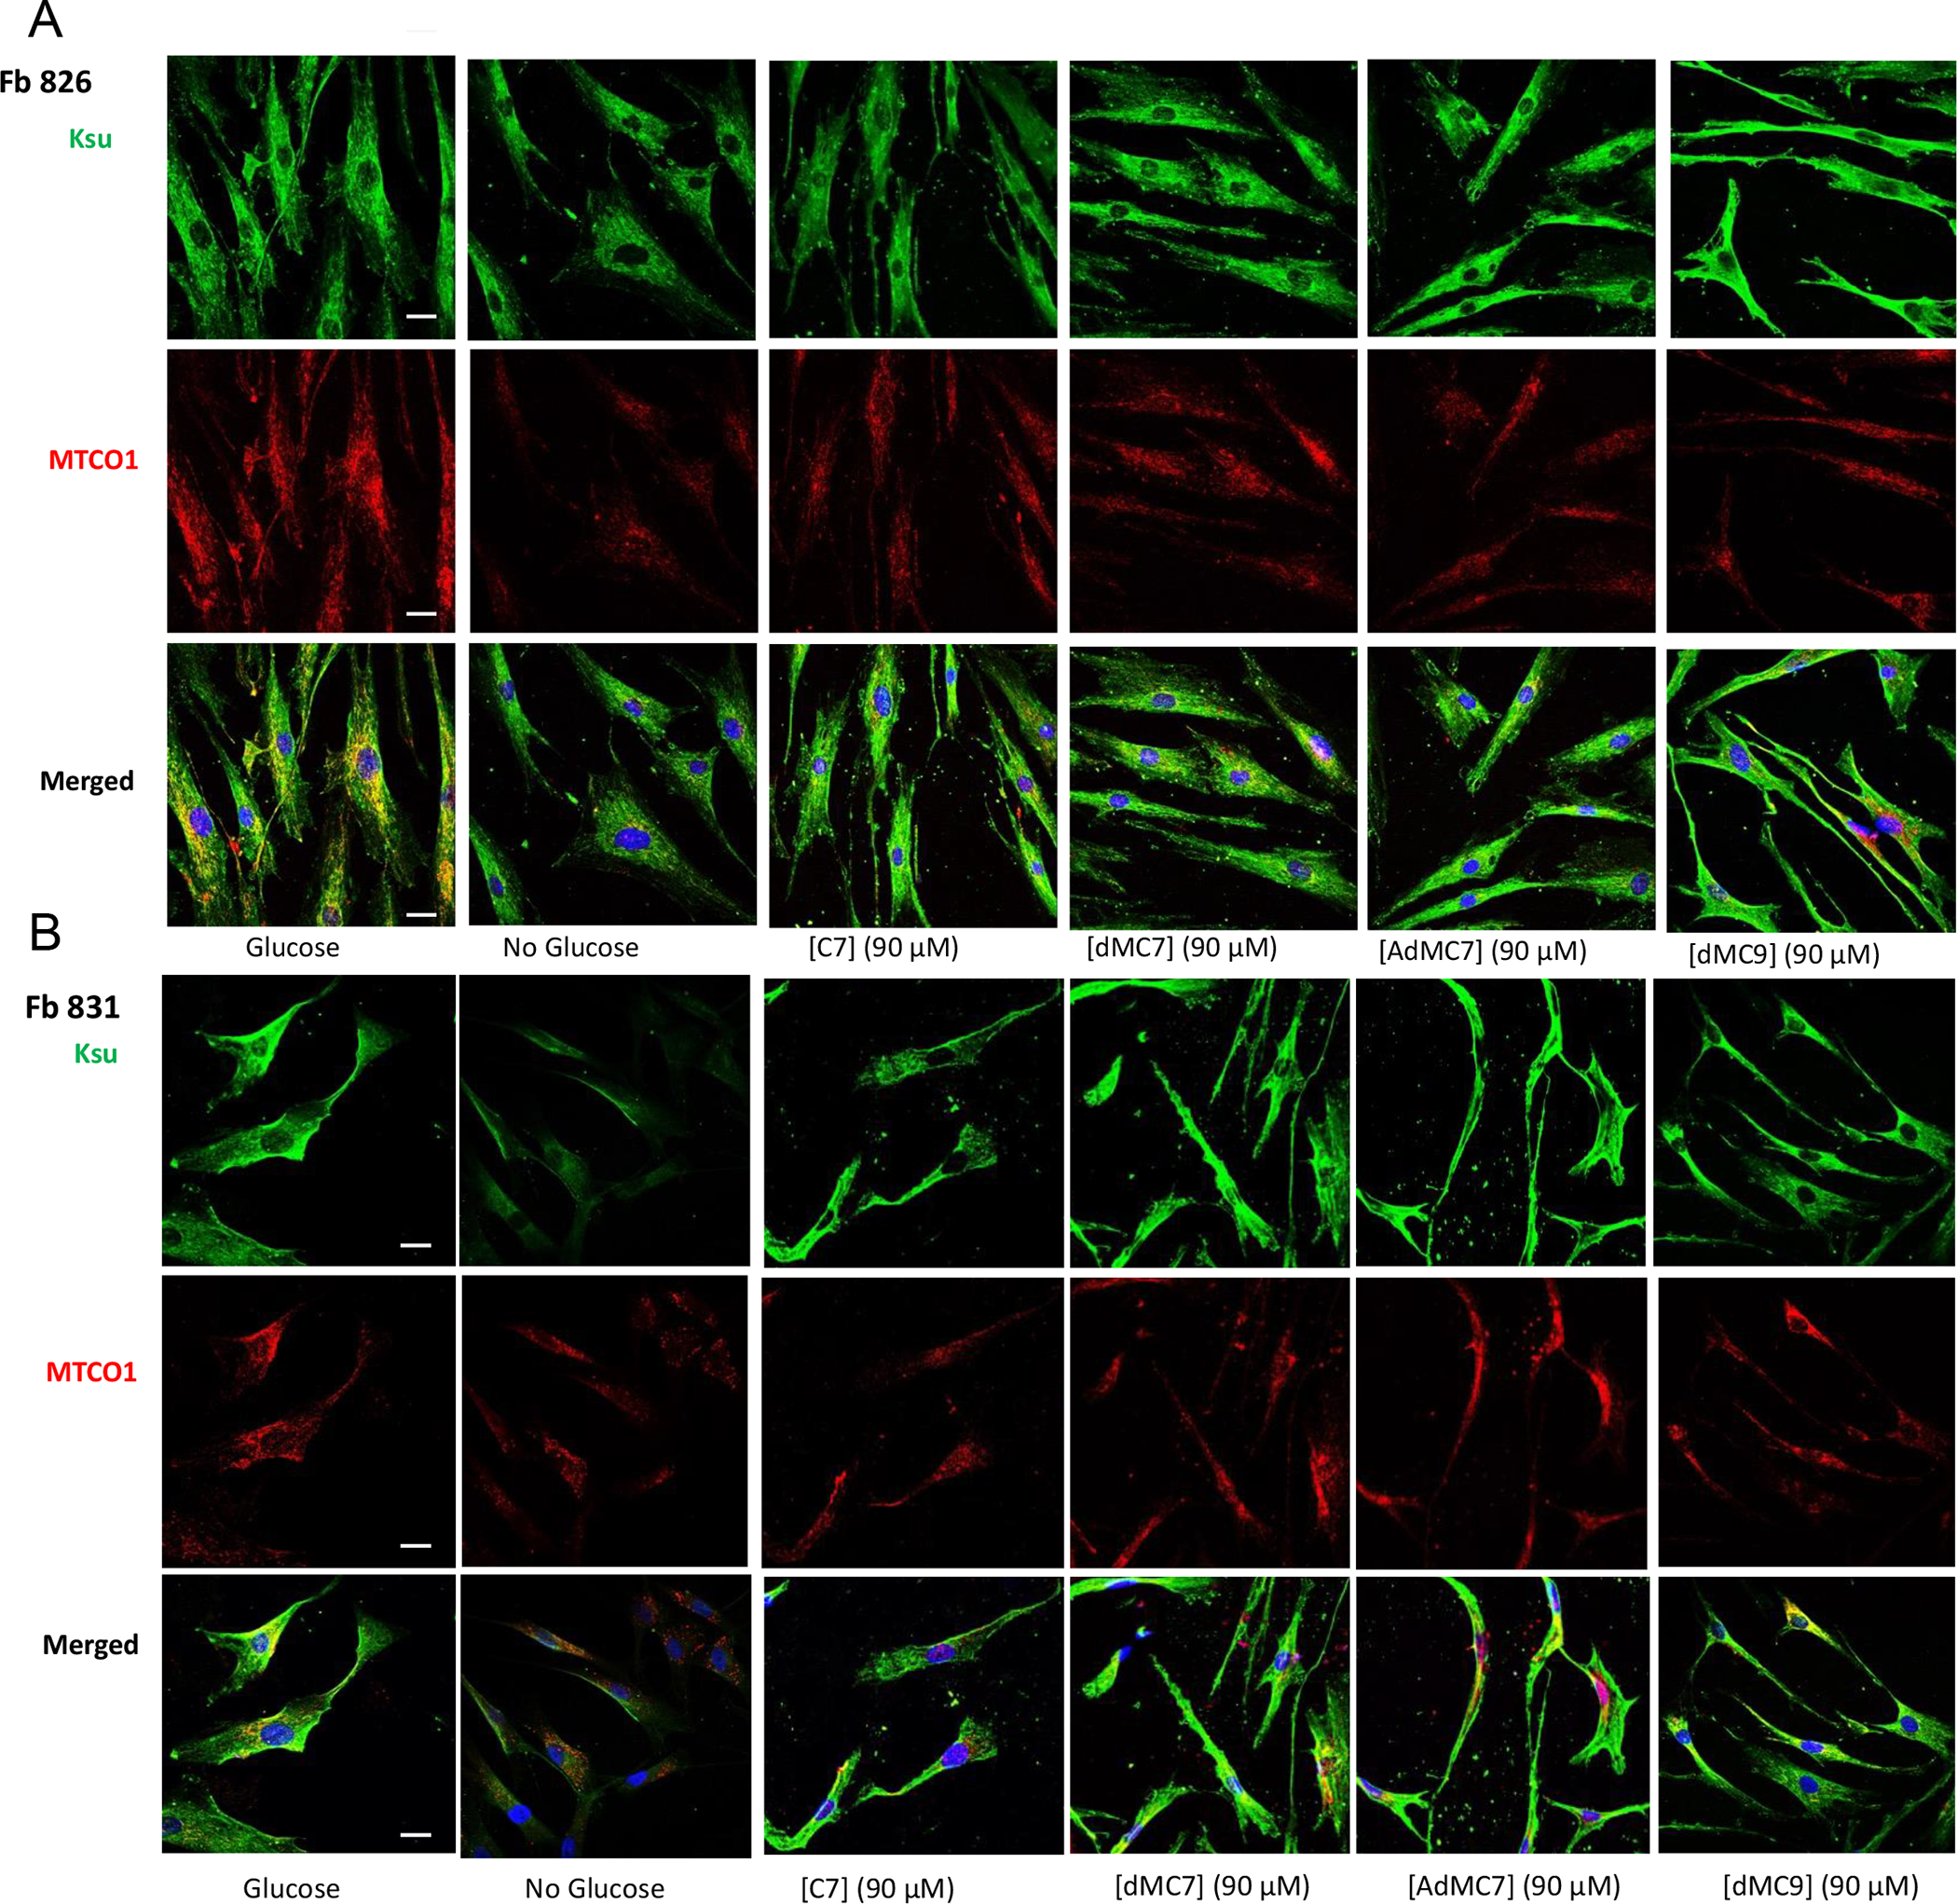
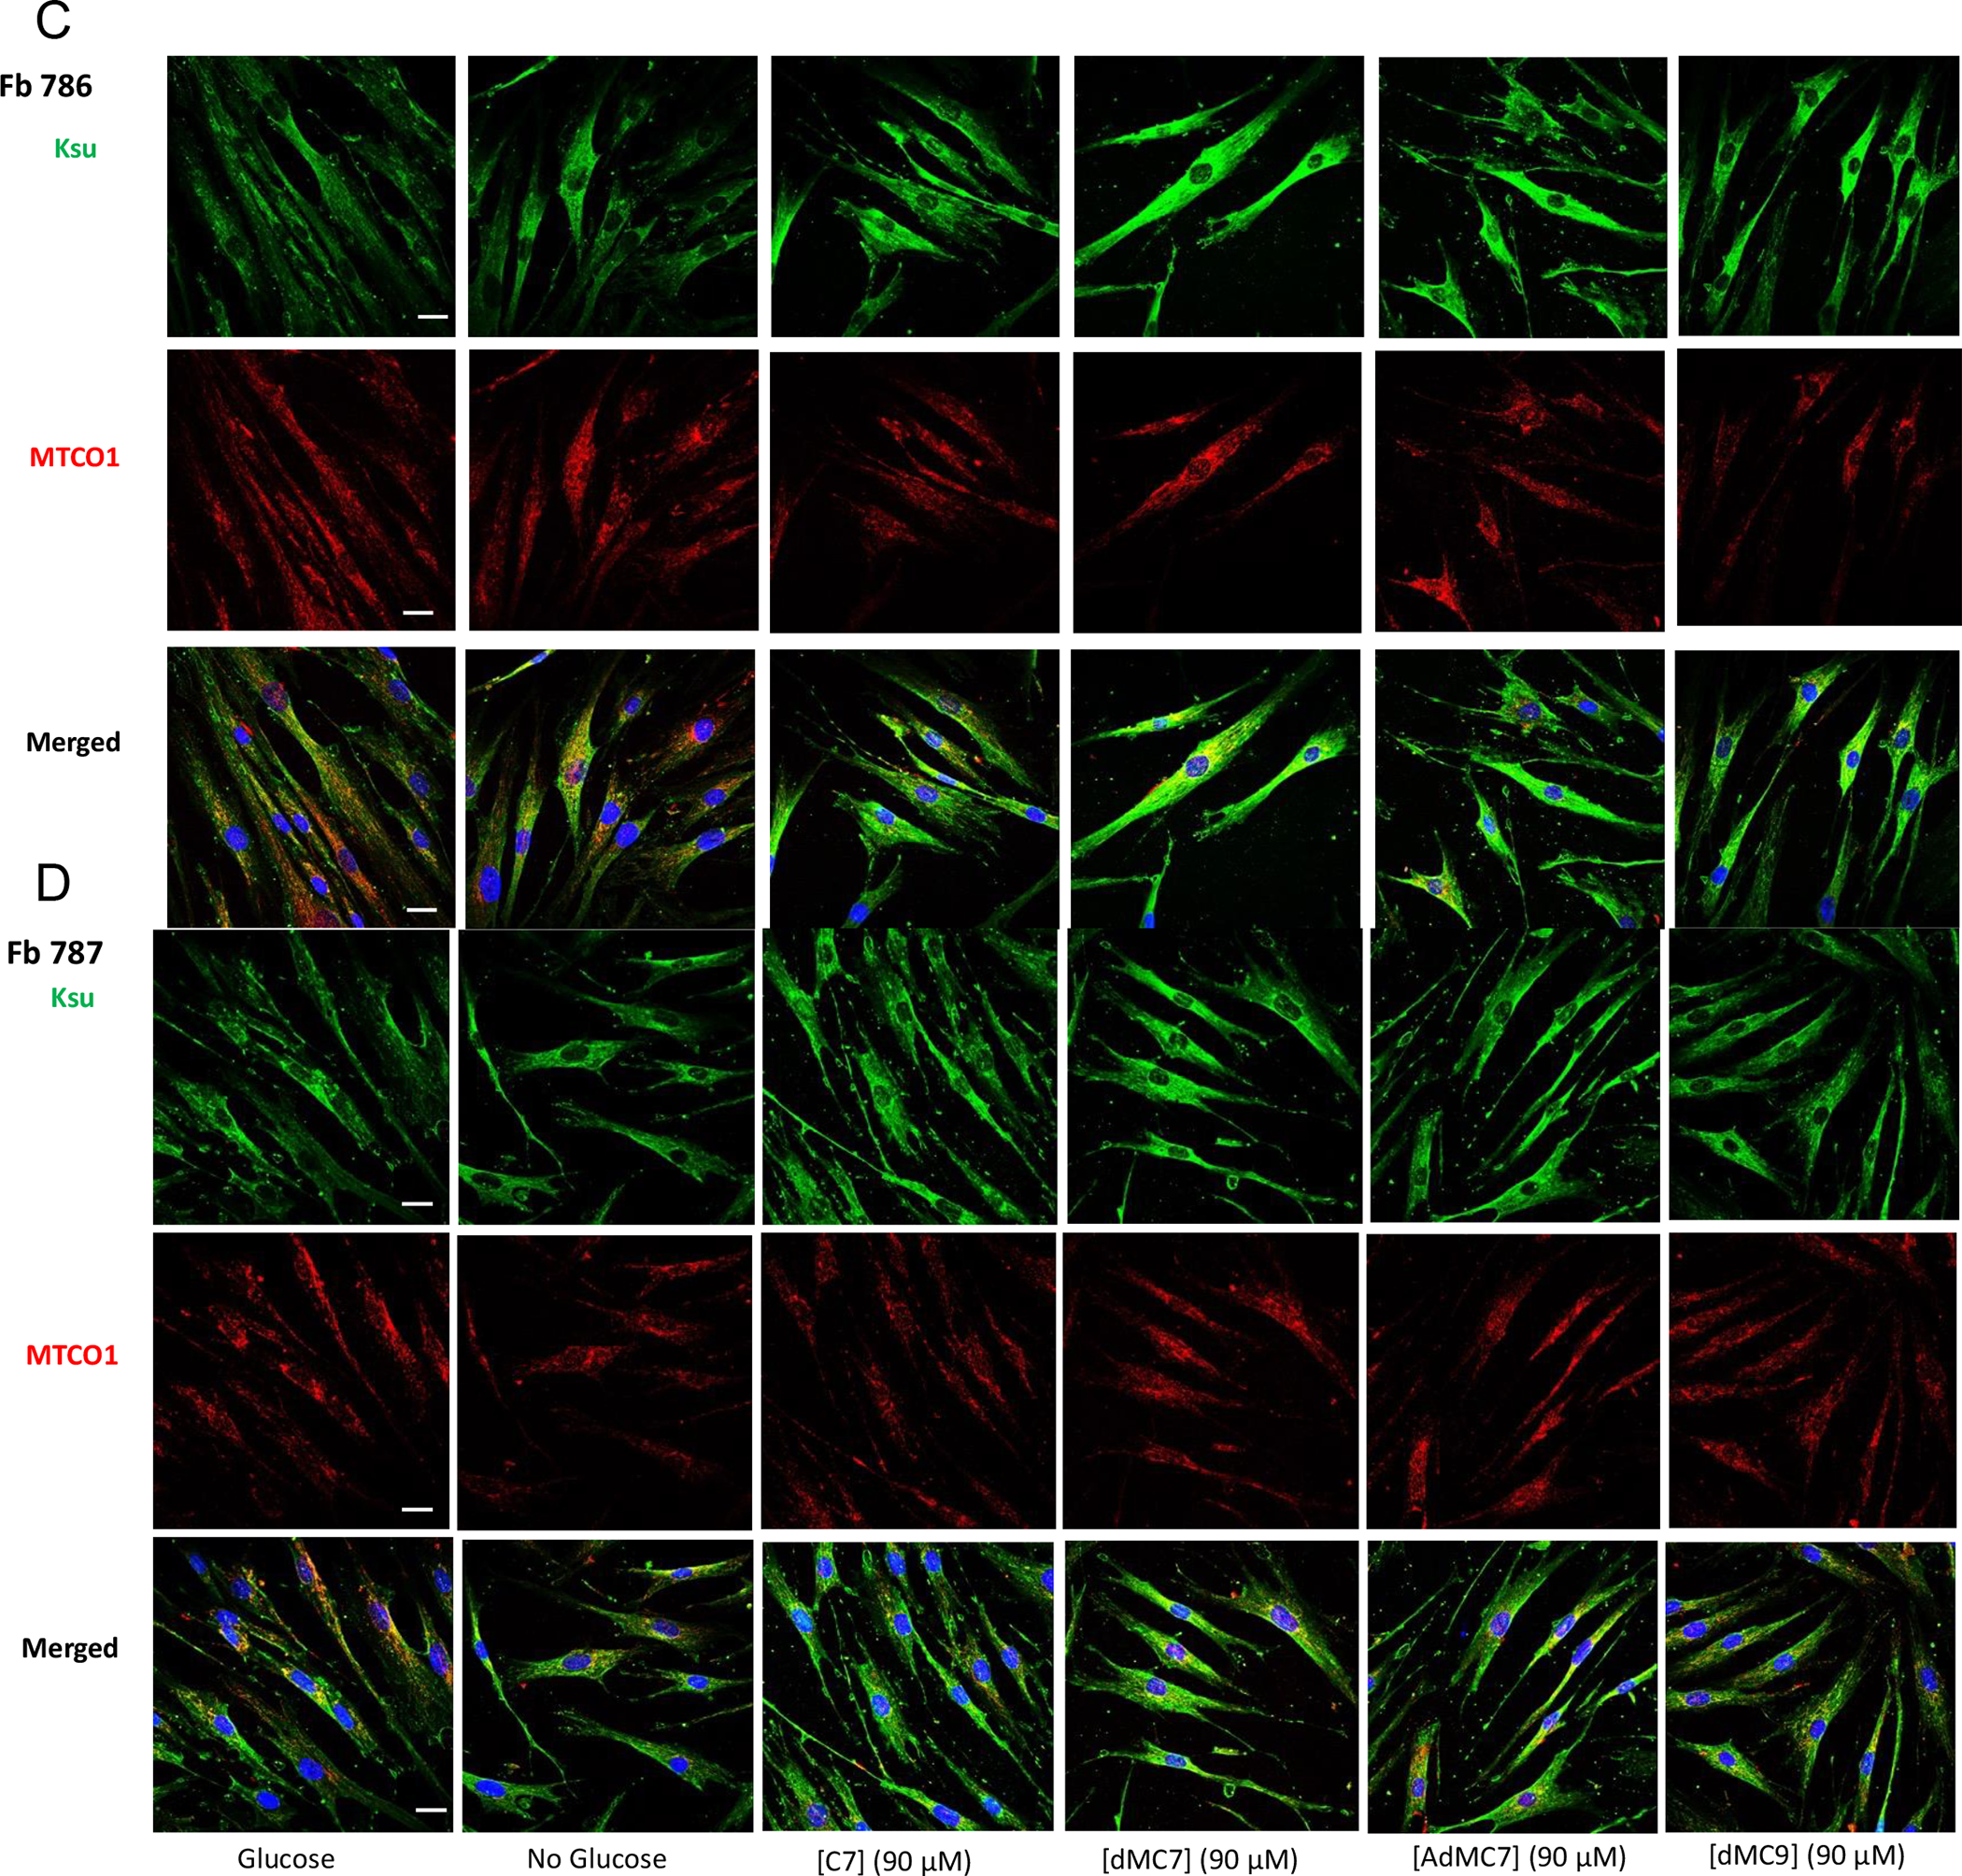
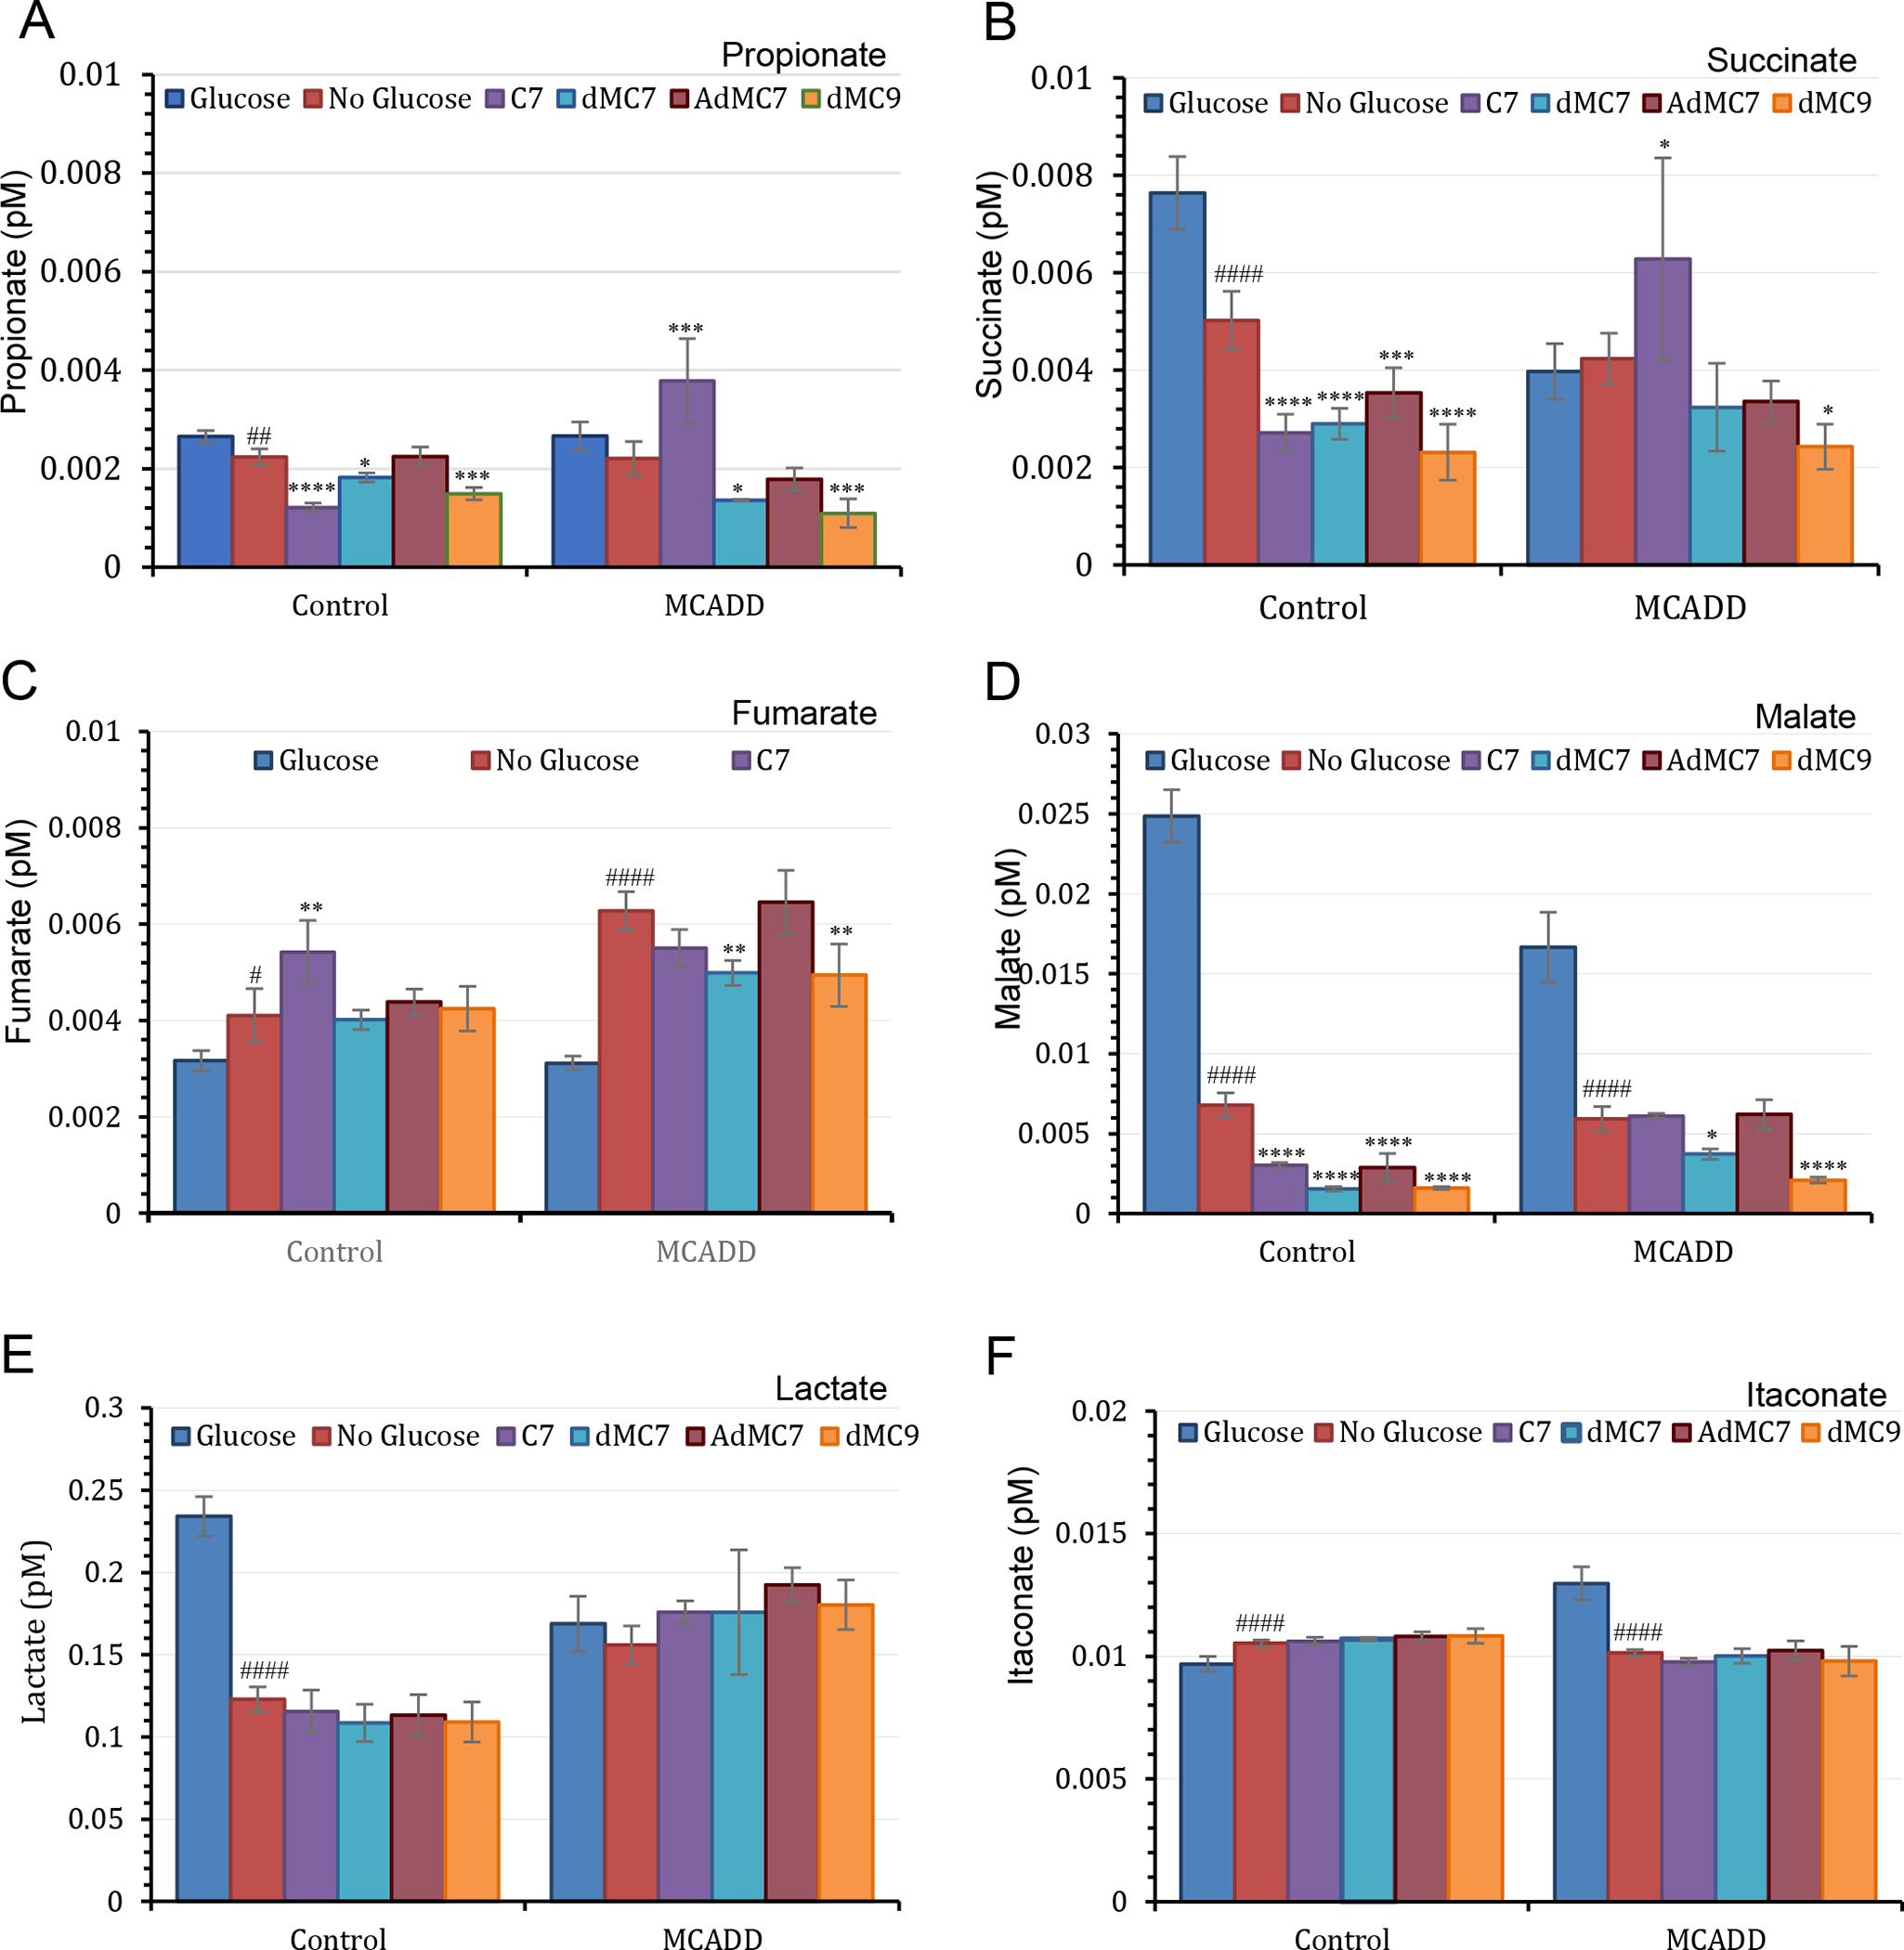
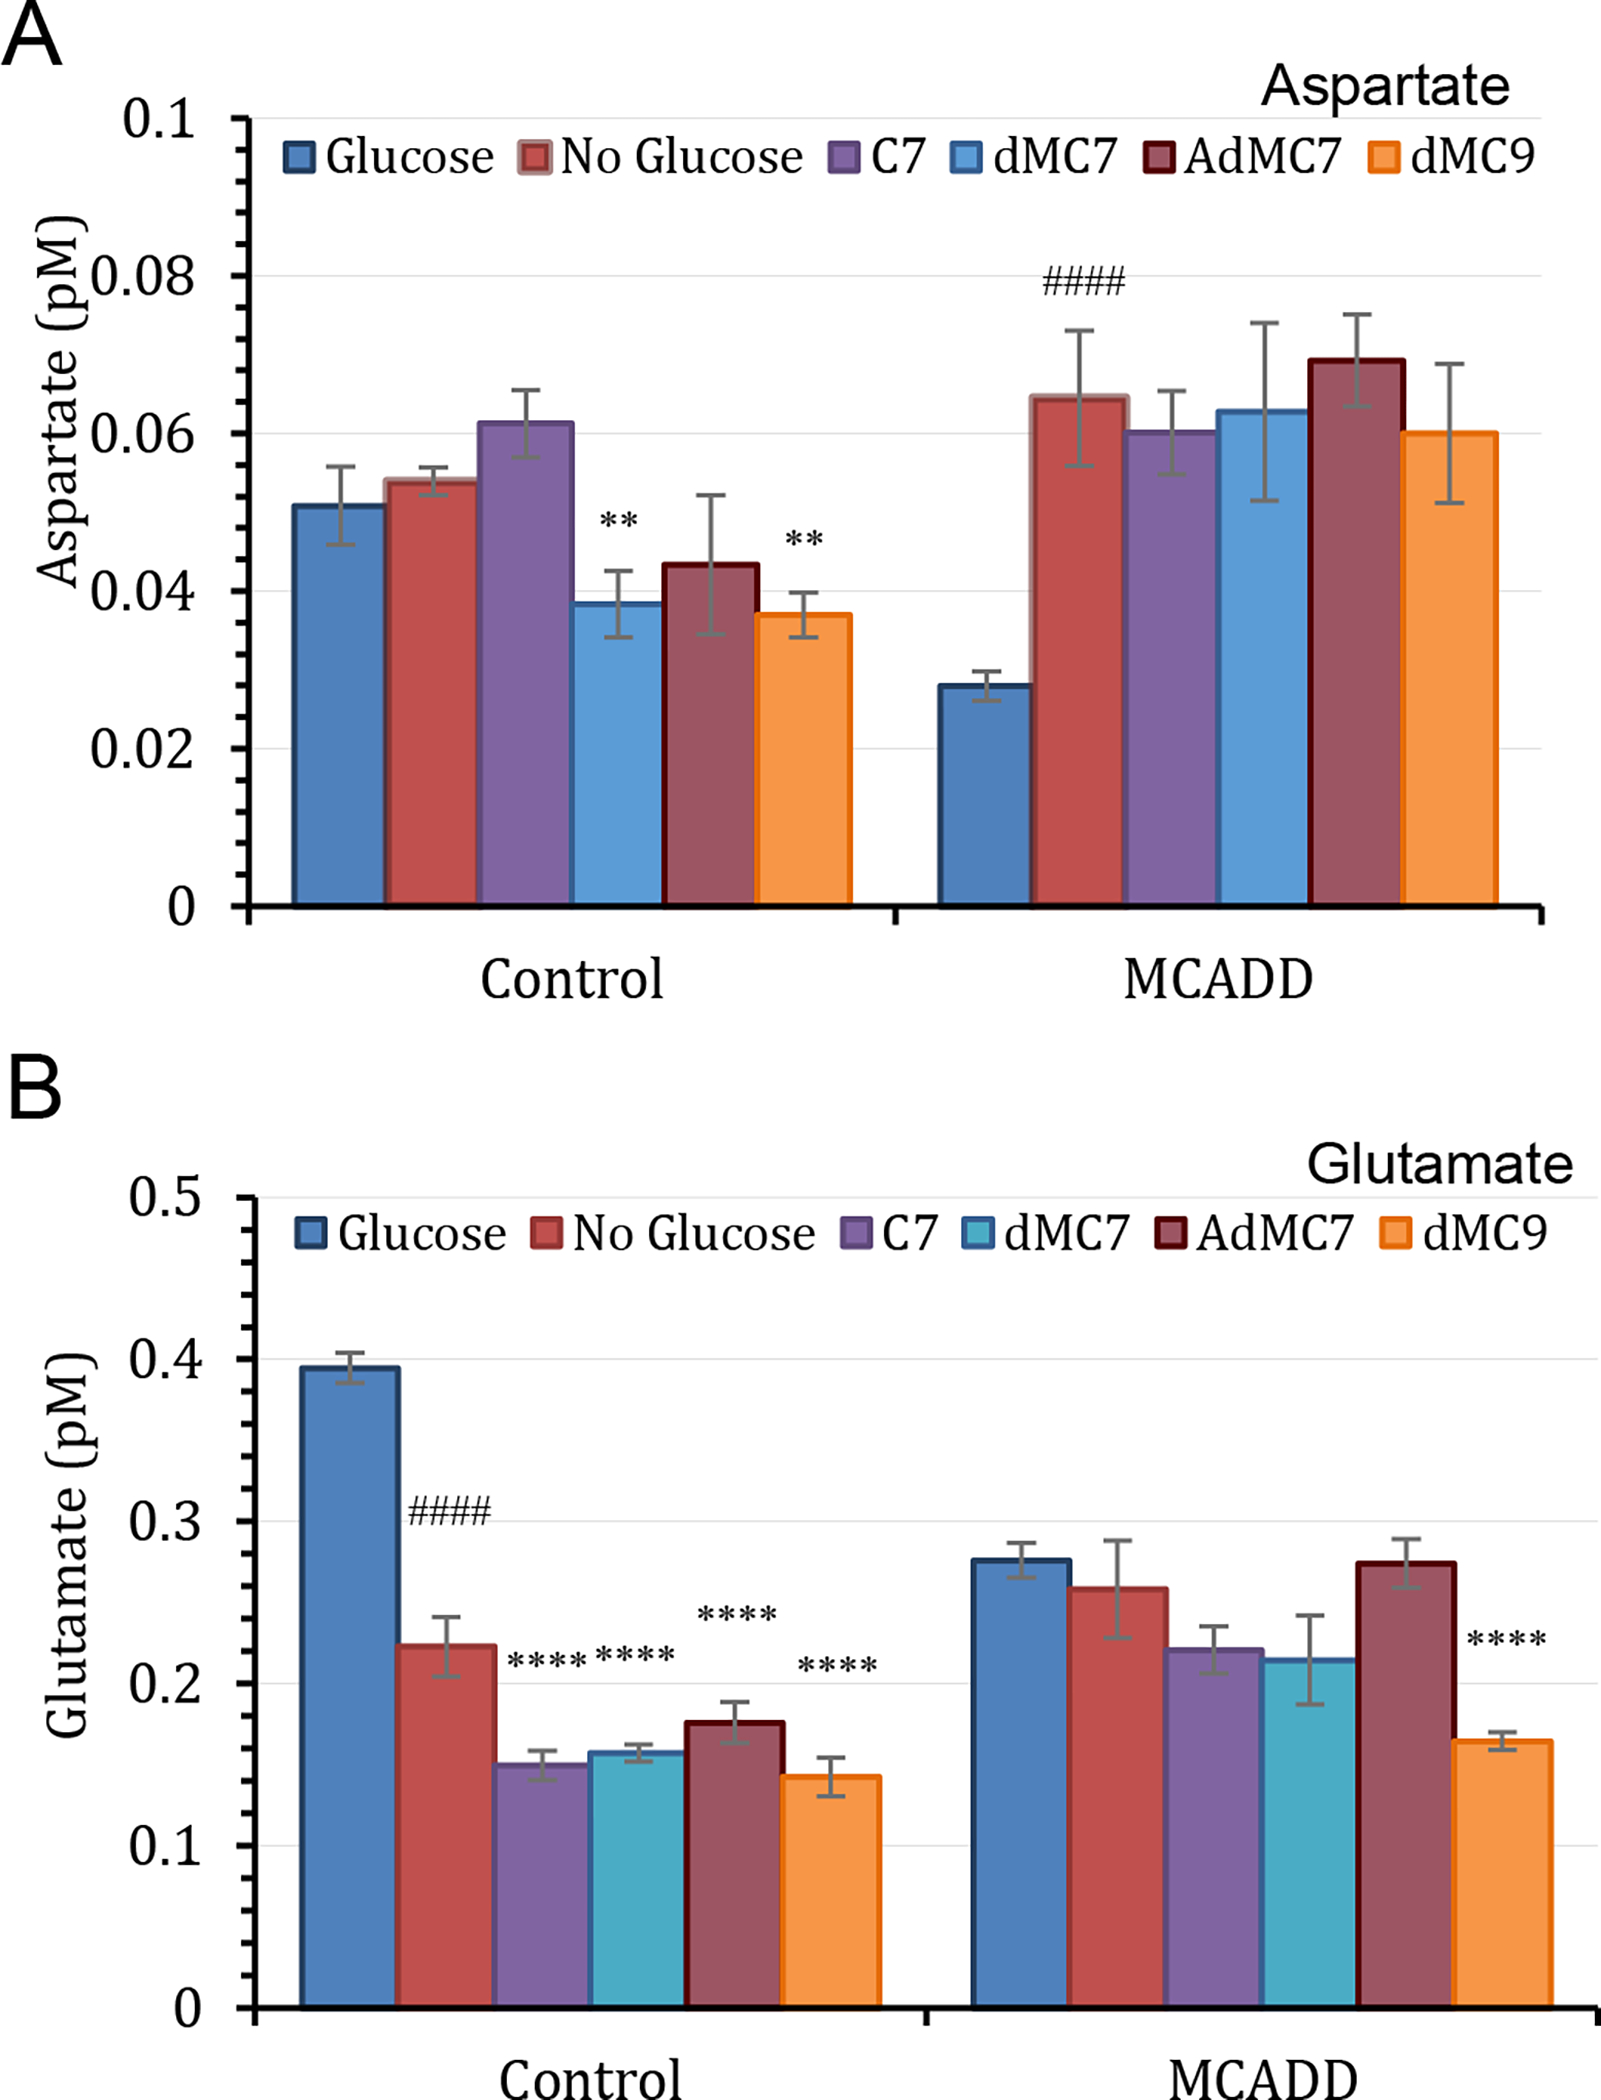
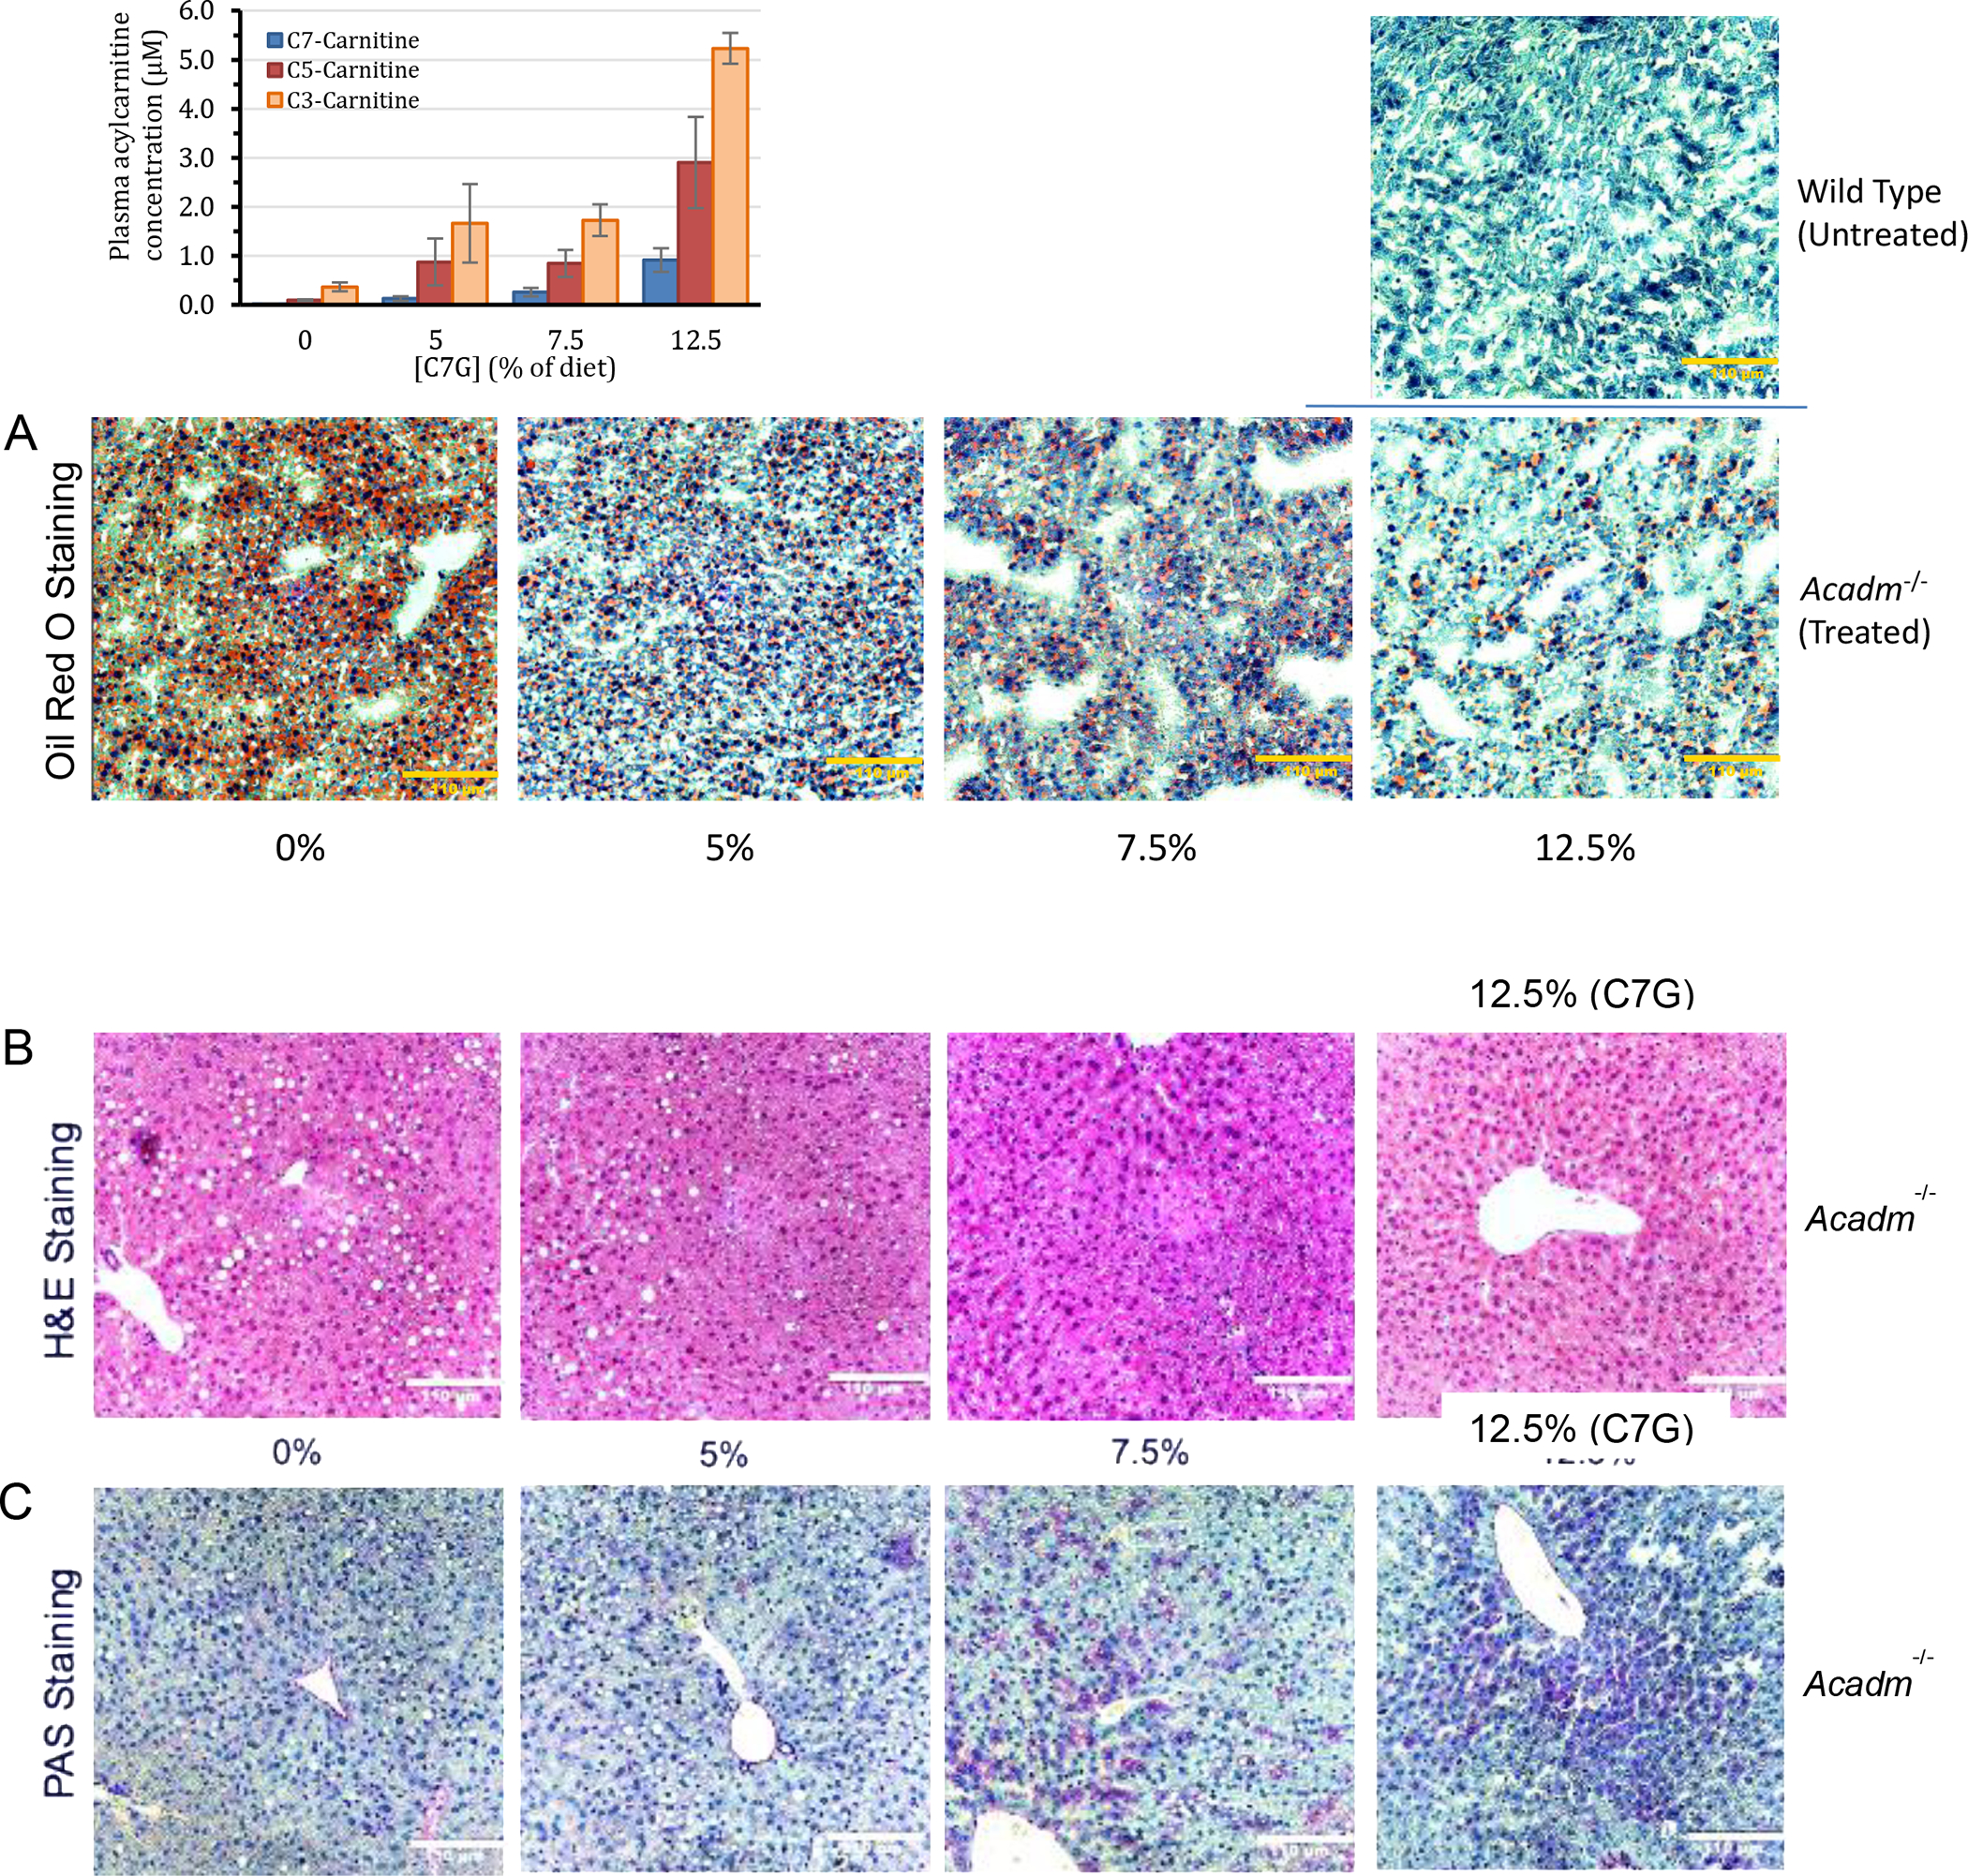
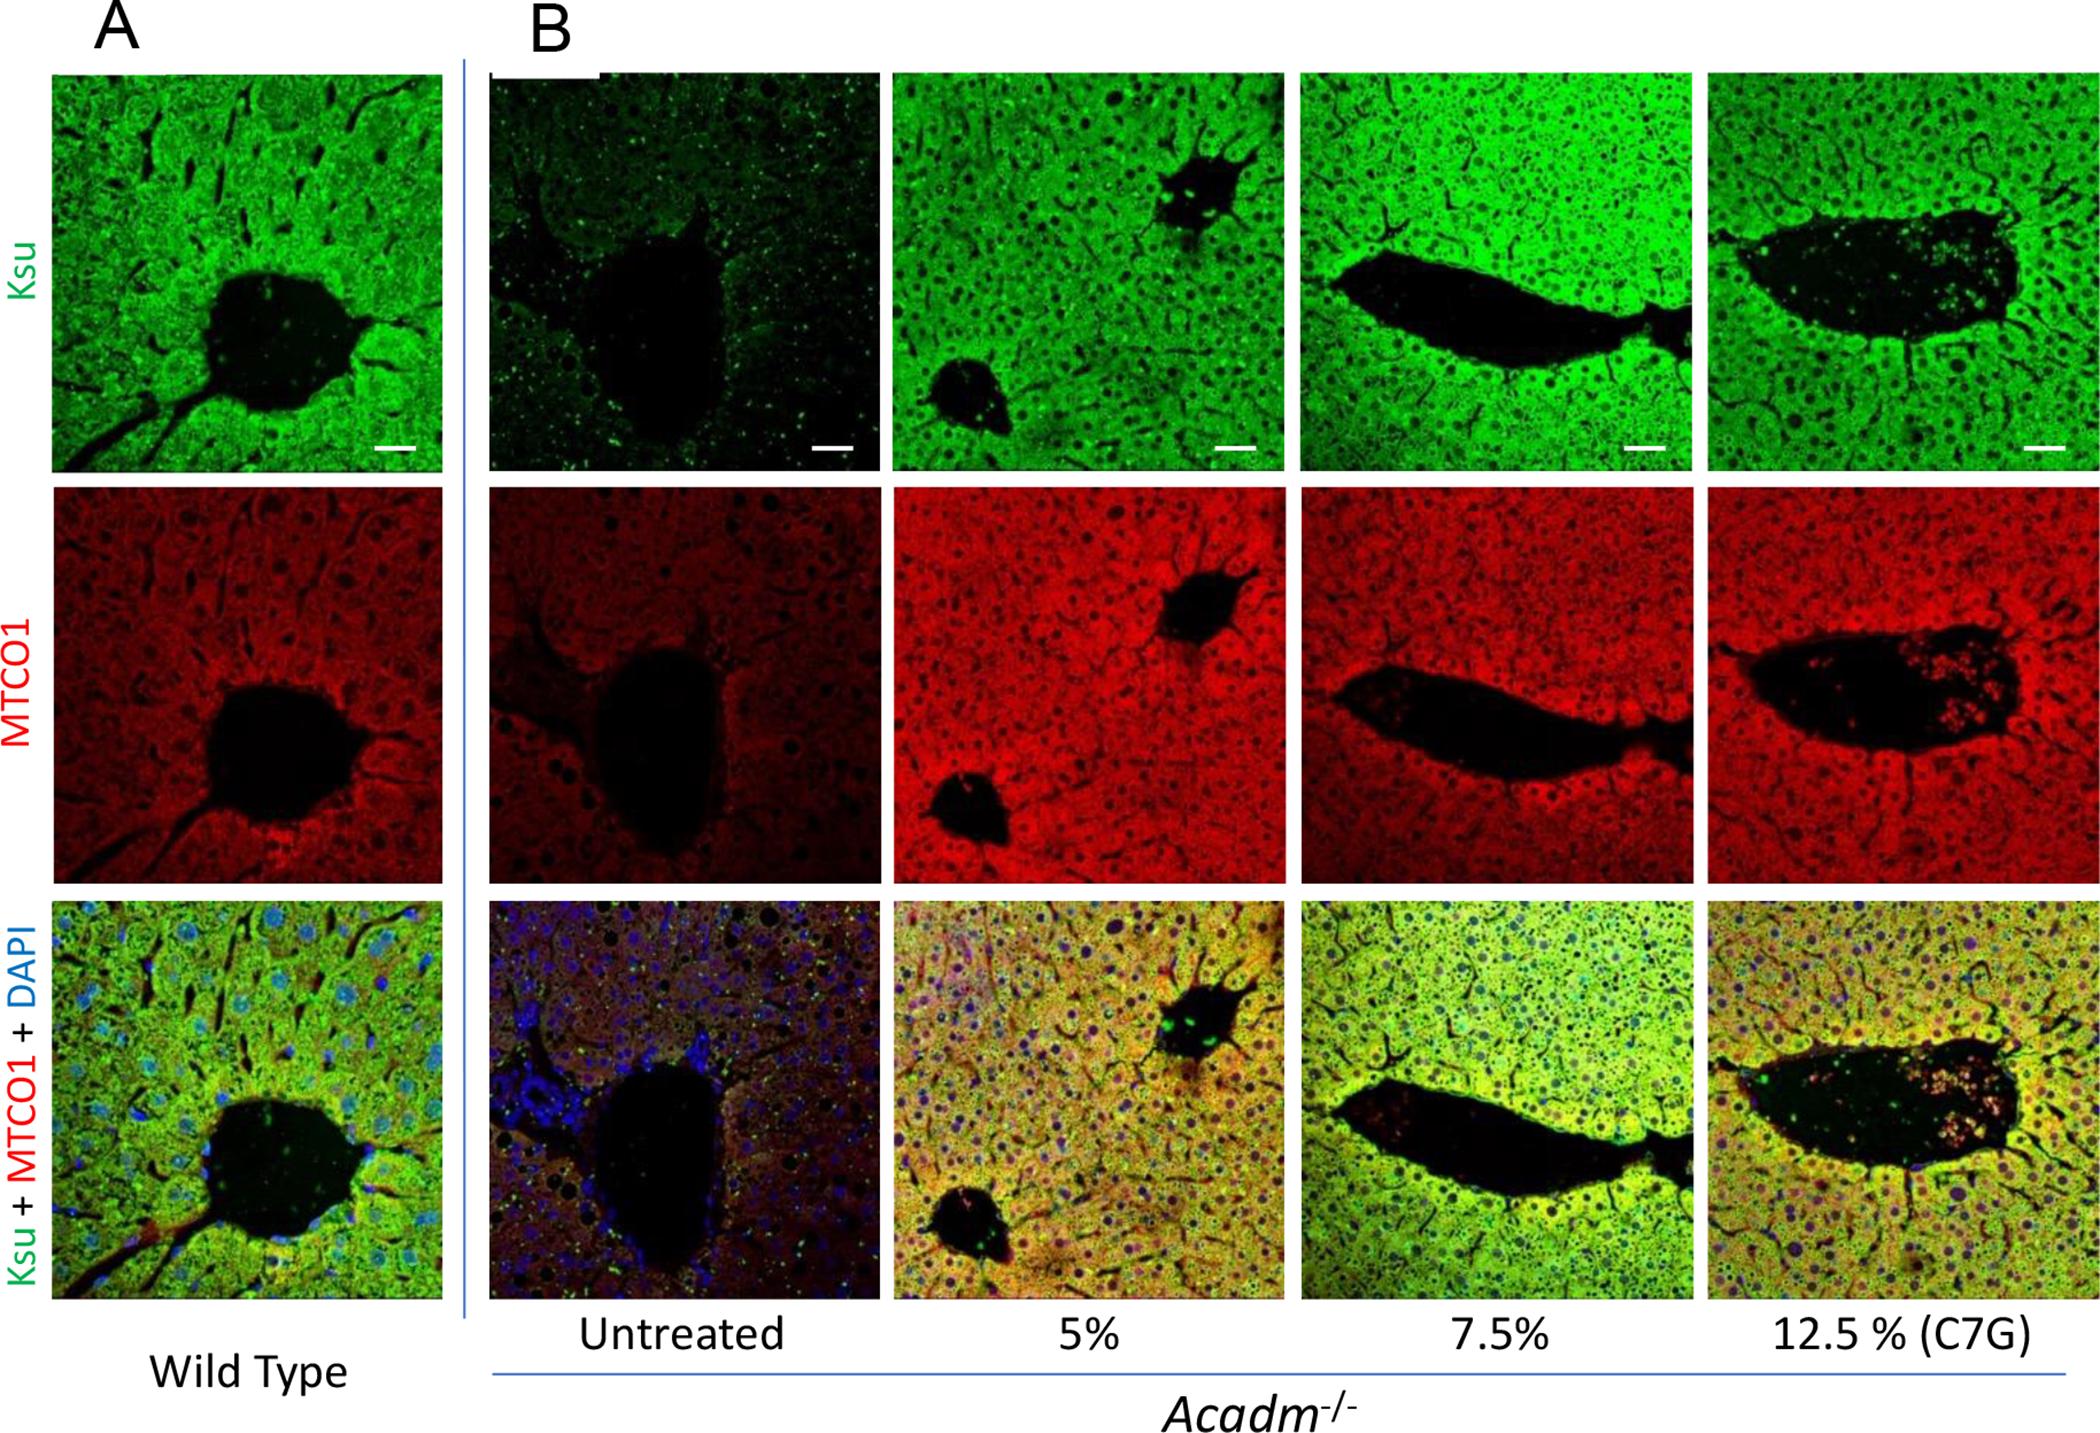
Triheptanoin (triheptanoylglycerol) has shown value as anaplerotic therapy for patients with long chain fatty acid oxidation disorders but is contraindicated in medium-chain acyl-CoA dehydrogenase (MCAD) deficiency. In search for anaplerotic therapy for patients with MCAD deficiency, fibroblasts from three patients homozygous for the most common mutation, ACADMG985A/G985A, were treated with fatty acids hypothesized not to require MCAD for their metabolism, including heptanoic (C7; the active component of triheptanoin), 2,6-dimethylheptanoic (dMC7), 6-amino-2,4-dimethylheptanoic (AdMC7), or 4,8-dimethylnonanoic (dMC9) acids. Their effectiveness as anaplerotic fatty acids was assessed in live cells by monitoring changes in cellular oxygen consumption rate (OCR) and mitochondrial protein lysine succinylation, which reflects cellular succinyl-CoA levels, using immunofluorescence (IF) staining. Krebs cycle intermediates were also quantitated in these cells using targeted metabolomics. The four fatty acids induced positive changes in OCR parameters, consistent with their oxidative catalysis and utilization. Increases in cellular IF staining of succinylated lysines were observed, indicating that the fatty acids were effective sources of succinyl-CoA in the absence of media glucose, pyruvate, and lipids. The ability of MCAD deficient cells to metabolize C7 was confirmed by the ability of extracts to enzymatically utilize C7-CoA as substrate but not C8-CoA. To evaluate C7 therapeutic potential in vivo, Acadm-/- mice were treated with triheptanoin for seven days. Dose dependent increase in plasma levels of heptanoyl-, valeryl-, and propionylcarnitine indicated efficient metabolism of the medication. The pattern of the acylcarnitine profile paralleled resolution of liver pathology including reversing hepatic steatosis, increasing hepatic glycogen content, and increasing hepatocyte protein succinylation, all indicating improved energy homeostasis in the treated mice. These results provide the impetus to evaluate triheptanoin and the medium branched chain fatty acids as potential therapeutic agents for patients with MCAD deficiency.
Keywords: ACADs, acyl-CoA dehydrogenases; Anaplerosis; Dojolvi(TM); Fatty acid oxidation disorders; Heptanoic acid; Lysine succinylation; MCAD deficiency; Medium branched-chain fatty acids; Triheptanoin.
Copyright © 2023 Elsevier Inc. All rights reserved.
Conflict of interest statement
Declaration of Competing Interest Al-Walid Mohsen, the corresponding author, has a patent application, US 2021/0322357 A1, submitted to the US patent office pertaining compounds mentioned in this manuscript. Anuradha Karunanidhi, Shakuntala Basu, Xue-Jun Zhao, Olivia D'Annibale, Clinton Van't Land, Jerry Vockley, all have no conflict of interest.
Figures
Similar articles
-
Medium branched chain fatty acids improve the profile of tricarboxylic acid cycle intermediates in mitochondrial fatty acid β-oxidation deficient cells: A comparative study.J Inherit Metab Dis. 2022 May;45(3):541-556. doi: 10.1002/jimd.12480. Epub 2022 Feb 2. J Inherit Metab Dis. 2022. PMID: 35076099 Free PMC article.
-
Triheptanoin: long-term effects in the very long-chain acyl-CoA dehydrogenase-deficient mouse.J Lipid Res. 2017 Jan;58(1):196-207. doi: 10.1194/jlr.M072033. Epub 2016 Nov 24. J Lipid Res. 2017. PMID: 27884962 Free PMC article.
-
Cardiac tissue citric acid cycle intermediates in exercised very long-chain acyl-CoA dehydrogenase-deficient mice fed triheptanoin or medium-chain triglyceride.J Inherit Metab Dis. 2020 Nov;43(6):1232-1242. doi: 10.1002/jimd.12284. Epub 2020 Aug 4. J Inherit Metab Dis. 2020. PMID: 33448436
-
Mutation analysis in mitochondrial fatty acid oxidation defects: Exemplified by acyl-CoA dehydrogenase deficiencies, with special focus on genotype-phenotype relationship.Hum Mutat. 2001 Sep;18(3):169-89. doi: 10.1002/humu.1174. Hum Mutat. 2001. PMID: 11524729 Review.
-
Medium-chain acyl-CoA dehydrogenase deficiency: molecular aspects.Eur J Pediatr. 1992 Mar;151(3):154-9. doi: 10.1007/BF01954373. Eur J Pediatr. 1992. PMID: 1601002 Review.
Cited by
-
Emerging roles of mitochondrial sirtuin SIRT5 in succinylation modification and cancer development.Front Immunol. 2025 Jan 29;16:1531246. doi: 10.3389/fimmu.2025.1531246. eCollection 2025. Front Immunol. 2025. PMID: 39944690 Free PMC article. Review.
-
Protein succinylation: regulating metabolism and beyond.Front Nutr. 2024 Feb 6;11:1336057. doi: 10.3389/fnut.2024.1336057. eCollection 2024. Front Nutr. 2024. PMID: 38379549 Free PMC article. Review.
-
iPSC-Derived Liver Organoids as a Tool to Study Medium Chain Acyl-CoA Dehydrogenase Deficiency.J Inherit Metab Dis. 2025 May;48(3):e70028. doi: 10.1002/jimd.70028. J Inherit Metab Dis. 2025. PMID: 40199742 Free PMC article.
References
-
- Calvert S, Barwick K, Par M, Ni Tan K, Borges K, A pilot study of add-on oral triheptanoin treatment for children with medically refractory epilepsy. Eur J Paediatr Neurol 22, 1074–1080 (2018). - PubMed
-
- Gillingham MB, Heitner SB, Martin J, Rose S, Goldstein A, El-Gharbawy AH, Deward S, Lasarev MR, Pollaro J, DeLany JP, Burchill LJ, Goodpaster B, Shoemaker J, Matern D, Harding CO, Vockley J, Triheptanoin versus trioctanoin for long-chain fatty acid oxidation disorders: a double blinded, randomized controlled trial. J Inherit Metab Dis 40, 831–843 (2017). - PMC - PubMed
-
- Hainque E, Caillet S, Leroy S, Flamand-Roze C, Adanyeguh I, Charbonnier-Beaupel F, Retail M, Le Toullec B, Atencio M, Rivaud-Pechoux S, Brochard V, Habarou F, Ottolenghi C, Cormier F, Meneret A, Ruiz M, Doulazmi M, Roubergue A, Corvol JC, Vidailhet M, Mochel F, Roze E, A randomized, controlled, double-blind, crossover trial of triheptanoin in alternating hemiplegia of childhood. Orphanet J Rare Dis 12, 160 (2017). - PMC - PubMed
Publication types
MeSH terms
Substances
Supplementary concepts
Grants and funding
LinkOut - more resources
Full Text Sources
Medical
Molecular Biology Databases
Miscellaneous
