Randomized Controlled Trial
. 2023 Oct:255:109750.
doi: 10.1016/j.clim.2023.109750. Epub 2023 Sep 3.

Systems analysis reveals differential expression of endocervical genes in African women randomized to DMPA-IM, LNG implant or cu-IUD

Affiliations
Randomized Controlled Trial

Systems analysis reveals differential expression of endocervical genes in African women randomized to DMPA-IM, LNG implant or cu-IUD

Prachi Mehrotra Gupta et al. Clin Immunol. 2023 Oct.

Abstract

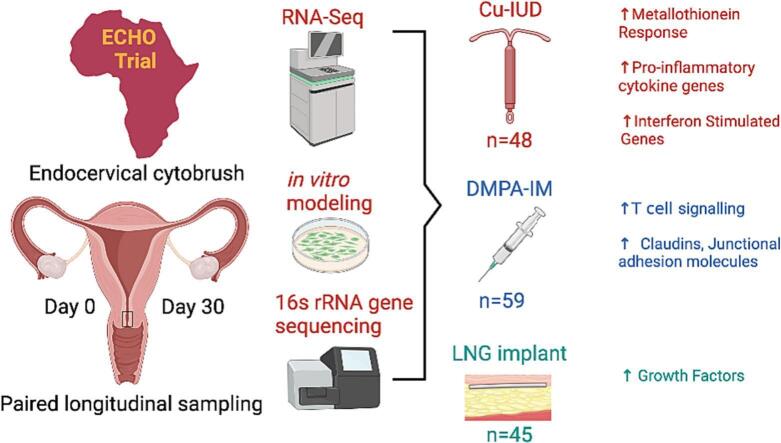
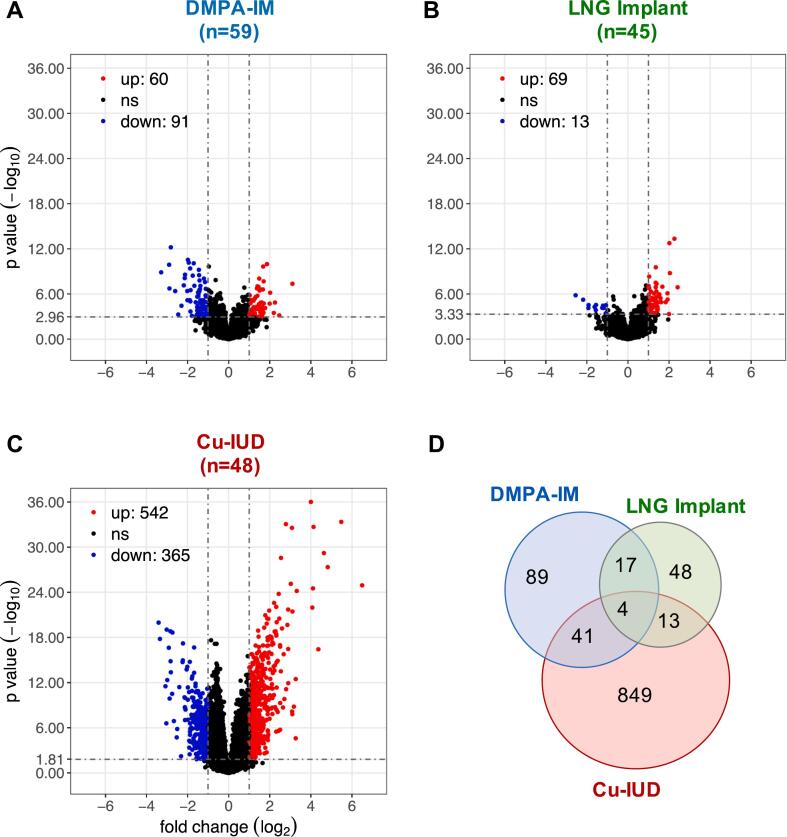
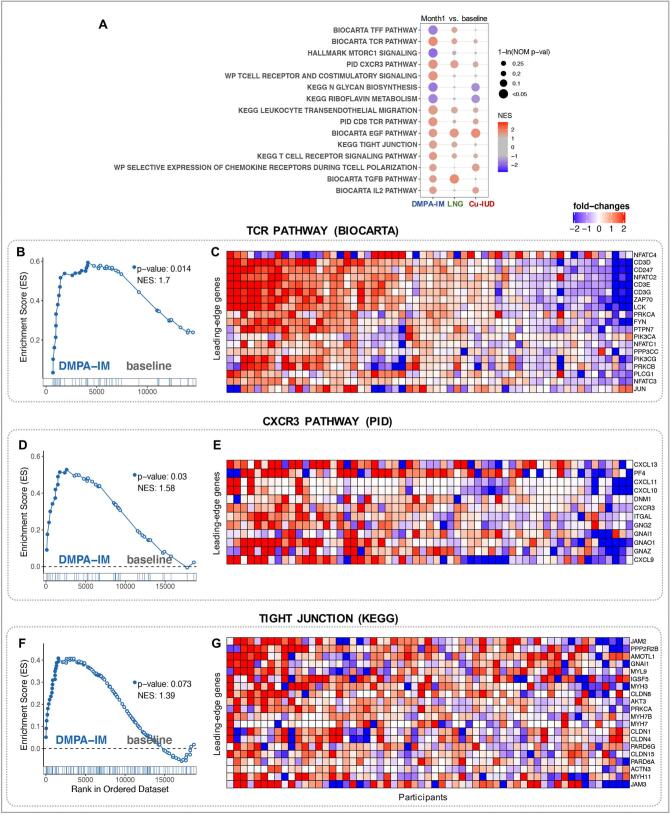
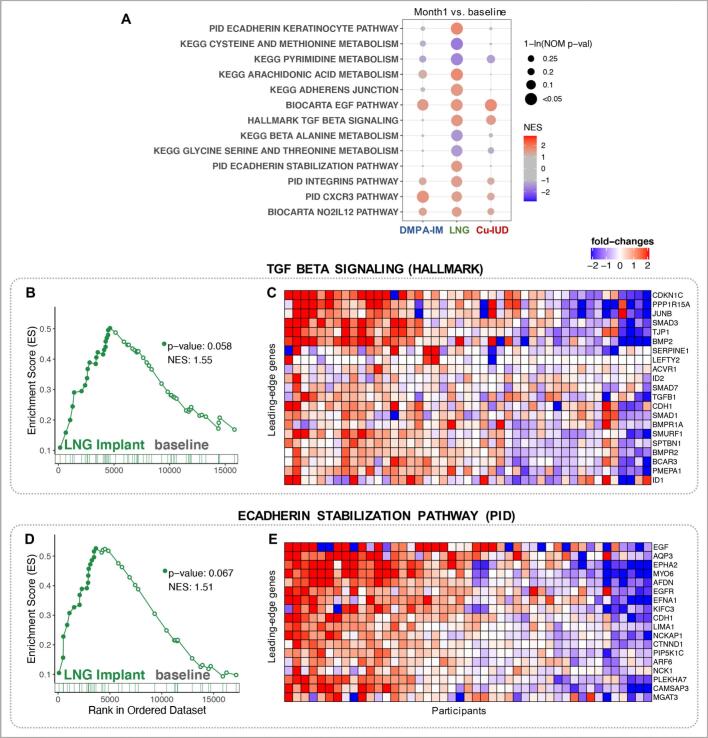
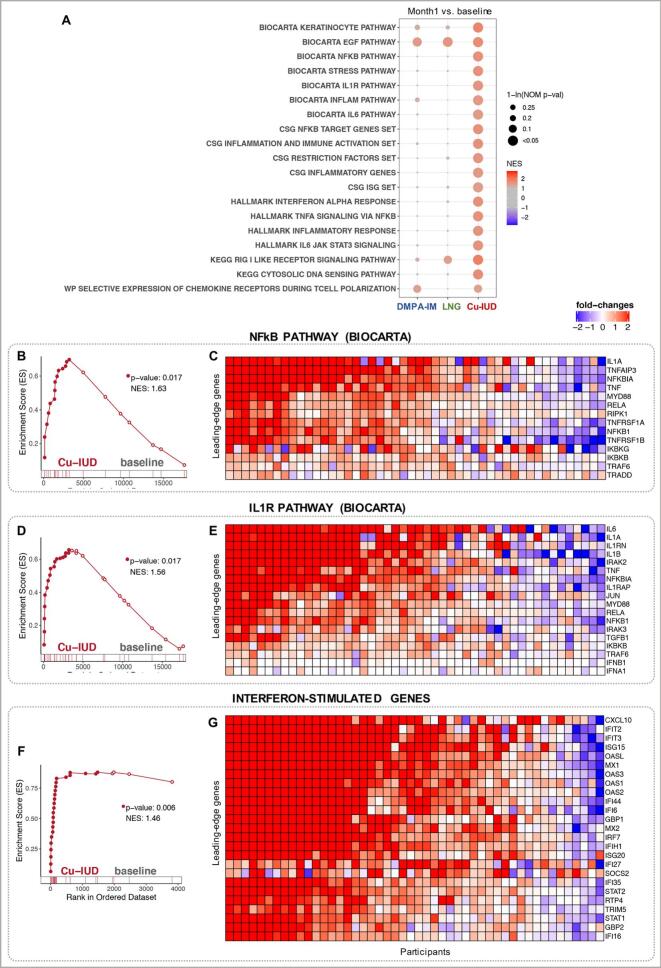
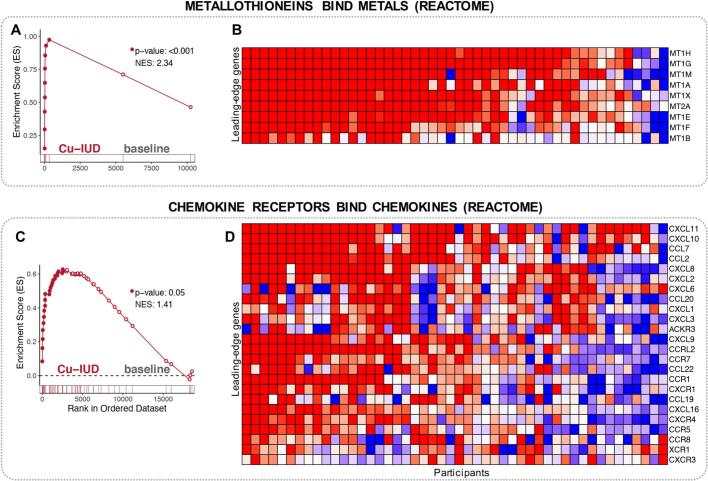
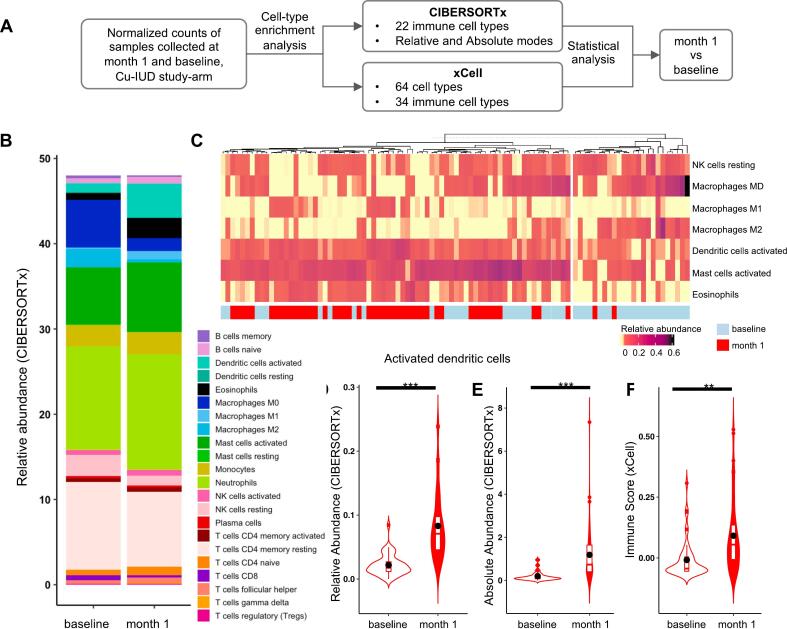
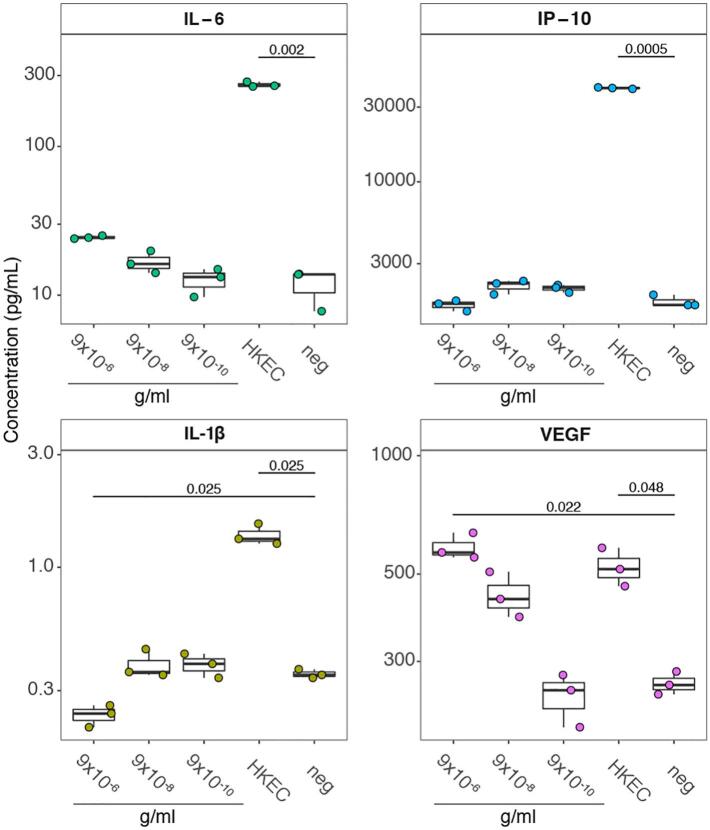
Although effective contraceptives are crucial for preventing unintended pregnancies, evidence suggests that their use may perturb the female genital tract (FGT). A comparative analysis of the effects of the most common contraceptives on the FGT have not been evaluated in a randomized clinical trial setting. Here, we evaluated the effect of three long-acting contraceptive methods: depot medroxyprogesterone acetate(DMPA-IM), levonorgestrel(LNG) implant, and a copper intrauterine device (Cu-IUD), on the endocervical host transcriptome in 188 women from the Evidence for Contraceptive Options and HIV Outcomes Trial (ECHO) trial. Cu-IUD usage showed the most extensive transcriptomic changes, and was associated with inflammatory and anti-viral host responses. DMPA-IM usage was enriched for pathways associated with T cell responses. LNG implant had the mildest effect on endocervical gene expression, and was associated with growth factor signaling. These data provide a mechanistic basis for the diverse influence that varying contraceptives have on the FGT.

Keywords: Contraception; Female genital tract; Mucosa; Randomized clinical trial; Reproductive health; Transcriptome.


Figures

Unlabelled Image
Graphical abstract
Fig. 1
Fig. 1
DMPA-IM, LNG implant and Cu-IUD initiation induce distinct patterns of endocervical gene-expression. The results of the statistical analyses on differential expression of post-vs-pre comparisons, i.e. DMPA-IM vs. baseline, LNG implant vs. baseline, and Cu-IUD vs. baseline, have been shown by the different panels (DMPA-IM: n = 59, LNG Implant: n = 45, Cu-IUD: n = 48). The significantly differentially expressed genes (DEGs) were identified by the following criteria: false discovery rate (FDR) <0.05, absolute fold-change >2, standard-error in fold-change (lfcSE) <1 and mean expression of gene >10. (A-C) Volcano plots showing statistical significance against fold-change for each comparison, with the DEGs highlighted in red (upregulated) and blue (downregulated) colors indicated in the upper quadrants. (D) Venn diagram showing the numbers of overlaps of DEGs across the three longitudinal comparisons. (For interpretation of the references to color in this figure legend, the reader is referred to the web version of this article.)
Fig. 2
Fig. 2
DMPA-IM initiation induced an enrichment of T cell gene signatures in the cervicovaginal tract (nominal p-value < 0.1). Important pathways enriched in DMPA-IM study arm, either at baseline or at month 1, were selected. (A) A dot plot to represent the gene set enrichment analysis (GSEA) statistics for these pathways, across the longitudinal comparisons in the three study arms. The statistical significance of the enrichment (1-ln (nominal p-value)) is shown by the size of the dots and the normalized enrichment score (NES) is represented by a blue-to-red color-gradient, blue for negative scores and red for positive scores. (B-G) Breakout enrichment line plots and leading-edge gene heatmaps for a few of these enriched pathways. (B,D,F) In the line plots, the running enrichment score (y-axis) is indicated for each gene ordered by their rank in the whole data set for that specific comparison, shown by the vertical bars below the x-axis. (C,E,G) Heatmaps for the leading-edge genes of the indicated pathways. The gene-expressions are log-transformed, further normalized by mean of baseline samples in the DMPA-IM. The color gradient goes from blue to red color in representing the lowest to the highest gene-expression across all samples in the comparison. (For interpretation of the references to color in this figure legend, the reader is referred to the web version of this article.)
Fig. 3
Fig. 3
Growth factor signaling and epithelial barrier pathways enriched in women assigned to LNG implant (nominal p-value < 0.1). Important pathways enriched in LNG Implant study arm, either at baseline or at month 1, were selected. (A) A dot plot to represent the gene set enrichment analysis (GSEA) statistics for these pathways, across the longitudinal comparisons in the three study arms. The statistical significance of the enrichment (1-ln (nominal p-value)) is shown by the size of the dots and the normalized enrichment score (NES) is represented by a blue-to-red color-gradient, blue for negative scores and red for positive scores. (B-E) Breakout enrichment line plots and leading-edge gene heatmaps for a few of these enriched pathways. (B,D) In the line plots, the running enrichment score (y-axis) is indicated for each gene ordered by their rank in the whole data set for that specific comparison, shown by the vertical bars below the x-axis. (C,E) Heatmaps for the leading-edge genes of the indicated pathways. The gene-expressions are log-transformed, further normalized by mean of baseline samples in the LNG Implant. The color gradient goes from blue to red color in representing the lowest to the highest gene-expression across all samples in the comparison. (For interpretation of the references to color in this figure legend, the reader is referred to the web version of this article.)
Fig. 4
Fig. 4
Immune activation pathways enriched in women assigned to Cu-IUD (nominal p-value < 0.1). Important pathways enriched in Cu-IUD study arm, were selected. (A) A dot plot to represent the gene set enrichment analysis (GSEA) statistics for these pathways, across the longitudinal comparisons in the three study arms. The statistical significance of the enrichment (1-ln (nominal p-value)) is shown by the size of the dots and the normalized enrichment score (NES) is represented by a blue-to-red color-gradient, blue for negative scores and red for positive scores. (B-G) Breakout enrichment line plots and leading-edge gene heatmaps for a few of these enriched pathways. (B,D,F) In the line plots, the running enrichment score (y-axis) is indicated for each gene ordered by their rank in the whole data set for that specific comparison, shown by the vertical bars below the x-axis. (C,E,G) Heatmaps for the leading-edge genes of the indicated pathways. The gene-expressions are log-transformed, further normalized by mean of baseline samples in the Cu-IUD. The color gradient goes from blue to red color in representing the lowest to the highest gene-expression across all samples in the comparison. (For interpretation of the references to color in this figure legend, the reader is referred to the web version of this article.)
Fig. 5
Fig. 5
Metallothioneins and Chemokines pathways' enriched in women assigned to Cu-IUD (nominal p-value < 0.1). (A-D) Breakout enrichment line plots and leading-edge gene heatmaps for the pathways shown in the fig. (A,C) In the line plots, the running enrichment score (y-axis) is indicated for each gene ordered by their rank in the whole data set for that specific comparison, shown by the vertical bars below the x-axis. (B,D) Heatmaps for the leading-edge genes of the indicated pathways. The gene-expressions are log-transformed, further normalized by mean of baseline samples in the Cu-IUD. The color gradient goes from blue to red color in representing the lowest to the highest gene-expression across all samples in the comparison. (For interpretation of the references to color in this figure legend, the reader is referred to the web version of this article.)
Fig. 6
Fig. 6
Cu-IUD initiation induces significant changes in the elements of innate immunity in endocervical tissue. (A) Workflow of in silico flow cytometry on RNA-seq data of women assigned to Cu-IUD. (B) Relative abundance of immune cell types in baseline and one month Cu-IUD samples using CIBERSORTx algorithm. (C) Hierarchical followed by k-means clustering of Cu-IUD samples according to the top significantly differentially abundant immune cell types. (D—F) The violin plots show the proportion of activated dendritic cells in samples collected at baseline and at one month, computed based on xCell and CIBERSORTx deconvolution algorithms. The two proportions were compared using Wilcoxon–Mann–Whitney test. ** and *** represents q-values ≤0.01 and 0.001, respectively.
Fig. 7
Fig. 7
The concentrations of multiple endocervical cytokines are altered by biologically relevant copper (Cu2+) concentrations. Boxplots display the median and interquartile range. P values were determined using a Student's t-test and were corrected for multiple comparisons. Only values that remained significant after correction are displayed.

Similar articles

Cited by

References

    1. Sedgh G., Bearak J., Singh S., Bankole A., Popinchalk A., Ganatra B., Rossier C., Gerdts C., Tunçalp Ö., Johnson B.R., Jr., Johnston H.B., Alkema L. Abortion incidence between 1990 and 2014: global, regional, and subregional levels and trends. Lancet. 2016;388:258–267. - PMC - PubMed
    1. Shah I.H., Ahman E. Unsafe abortion differentials in 2008 by age and developing country region: high burden among young women. Reprod Health Matters. 2012;20:169–173. - PubMed
    1. Aitken R.J., Baker M.A., Doncel G.F., Matzuk M.M., Mauck C.K., Harper M.J. As the world grows: contraception in the 21st century. J. Clin. Invest. 2008;118:1330–1343. - PMC - PubMed
    1. Zang Y.C., Halder J.B., Hong J., Rivera V.M., Zhang J.Z. Regulatory effects of estriol on T cell migration and cytokine profile: inhibition of transcription factor NF-kappa B. J. Neuroimmunol. 2002;124:106–114. - PubMed
    1. Konstantinus I.N., Balle C., Jaumdally S.Z., Galmieldien H., Pidwell T., Masson L., Tanko R.F., Happel A.U., Sinkala M., Myer L., Bosinger S.E., Gill K., Bekker L.G., Jaspan H.B., Passmore J.S. Impact of hormonal contraceptives on cervical T-helper 17 phenotype and function in adolescents: results from a randomized, crossover study comparing long-acting injectable Norethisterone Oenanthate (NET-EN), combined Oral contraceptive pills, and combined contraceptive vaginal rings. Clin. Infect. Dis. 2020;71:e76–e87. - PMC - PubMed

Publication types