Randomized Controlled Trial
. 2023 Sep;118(3):591-604.
doi: 10.1016/j.ajcnut.2023.07.002. Epub 2023 Aug 8.

Diet-induced Weight Loss and Phenotypic Flexibility Among Healthy Overweight Adults: A Randomized Trial

Affiliations
Randomized Controlled Trial

Diet-induced Weight Loss and Phenotypic Flexibility Among Healthy Overweight Adults: A Randomized Trial

Milena Rundle et al. Am J Clin Nutr. 2023 Sep.

Abstract

Background: The capacity of an individual to respond to changes in food intake so that postprandial metabolic perturbations are resolved, and metabolism returns to its pre-prandial state, is called phenotypic flexibility. This ability may be a more important indicator of current health status than metabolic markers in a fasting state.

Aim: In this parallel randomized controlled trial study, an energy-restricted healthy diet and 2 dietary challenges were used to assess the effect of weight loss on phenotypic flexibility.

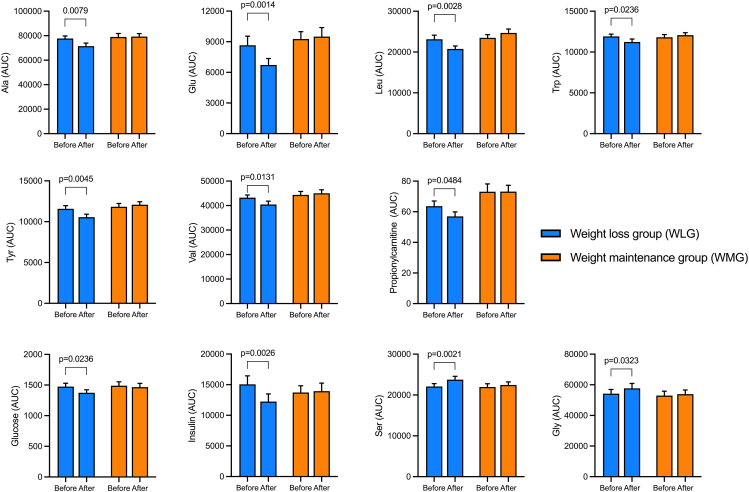
Methods: Seventy-two volunteers with overweight and obesity underwent a 12-wk dietary intervention. The participants were randomized to a weight loss group (WLG) with 20% less energy intake or a weight-maintenance group (WMG). At weeks 1 and 12, participants were assessed for body composition by MRI. Concurrently, markers of metabolism and insulin sensitivity were obtained from the analysis of plasma metabolome during 2 different dietary challenges-an oral glucose tolerance test (OGTT) and a mixed-meal tolerance test.

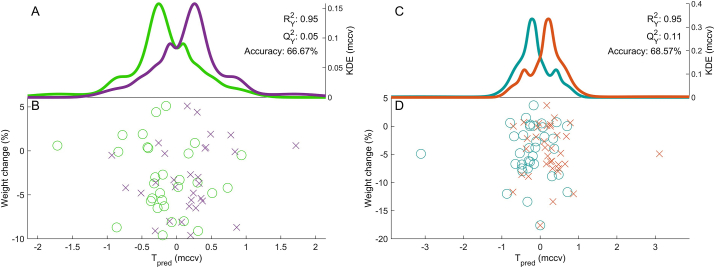
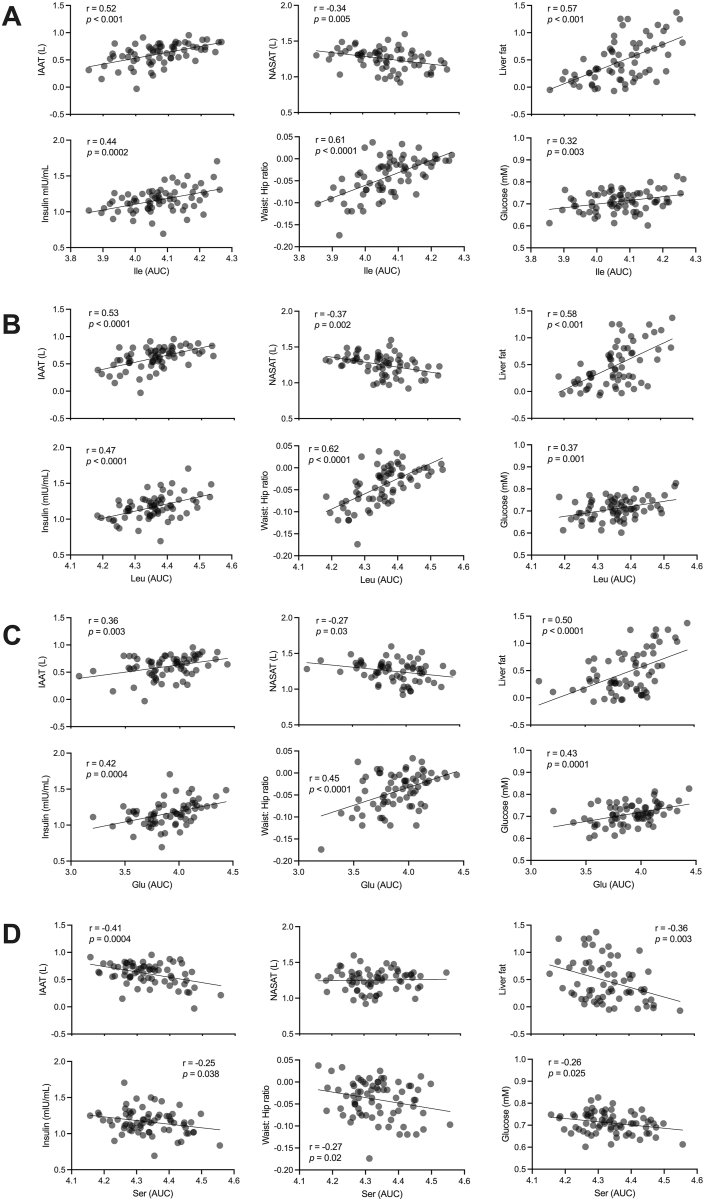
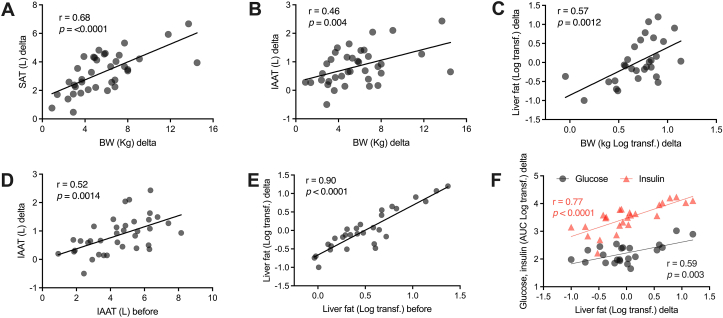
Results: Intended weight loss was achieved in the WLG (-5.6 kg, P < 0.0001) and induced a significant reduction in total and regional adipose tissue as well as ectopic fat in the liver. Amino acid-based markers of insulin action and resistance such as leucine and glutamate were reduced in the postprandial phase of the OGTT in the WLG by 11.5% and 28%, respectively, after body weight reduction. Weight loss correlated with the magnitude of changes in metabolic responses to dietary challenges. Large interindividual variation in metabolic responses to weight loss was observed.

Conclusion: Application of dietary challenges increased sensitivity to detect metabolic response to weight loss intervention. Large interindividual variation was observed across a wide range of measurements allowing the identification of distinct responses to the weight loss intervention and mechanistic insight into the metabolic response to weight loss.

Keywords: insulin sensitivity; meal challenges; metabolites; phenotypic flexibility; weight loss.


Figures

FIGURE 1
FIGURE 1
Dietary predictions using urinary metabolomics in the repeated measures design. (A, B) weight-maintaining group (WMG) diet week 1 is green; week 12 is purple. (C, D) weight-lowering group (WLG) diet – week 1 is cyan; week 12 is orange. (A, C) Kernel density estimates (KDEs) of the Monte Carlo Cross Validation (MCCV) Repeated Measures Partial Least Squares (RM-PLS) predictions. (B, D) Predicted scores (Tpred) against the weight change (in %). Using a one-sample t-test to assess the difference between weeks 1 and 12, there was no significant difference in the weight-maintenance group at P = 0.06 but there was in the weight loss group toward the healthy eating profile at P = 0.03.
FIGURE 2
FIGURE 2
Associations between markers of insulin sensitivity with adipose tissue and plasma glucose and insulin levels before the weight-loss intervention. (A) Pearson correlations of different markers with isoleucine. (B) Pearson correlations of different markers with leucine. (C) Pearson correlations of different markers with glutamate. (D) Pearson correlations of different markers with serine. The area under the curve data were derived from OGTT. Data were Log-transformed. Abbreviations: IAAT, intra-abdominal adipose tissue; NASAT, nonabdominal subcutaneous adipose tissue. N = 72.
FIGURE 3
FIGURE 3
Weight loss–induced changes in plasma concentration of markers of insulin sensitivity during an OGTT. Data are presented as means ± SEM. The adjusted P value is given for statistically significant differences after a mixed model analysis followed by multiple comparisons (Sídák); Weight-lowering group (WLG), N = 40. Weight-maintaining group (WMG), N = 32.
FIGURE 4
FIGURE 4
Associations between weight loss–induced changes in adipose tissues, ectopic fat, and markers of glucose metabolism. Two-tailed Pearson correlation analyses. When indicated, an area under the curve was derived from the OGTT. Some variables were log-transformed to facilitate visualization of the associations. Delta was calculated by subtracting the value after weight loss intervention from the value before intervention. Abbreviations: IAAT, intra-abdominal adipose tissue; BW, body weight; SAT, subcutaneous adipose tissue. Only individuals from weight-lowering group (WLG) are included (n≈40).
FIGURE 5
FIGURE 5
Metabolites discriminating participants with or without improved insulin sensitivity after weight loss. Data derived from the OGTT (A, C, D, E, G, and L) or mixed-meal tolerance test (MMTT) (B, F, H–K) carried out before the weight-loss intervention. DCA, deoxycholic acid; GDCA, glycodeoxycholic acid; TUDCA, tauroursodeoxycholic acid. Data are presented as means ± SEM. Differences between the 2 groups were analyzed by multiple, unpaired t-tests. False discovery rate approach by the 2-stage step-up method of Benjamin, Krieger, and Yekutieli. ∗ = P < 0.05. § = q-value < 0.05. n = 13 in each group.
FIGURE 6
FIGURE 6
Dietary changes induced by the weight loss intervention. (A) Energy intake. (B) Intake of saturated fat. (C) Intake of fiber. (D) Protein intake. The P value of the Student’s t-test is indicated when significant. Data are presented as means ± SEM. The adjusted P value is given for statistically significant differences after a mixed model analysis followed by multiple comparisons (Sídák). n = 13 in each group.

Similar articles

Cited by

References

    1. van Ommen B., van der Greef J., Ordovas J.M., Daniel H. Phenotypic flexibility as key factor in the human nutrition and health relationship. Genes Nutr. 2014;9(5):423. doi: 10.1007/s12263-014-0423-5. - DOI - PMC - PubMed
    1. van Ommen B., Keijer J., Heil S.G., Kaput J. Challenging homeostasis to define biomarkers for nutrition related health. Mol. Nutr. Food Res. 2009;53(7):795–804. doi: 10.1002/mnfr.200800390. - DOI - PubMed
    1. Stroeve J.H.M., van Wietmarschen H., Kremer B.H.A., van Ommen B., Wopereis S. Phenotypic flexibility as a measure of health: the optimal nutritional stress response test. Genes Nutr. 2015;10(3):13. doi: 10.1007/s12263-015-0459-1. - DOI - PMC - PubMed
    1. van Ommen B., Keijer J., Kleemann R., Elliot R., Drevon C.A., McArdle H., et al. The challenges for molecular nutrition research 2: quantification of the nutritional phenotype. Genes Nutr. 2008;3(2):51–59. doi: 10.1007/s12263-008-0084-3. - DOI - PMC - PubMed
    1. van den Broek T.J., Baker G.C.M., Rubingh C.M., Bijlsma S., Stroeve J.H.M., van Ommen B., et al. Ranges of phenotypic flexibility in healthy subjects. Genes Nutr. 2017;12:1–14. doi: 10.1186/s12263-017-0589-8. - DOI - PMC - PubMed

Publication types