

Prediction of the 4-Year Incidence Risk of Ischemic Stroke in Healthy Japanese Adults: The Fukushima Health Database
- PMID: 37661424
- PMCID: PMC10918050
- DOI: 10.5551/jat.64018
Prediction of the 4-Year Incidence Risk of Ischemic Stroke in Healthy Japanese Adults: The Fukushima Health Database
Abstract
Aim: Estimating the risk of developing ischemic stroke (IS) may assist health professionals in motivating individuals to modify their risk behavior.
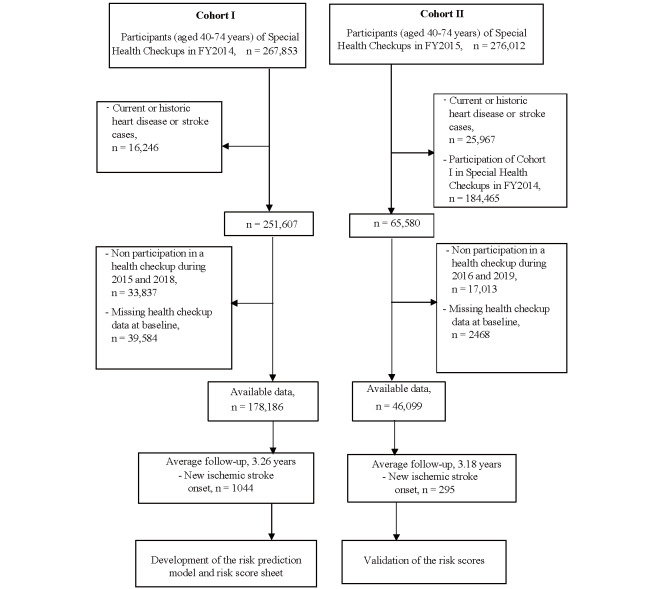
Methods: A predictive model was derived from 178,186 participants from Fukushima Health Database, aged 40-74 years, who attended the health checkup in 2014 and completed at least one annual health checkup by 2018 (Cohort I). Cox proportional hazard regression model was used to build a 4-year prediction model, thus the risk scores were based on the regression coefficients. External validation for the risk scores was conducted in another cohort of 46,099 participants following between 2015 and 2019 (Cohort II).
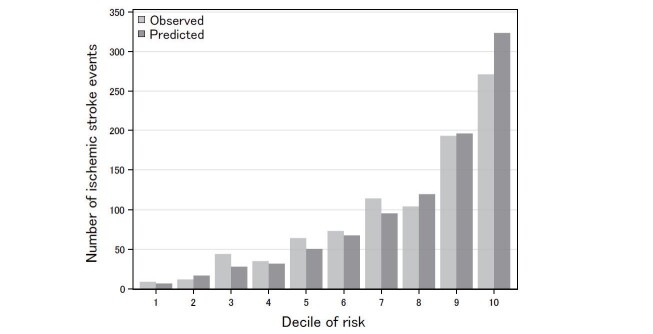
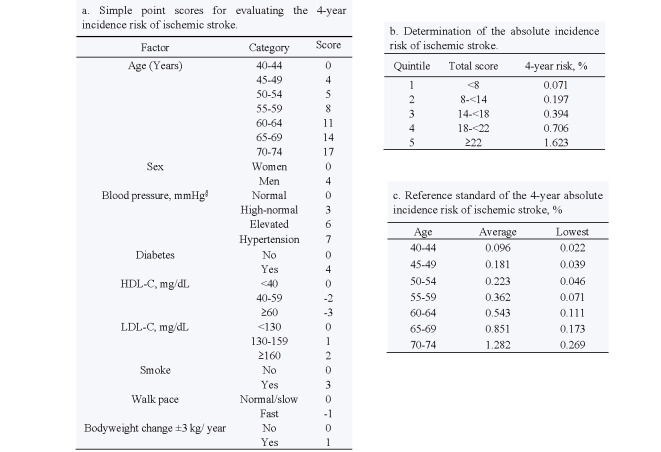
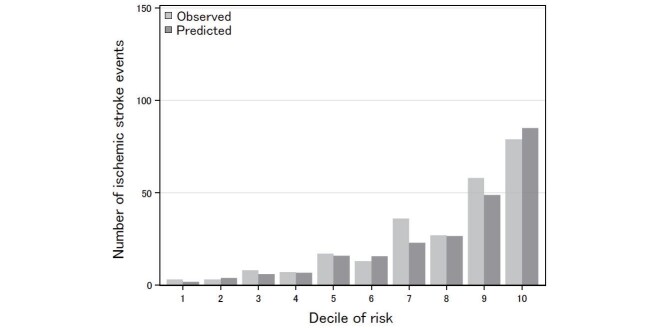
Results: The 4-year cumulated incidence rate of IS was 179.80/100,000 person-years in Cohort I. The predictive model included age, sex, blood pressure, hypertension treatment, diabetes, low- and high-density lipoprotein cholesterol, smoking, walking pace, and body weight change of 3 kg within one year. Risk scores were interpreted based on the Cohort I predictive model function. The Harrell's C-statistics of the discrimination ability of the risk score model (95% confidence interval) was 0.744 (0.729-0.759) in Cohort I and 0.770 (0.743-0.797) in Cohort II. The overall agreement of the risk score probability of IS incidence for the observed/expected case ratio and 95% CI was 0.98 (0.92-1.05) in Cohort I and 1.08 (0.95-1.22) in Cohort II.
Conclusions: The 4-year risk prediction model revealed a good performance for IS incidence, and risk scores could be used to estimate individual incidence risk of IS. Updated models with additional confirmed risk variables may be needed.
Keywords: External validation; Incidence risk; Ischemic stroke; Point-based score; Prediction model.
Conflict of interest statement
All authors declare no conflict of interest.
Figures
References
-
- Nagai M, Ohira T, Takahashi H, Nakano H, Sakai A, Hashimoto S, Yasumura S, Abe M and Fukushima Health Management S: Impact of evacuation onstrends in the prevalence, treatment, and control of hypertension before and after a disaster. J Hypertens, 2018; 36: 924-932 - PubMed
-
- Ohira T, Nakano H, Nagai M, Yumiya Y, Zhang W, Uemura M, Sakai A, Hashimoto S and Fukushima Health Management Survey G: Changes in Cardiovascular Risk Factors After the Great East Japan Earthquake. Asia Pac J Public Health, 2017; 29: 47S-55S - PubMed
-
- Ohira T, Hosoya M, Yasumura S, Satoh H, Suzuki H, Sakai A, Ohtsuru A, Kawasaki Y, Takahashi A, Ozasa K, Kobashi G, Hashimoto S, Kamiya K, Yamashita S and Abe M: Evacuation and Risk of Hypertension After the Great East Japan Earthquake: The Fukushima Health Management Survey. Hypertension, 2016; 68: 558-564 - PubMed
-
- Ohira T, Hosoya M, Yasumura S, Satoh H, Suzuki H, Sakai A, Ohtsuru A, Kawasaki Y, Takahashi A, Ozasa K, Kobashi G, Kamiya K, Yamashita S and Abe M: Effect of Evacuation on Body Weight After the Great East Japan Earthquake. Am J Prev Med, 2016; 50: 553-560 - PubMed