

The polyA tail facilitates splicing of last introns with weak 3' splice sites via PABPN1
- PMID: 37661812
- PMCID: PMC10561182
- DOI: 10.15252/embr.202357128
The polyA tail facilitates splicing of last introns with weak 3' splice sites via PABPN1
Abstract
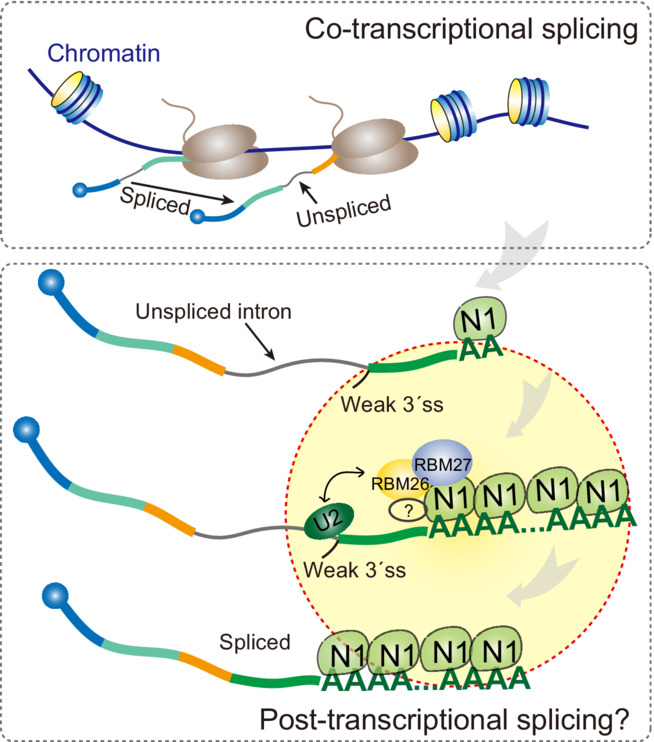
The polyA tail of mRNAs is important for many aspects of RNA metabolism. However, whether and how it regulates pre-mRNA splicing is still unknown. Here, we report that the polyA tail acts as a splicing enhancer for the last intron via the nuclear polyA binding protein PABPN1 in HeLa cells. PABPN1-depletion induces the retention of a group of introns with a weaker 3' splice site, and they show a strong 3'-end bias and mainly locate in nuclear speckles. The polyA tail is essential for PABPN1-enhanced last intron splicing and functions in a length-dependent manner. Tethering PABPN1 to nonpolyadenylated transcripts also promotes splicing, suggesting a direct role for PABPN1 in splicing regulation. Using TurboID-MS, we construct the PABPN1 interactome, including many spliceosomal and RNA-binding proteins. Specifically, PABPN1 can recruit RBM26&27 to promote splicing by interacting with the coiled-coil and RRM domain of RBM27. PABPN1-regulated terminal intron splicing is conserved in mice. Together, our study establishes a novel mode of post-transcriptional splicing regulation via the polyA tail and PABPN1.
Keywords: PABPN1; RBM26&27; last intron splicing; polyA tail; weak 3′ splice site.
© 2023 The Authors.
Conflict of interest statement
The authors declare that they have no conflict of interest.
Figures
- A
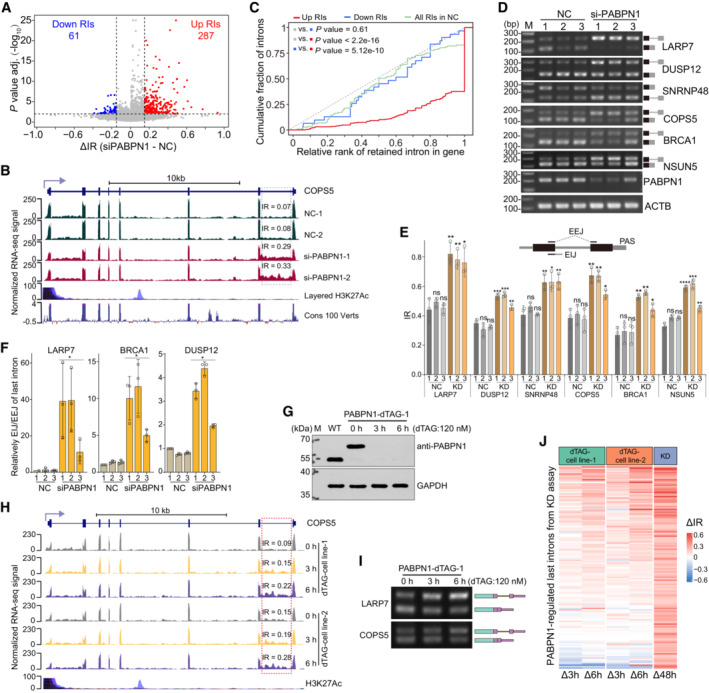
Differential intron retention (IR) analysis of RNA‐seq data from samples under PABPN1 knockdown (siPABPN1) and control (NC) conditions. Significantly repressed and induced intron retention events (retained introns, RIs) are indicated by blue and red dots, respectively. The threshold of IR difference (ΔIR, siPABPN1‐siNC) is 0.15, and the FDR cutoff is 0.01.
- B
UCSC genome browser view showing the normalized RNA‐seq signals of COPS5 in HeLa cells under PABPN1 knockdown (si‐PABPN‐1 and si‐PABPN‐2) and control (NC‐1 and NC‐2) conditions. The quantified intron retention levels (IR score) of the last introns (dotted box) are labeled for all samples, respectively.
- C
Cumulative frequency distributions of retained introns (RIs), up‐regulated (red), and down‐regulated (blue) upon PABPN1 knockdown, and of all retained introns in control (NC, green) samples by their relative intronic ranks in genes.
- D, E
Validation of last intron retention of six representative genes in response to PABPN1 knockdown by semi‐quantitative PCR in HeLa cells treated with three different NC and PABPN1 siRNAs (D). The bottom box diagram shows a schematic view of the primers for spliced (EEJ, exon–exon junction) and unspliced (EIJ, exon–intron junction) isoforms. The quantified intron retention (IR) scores of the last introns are shown on the right for all samples, respectively (E).
- F
Relative ratios of the unspliced (EIJ) to spliced (EEJ) isoforms of the last introns for LARP7, BRCA1, and DUSP12 genes in HeLa cells treated in the same manner as in (D).
- G
Western blot validating the degradation effect of PABPN1 under the treatment of dTAG13 for 0, 3, and 6 h.
- H
UCSC genome browser view showing the normalized RNA‐seq signals of COPS5 in PABPN1‐dTAG cells under PABPN1 rapid degradation for 0, 3, and 6 h. The quantified intron retention levels (IR score) of the last introns (dotted box) are labeled for all samples, respectively.
- I
The last intron splicing analysis of LARP7 and COPS5 in response to PABPN1 rapid degradation by dTAG13 for 0, 3, and 6 h by RT–PCR in PABPN1 dTAG cell lines.
- J
Heatmap showing the IR ratio change of PABPN1 knockdown‐induced retained last introns under rapid degradation of PABPN1 for 3 and 6 h compared to 0 h. The ΔIR values of 143 PABPN1‐regulated last introns from the knockdown assay are shown on the right for comparison.
- A
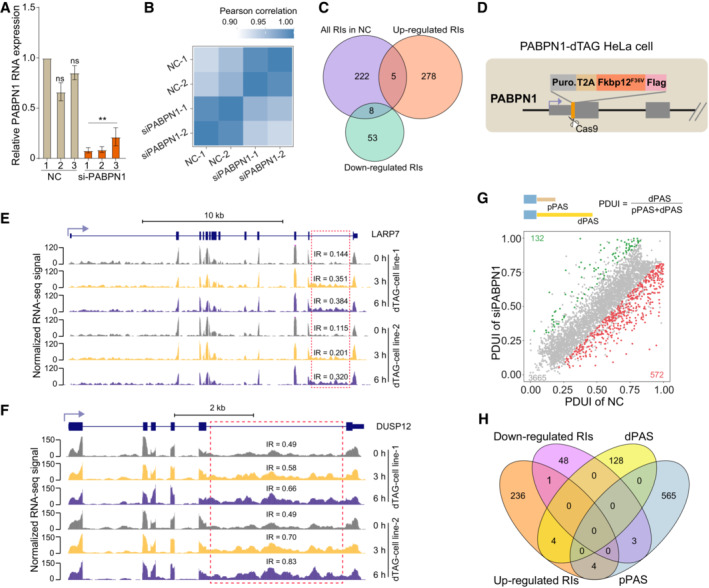
qPCR validation of the RNAi knockdown efficiency of PABPN1 in HeLa cells.
- B
Pearson correlation between two replicates of RNA‐seq data with or without PABPN1 knockdown based on the expression of annotated genes.
- C
Venn diagram showing the overlapping of retained introns (RIs) among three groups: up‐regulated and down‐regulated RIs upon PABPN1 knockdown, and RIs in control (NC) samples.
- D
The schematic diagram of Fkbp12F36V knocking in site of PABPN1 rapidly degrading cell line.
- E, F
UCSC genome browser view showing the normalized RNA‐seq signals of LARP7 (E) and DUSP12 (F) in PABPN1–dTAG cells under PABPN1 rapid degradation for 0, 3, and 6 h. The quantified intron retention levels (IR score) of the last introns (dotted box) are labeled for all samples, respectively.
- G
Global analysis of dPAS usage by PDUI metric between control (NC) and PABPN1 knockdown. The PDUI is calculated by the relative usage of distal PAS (dPAS) to the sum of dPAS and proximal PAS (pPAS) usages (top). The threshold for significant PDUI change is: ¦ΔPDUI¦ ≥ 0.15 and FDR is < 0.01.
- H
Venn diagram showing the overlap between genes with regulated APA and intron retention (IR) events in response to PABPN1 knockdown.
- A
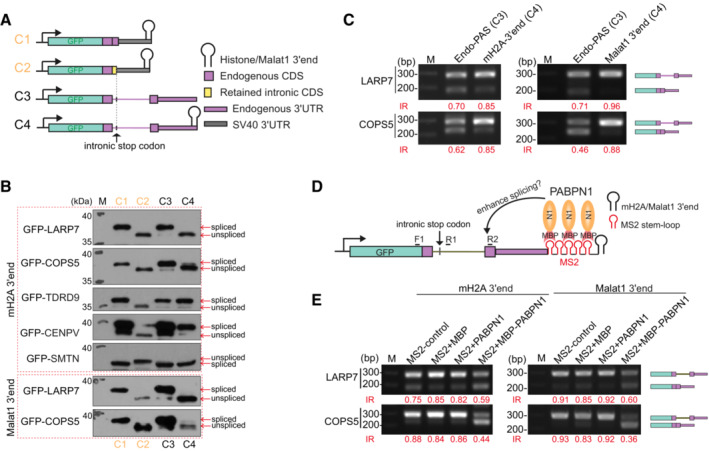
Schematic diagrams of the GFP reporter constructs for downstream splicing assay. The associated elements are annotated on the right. For one endogenous gene, four reporters are constructed: C1 & C2 are the spliced and unspliced CDS controls with SV40 3′ UTR and histone 3′ end, respectively; C3 & C4 contain the last intron and its franking exons of the endogenous gene, with the endogenous 3′ end (C3), histone or Malat1 3′ end (C4).
- B
Western blots of the C1–C4 reporters for two endogenous regulated genes (LARP7 and COPS5) and three endogenous nonregulated control genes (TDRD9, CENPV, and SMTN).
- C
RT–PCR analysis of the spliced and unspliced isoforms from the C3 and C4 reporters for two endogenous regulated genes LARP7 and COPS5.
- D
Schematic diagram of MS2 tethering reporter for PABPN1. 5× MS2 stem loops are inserted to the C4 reporters constructed in Fig 2A which are behind the 3′ UTR and in front of histone/Malat1 3′ end.
- E
RT–PCR quantification of MS2 reporters of histone 3′ end (left) and Malat1 3′ end (right) for two PABPN1‐regulated genes LARP7 and COPS5.
- A–D
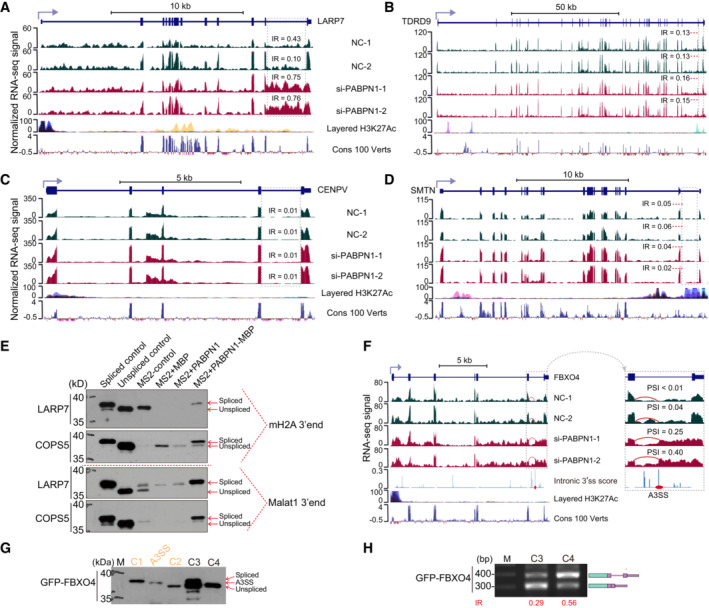
Representative gene regulated by PABPN1 are LARP7 (A) and COPS5 (Fig 1B), whereas three nonregulated genes are TDRD9 (B), CENPV (C), and SMTN (D). The dotted box marks the last intron with quantified intron retention (IR) levels.
- E
Western blot analysis of MS2 reporters with histone/Malat1 3′ end for two PABPN1‐regulated genes LARP7 and COPS5.
- F
UCSC genome browser view showing the RNA‐seq signals of FBXO4 upon PABPN1 knockdown. The dotted box marks the retained intron, and it promotes the usage of an internal 3′ splice site (A3SS, red dot) with the maximum score in all intronic 3′ splice sites predicted by spliceAI.
- G
Western blots of the C1‐C4 reporters and an extra control reporter (A3SS) for FBXO4. The A3SS reporter is similar to C1 control with the CDS from the isoform using the internal 3′ splice site in the retained intron.
- H
Splicing analysis of the C3 and C4 reporters for FBXO4 by RT‐PCR.
- A, B
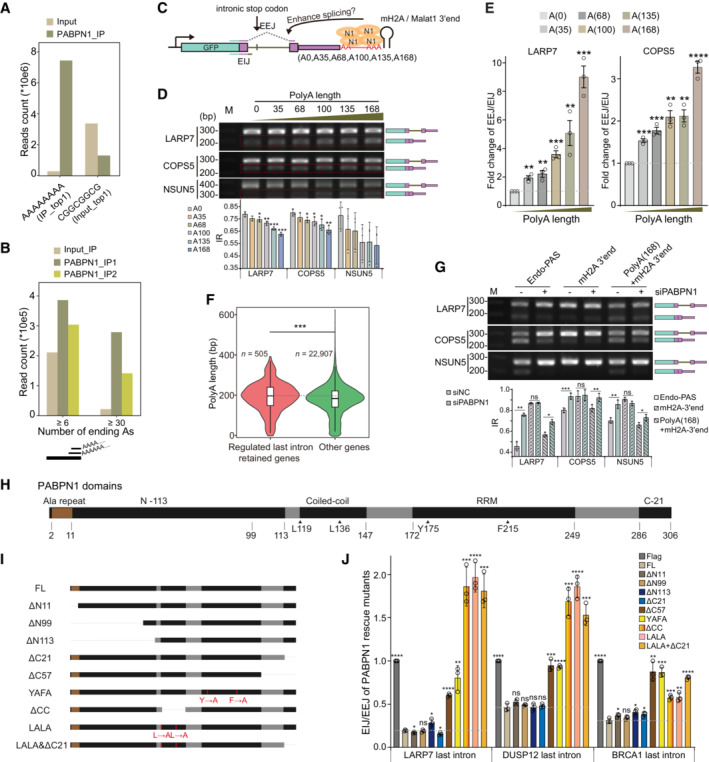
Bar plot showing the enrichment of polyA sequences in PABPN1 immunoprecipitated RNAs using 8‐mer motif analysis (A) or examining the reads ending with 6 or 30 more As.
- B
In (D), only the top motif enriched in PABPN1 IP or input control is shown. The PABPN1 eCLIP data was from ENCODE project (ENCSR820UYE).
- C
Schematic diagram of the splicing reporters by replacing MS2 stem loops in Fig 3A with polyA sequences of different lengths.
- D
RNA quantification by RT–PCR for the spliced and unspliced isoforms (top) and calculated IR scores (bottom) of the reporters in Fig 3F.
- E
Quantification of the spliced (EEJ) over unspliced isoforms (EIJ) of the reporters in Fig 3F.
- F
The polyA tail length distribution of regulated last intron‐retained genes and other genes by nanopore sequencing. The P‐values are calculated by the Wilcoxon test (***P < 0.001).
- G
Splicing analysis of the C3, C4, and polyA reporters in Fig 3F for endogenous genes LARP7, COPS5, and NSUN5 by RT–PCR upon PABPN1 knockdown (top) and the quantified intron retention levels (IR score) of these reporters (bottom).
- H
Protein domains of PABPN1 with known important mutation sites marked by triangles.
- I
Schematic diagrams of PABPN1 mutants for downstream rescue assay.
- J
Relative ratios of the unspliced isoforms (EIJ) to the spliced isoforms (EEJ) of the last introns for LARP7, DUSP12, and BRCA1 genes in HeLa cells treated with si‐PABPN1 and then rescuing PABPN1 mutants constructed in G.
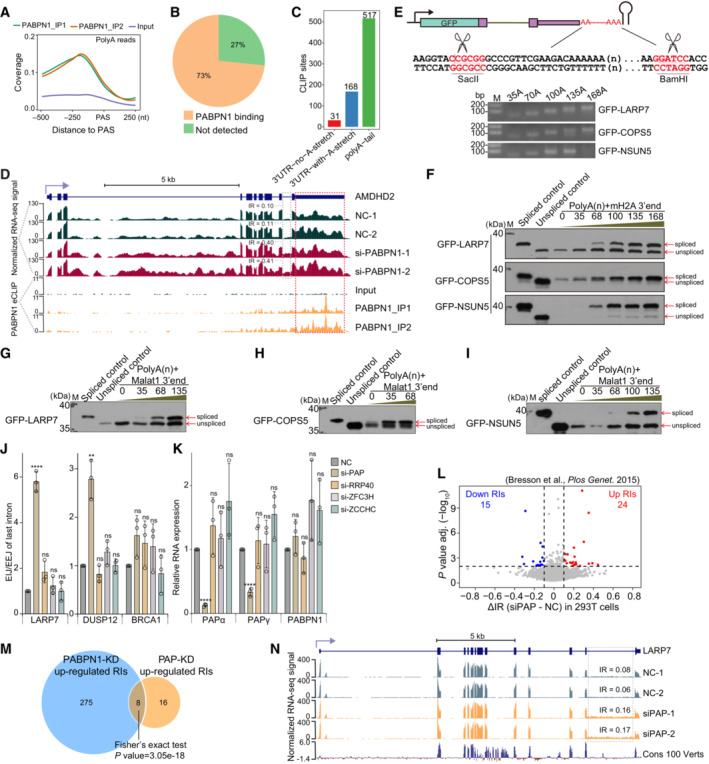
- A
The average levels of polyA read signals of PABPN1 eCLIP‐seq (two replicates: IP1, green; IP2, orange) and input sample (purple) around the polyA sites.
- B
Pie chart of the fraction of last intron‐retained genes with or without PABPN1 binding downstream the last intron to the polyA site in PABPN1 eCLIP data.
- C
The statistics of CLIP sites of PABPN1 binding to last intron retained genes at the 3′ UTR with or without A‐stretches, or at polyA tails.
- D
UCSC genome browser view showing a representative gene example AMDHD2 with last intron retention upon PABPN1 knockdown and with PABPN1 binding from eCLIP‐seq. The gray dotted box marks the retained intron, and the red dotted box marks the region of PABPN1 binding. The intron retention (IR) values for control (NC‐1 and NC‐2) and PABPN1 knockdown (si‐PABPN1‐1 and si‐PABPN1‐2) samples are shown.
- E
Double digestion validation of the inserted polyA sequences in the GFP reporters constructed in Fig 3E.
- F
Western blot of the polyA reporters with histone 3′ end in Fig 3F for endogenous genes LARP7, COPS5, NSUN5.
- G–I
Western blot of the polyA reporters with Malat1 3′ end in Fig 3F for endogenous genes LARP7 (G), COPS5 (H), NSUN5 (I).
- J
Relative ratios of the unspliced isoforms (EIJ) to spliced isoforms (EEJ) of the last introns for LARP7, DUSP12, and BRCA1 genes in HeLa cells upon knocking down PAP and some other exosome components.
- K
qPCR quantitation of the PAP and PABPN1 expression in HeLa cells treated in the same manner as in A.
- L
Differential intron retention (IR) analysis upon PAP knockdown (siPAP) compared with control (NC). The RNA‐seq data are from Bresson et al (2015a). Significantly repressed and induced retained introns (RIs) are indicated by blue and red dots, respectively. The threshold of IR difference (ΔIR, siPAP ‐ NC) is 0.1, and the FDR cutoff is 0.01.
- M
Venn diagram showing the overlap between genes with up‐regulated retained introns in response to PABPN1 and PAP knockdowns.
- N
UCSC genome browser view showing the normalized RNA‐seq signals of LARP7 in 293T cells under PAP knockdown (si‐PAP‐1 and si‐PAP‐2) and control (NC‐1 and NC‐2) conditions. The quantified intron retention levels (IRs) of the last introns (dotted box) are labeled for different samples, respectively.
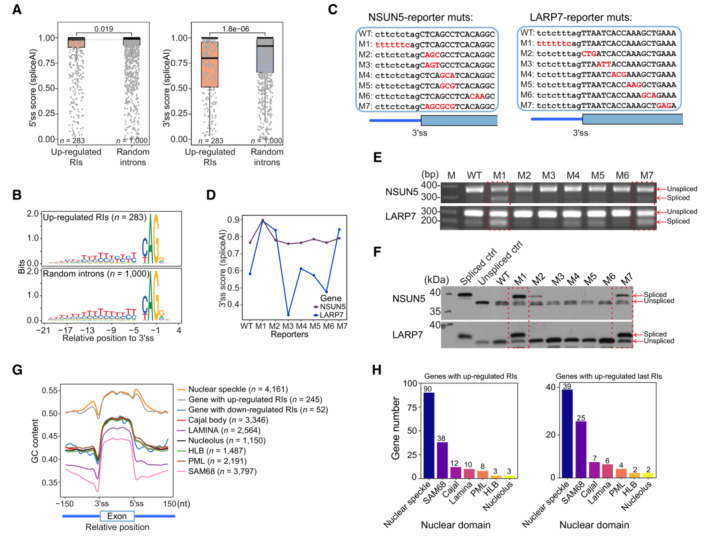
- A
Box plot showing the splicing score analysis of the 5′ ss (left) and 3′ ss (right) of PABPN1 loss‐induced up‐regulated retained introns (orange) and random last introns (gray) calculated by spliceAI.
- B
Consensus sequences of the PABPN1 loss‐induced up‐regulated retained introns (top) and randomly control introns (bottom) aligned at 3′ ss (20 nt intron sequence and 3 nt exon sequence).
- C
Mutants construct near the 3′ splice sites for NSUN5 (left) and LARP7 (right). All the mutants are based on the C4 reporters in Fig 2A.
- D
3′ splice site score of NSUN5 (purple) and LARP7 (blue) mutated reporters predicted by SpliceAI.
- E, F
Splicing analysis of NSUN5 and LARP7 reporter mutants by RT–PCR (E) and Western blot (F).
- G
The exon GC contents of PABPN1‐regulated genes with up‐ or down‐regulated RIs and other groups of genes located in different nuclear substructures including the nucleolus, nuclear speckle, nuclear LAMINA, Cajal body, HLB, PML, and SAM68.
- H
Distribution of PABPN1‐regulated genes with up‐regulated RIs (left) and those genes whose last intron is up‐regulated RI (right) in nuclear substructures.
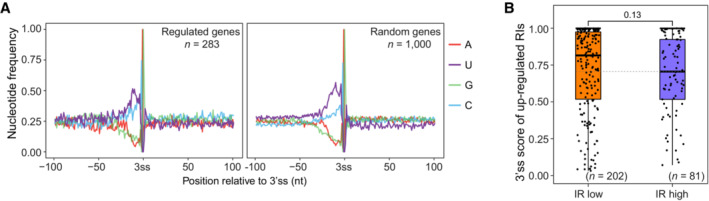
- A
Nucleotide frequency around 3′ ss (50 nt intron sequence and 50 nt exon sequence) of PABPN1 loss‐induced IR‐upregulated introns and randomly control introns.
- B
The 3′ ss score analysis of PABPN1 loss‐induced IR‐upregulated introns grouped by their intron retention (IR) levels, low (0.15 ≤ IR ≤ 0.3) and high (IR > 0.3).
- A
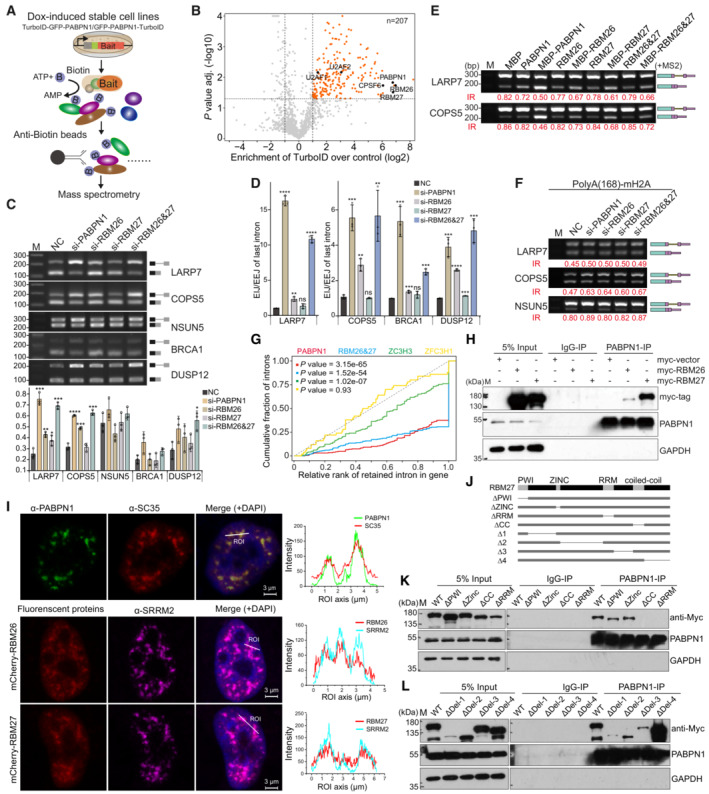
Flowchart of TurboID‐GFP‐PABPN1 proximity labeling coupled mass spectrometry (MS) assay.
- B
Volcano plots of the enriched proteins identified by PABPN1 TurboID‐MS. Significantly enriched proteins are colored in orange, and a few representative proteins are highlighted with labels.
- C
RT‐PCR analysis of the last intron splicing of five representative PABPN1‐dependent endogenous genes upon RBM26/27 knockdown with quantified IR values.
- D
Relative ratios of the unspliced (EIJ) to spliced (EEJ) isoforms of the last introns for LARP7, COPS5, BRCA1, and DUSP12 genes in HeLa cells treated in the same manner as in (C).
- E
Splicing analysis of MS2 reporters for two PABPN1‐regulated genes LARP7 and COPS5 when tethering RBM26/27 by RT‐PCR.
- F
Splicing analysis of the polyA reporters for LARP7, COPS5, and NSUN5 under the condition of RBM26/27 knockdown.
- G
Cumulative frequency distributions of up‐regulated RIs upon PABPN1 (red), RBM26&27 (blue), ZC3H3 (green), and ZFC3H1 (yellow) knockdown by their relative intronic rank in genes.
- H
Western blot validation of endogenous PABPN1 interacting with the myc‐tagged RBM26 and RBM27.
- I
Representative immunofluorescence images showing the localization of endogenous PABPN1 relative to SC35, and the mCherry‐tagged RBM26&27 relative to SRRM2 in vivo.
- J
Protein domains of RBM27 and the schematic diagrams of constructed myc‐tagged RBM27 mutants.
- K, L
Western blot of endogenous PABPN1 immunoprecipitated myc‐tagged RBM27 mutated proteins.
- A
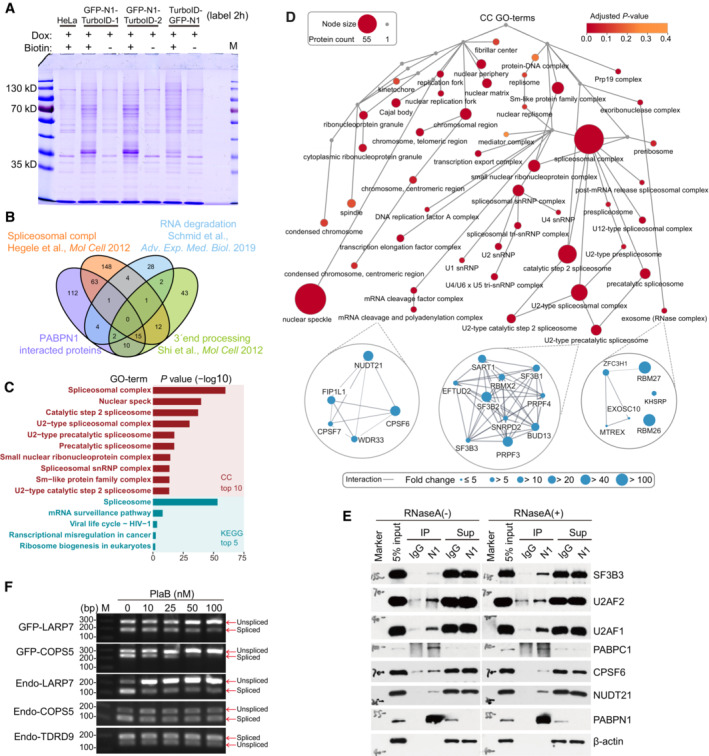
Coomassie Brilliant Blue staining of captured proteins from PABPN1 Turbo‐ID proximity label.
- B
Venn diagram showing the intersection of proteins identified from four independent studies, including the PABPN1 interactome from our TurboID‐MS, the spliceosome‐associated proteins, RNA 3′ end processing proteins, and the RNA degradation‐associated proteins.
- C
GO‐terms enriched in PABPN1 interacting proteins. For Cellular Component (CC) categories, only the top 10 terms are listed; for the KEGG category, only the top 5 terms are listed.
- D
Enriched GO‐terms in the cellular component category of PABPN1 interacting proteins. The enrichment and the count of proteins associated with the GO‐terms are represented by the color and size of the nodes, respectively. At the bottom, the PABPN1 interacting proteins associated with three representative GO‐terms and those not associated with shown terms are presented in four highlighting circles together with the protein–protein interactions annotated in the STRING database. The sizes of the blue nodes represent the enrichment level of the protein interacting with PABPN1.
- E
Western blot validation of PABPN1 interacting with splicing factors and RNA 3′ end processing proteins identified by MS.
- F
Splicing analysis of C3 reporters for LARP7 and COPS5 in Fig 2A and the endogenous genes under pladienolide B (Pla‐B) treatment in repressing U2 complex.
Similar articles
-
PABPN1 prevents the nuclear export of an unspliced RNA with a constitutive transport element and controls human gene expression via intron retention.RNA. 2023 May;29(5):644-662. doi: 10.1261/rna.079294.122. Epub 2023 Feb 8. RNA. 2023. PMID: 36754576 Free PMC article.
-
Poly(A) Polymerase and the Nuclear Poly(A) Binding Protein, PABPN1, Coordinate the Splicing and Degradation of a Subset of Human Pre-mRNAs.Mol Cell Biol. 2015 Jul;35(13):2218-30. doi: 10.1128/MCB.00123-15. Epub 2015 Apr 20. Mol Cell Biol. 2015. PMID: 25896913 Free PMC article.
-
Regulated Intron Retention and Nuclear Pre-mRNA Decay Contribute to PABPN1 Autoregulation.Mol Cell Biol. 2015 Jul;35(14):2503-17. doi: 10.1128/MCB.00070-15. Epub 2015 May 11. Mol Cell Biol. 2015. PMID: 25963658 Free PMC article.
-
Implications of polyadenylation in health and disease.Nucleus. 2014;5(6):508-19. doi: 10.4161/nucl.36360. Epub 2014 Oct 31. Nucleus. 2014. PMID: 25484187 Free PMC article. Review.
-
Coupling of alternative splicing and alternative polyadenylation.Acta Biochim Biophys Sin (Shanghai). 2024 Dec 3;57(1):22-32. doi: 10.3724/abbs.2024211. Acta Biochim Biophys Sin (Shanghai). 2024. PMID: 39632657 Free PMC article. Review.
Cited by
-
RNA 3'end tailing safeguards cells against products of pervasive transcription termination.Nat Commun. 2024 Dec 1;15(1):10446. doi: 10.1038/s41467-024-54834-6. Nat Commun. 2024. PMID: 39617768 Free PMC article.
-
PABPN1 as a pan-cancer biomarker: prognostic significance and association with tumor immune microenvironment.Front Immunol. 2025 Jun 18;16:1553527. doi: 10.3389/fimmu.2025.1553527. eCollection 2025. Front Immunol. 2025. PMID: 40607380 Free PMC article.
-
Phosphorylation of the nuclear poly(A) binding protein (PABPN1) during mitosis protects mRNA from hyperadenylation and maintains transcriptome dynamics.Nucleic Acids Res. 2024 Sep 9;52(16):9886-9903. doi: 10.1093/nar/gkae562. Nucleic Acids Res. 2024. PMID: 38943343 Free PMC article.
-
Nanodynamo quantifies subcellular RNA dynamics revealing extensive coupling between steps of the RNA life cycle.Nat Commun. 2024 Sep 4;15(1):7725. doi: 10.1038/s41467-024-51917-2. Nat Commun. 2024. PMID: 39231948 Free PMC article.
-
Study of the RNA splicing kinetics via in vivo 5-EU labeling.RNA. 2024 Sep 16;30(10):1356-1373. doi: 10.1261/rna.079937.123. RNA. 2024. PMID: 39048310
References
-
- Barutcu AR, Wu M, Braunschweig U, Dyakov BJA, Luo Z, Turner KM, Durbic T, Lin ZY, Weatheritt RJ, Maass PG et al (2022a) Systematic mapping of nuclear domain‐associated transcripts reveals speckles and lamina as hubs of functionally distinct retained introns. Mol Cell 82: 1035–1052.e9 - PubMed
-
- Barutcu AR, Wu M, Braunschweig U, Dyakov BJA, Luo Z, Turner KM, Durbic T, Lin ZY, Weatheritt RJ, Maass PG et al (2022b) Gene Expression Omnibus GSE176439 (https://www.ncbi.nlm.nih.gov/geo/query/acc.cgi?acc=GSE176439). [DATASET] - PubMed
MeSH terms
Substances
Grants and funding
- 2042022dx0003/Fundamental Research Funds for the Central Universities
- 2042020kf1069/Fundamental Research Funds for the Central Universities
- 31922039/MOST ¦ National Natural Science Foundation of China (NSFC)
- 31871316/MOST ¦ National Natural Science Foundation of China (NSFC)
- 2020CFA057/Natural Science Foundation of Hubei Province (Hubei Provincial Natural Science Foundation)
LinkOut - more resources
Full Text Sources
Molecular Biology Databases
