. 2023 Nov 1;55(11):517-543.
doi: 10.1152/physiolgenomics.00163.2022. Epub 2023 Sep 4.

Omics-driven investigation of the biology underlying intrinsic submaximal working capacity and its trainability

Affiliations

Omics-driven investigation of the biology underlying intrinsic submaximal working capacity and its trainability

Monalisa Hota et al. Physiol Genomics. .

Abstract

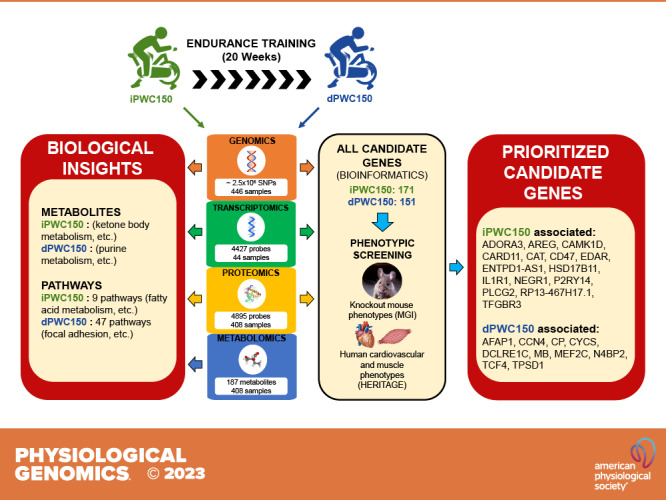
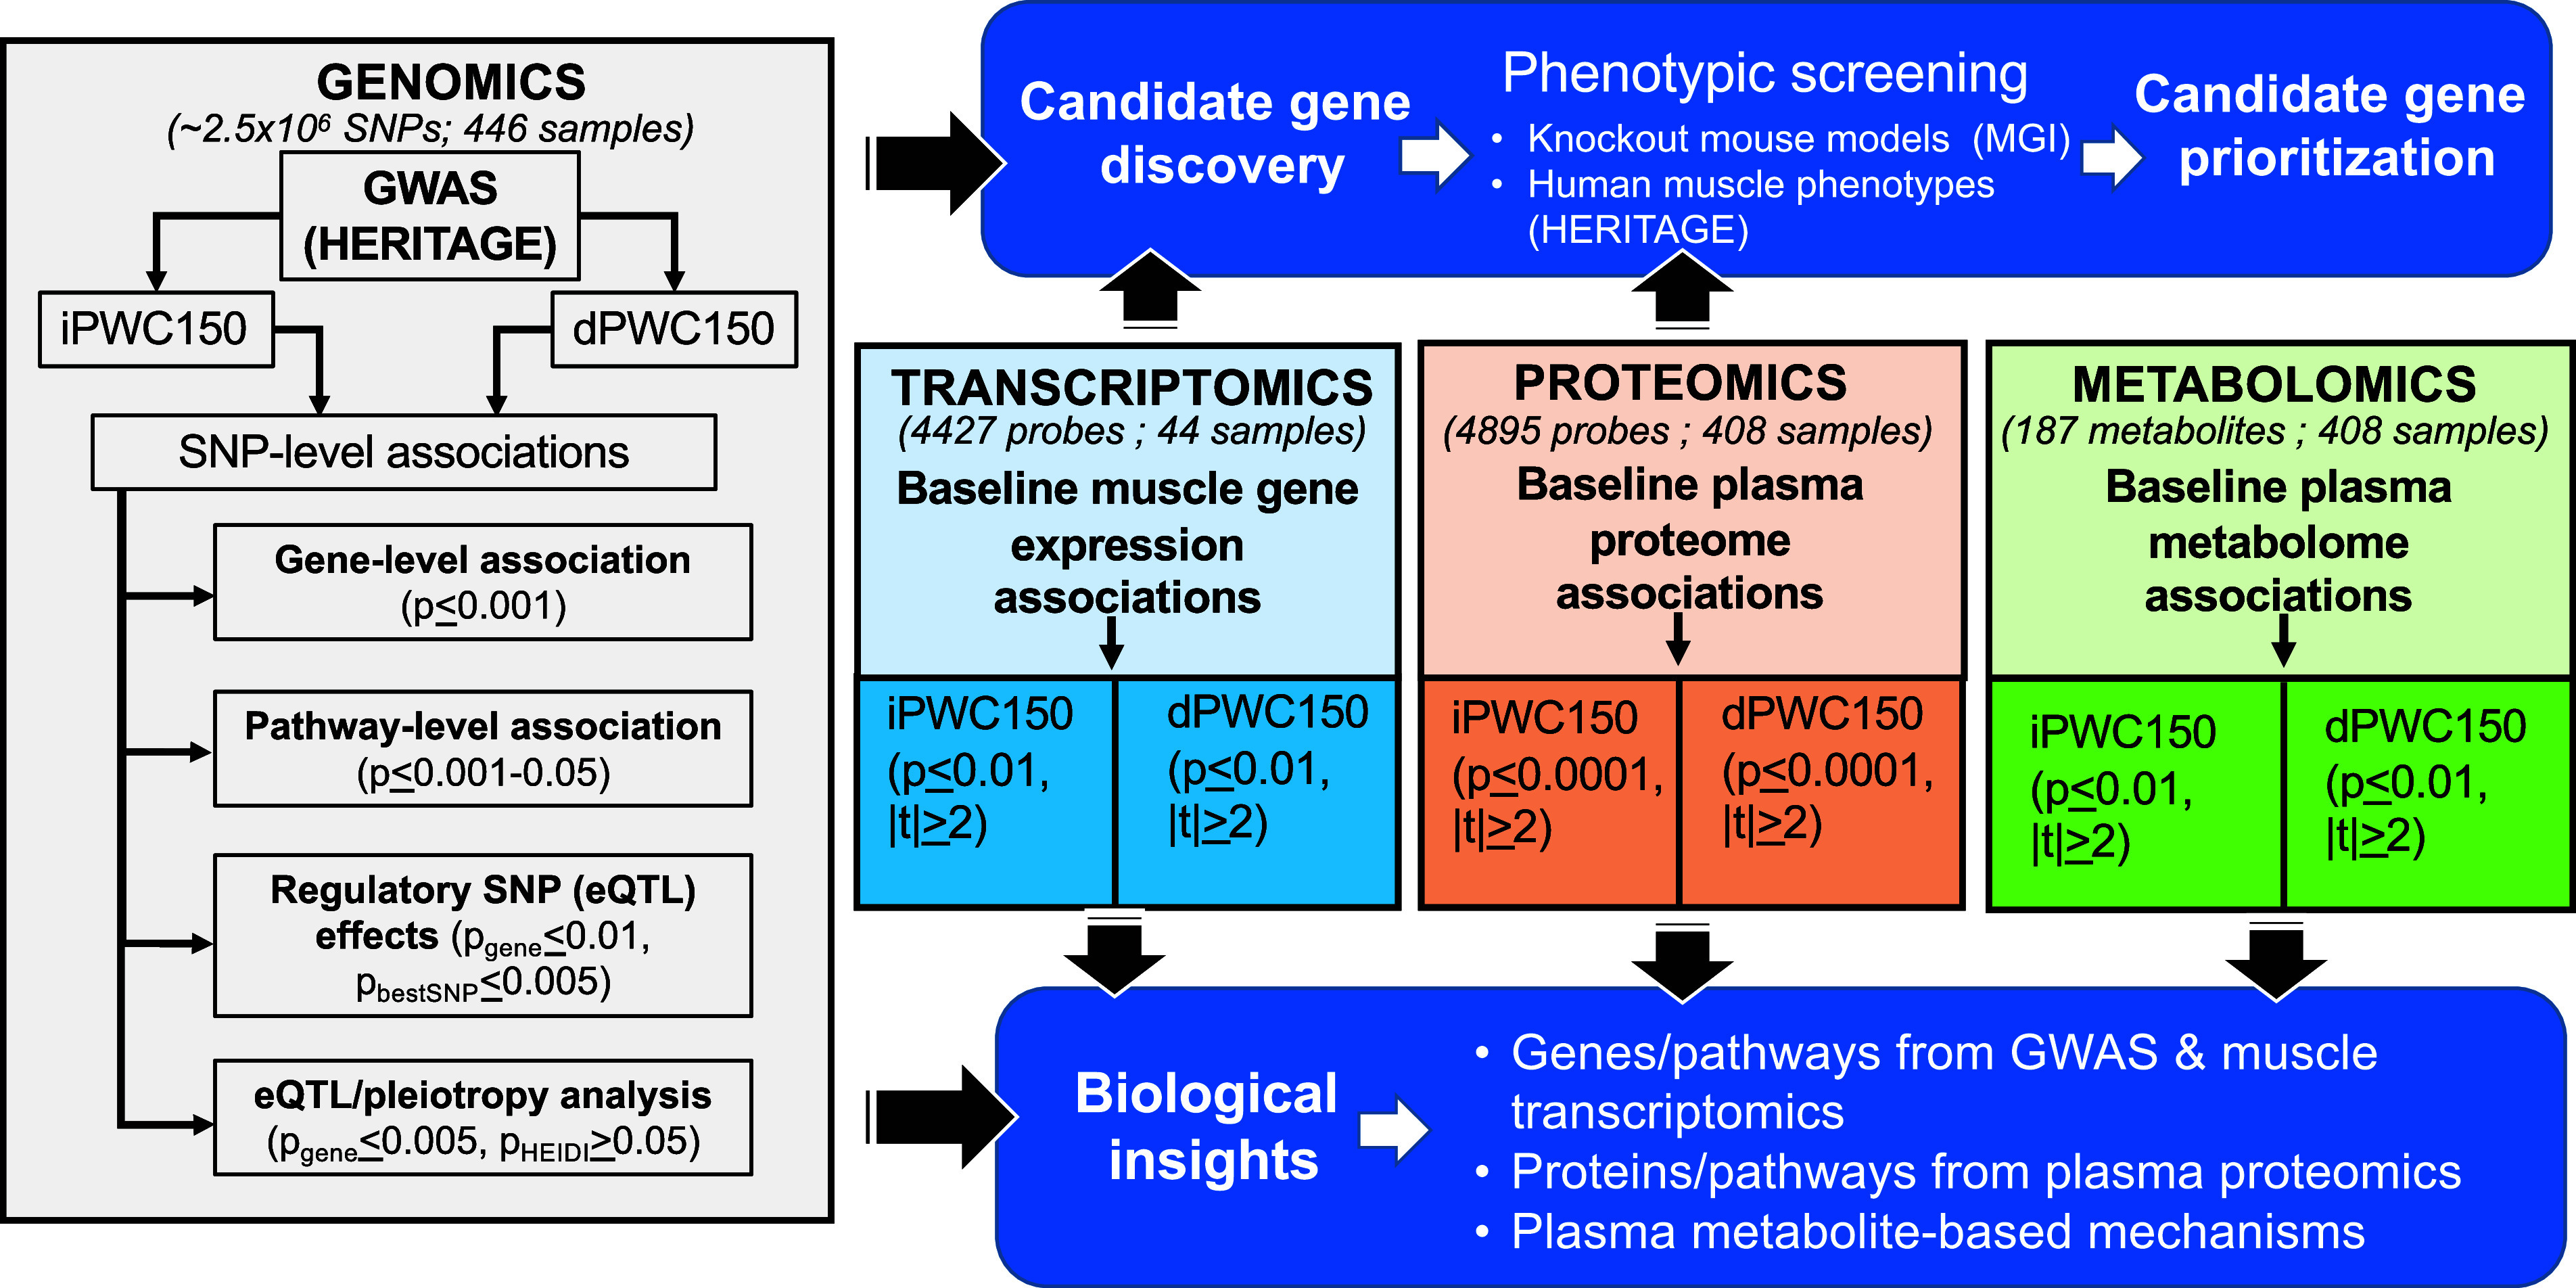
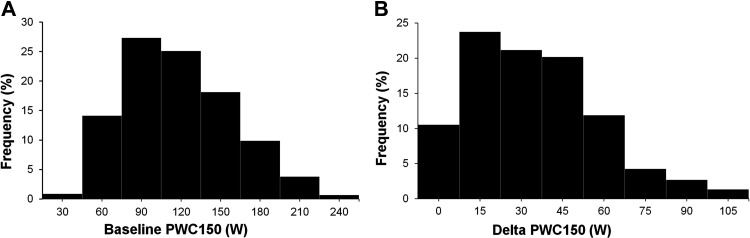
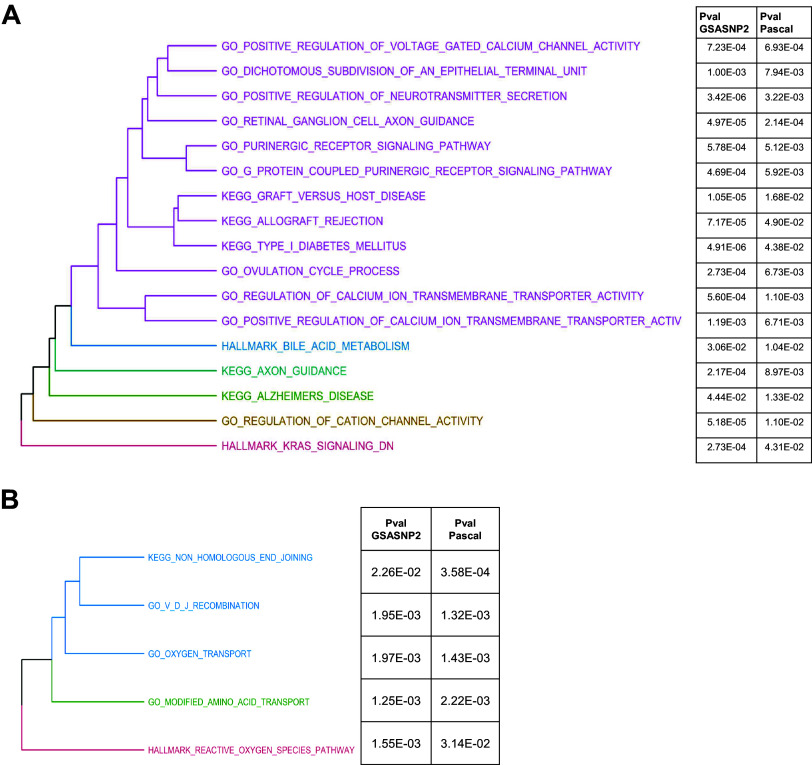
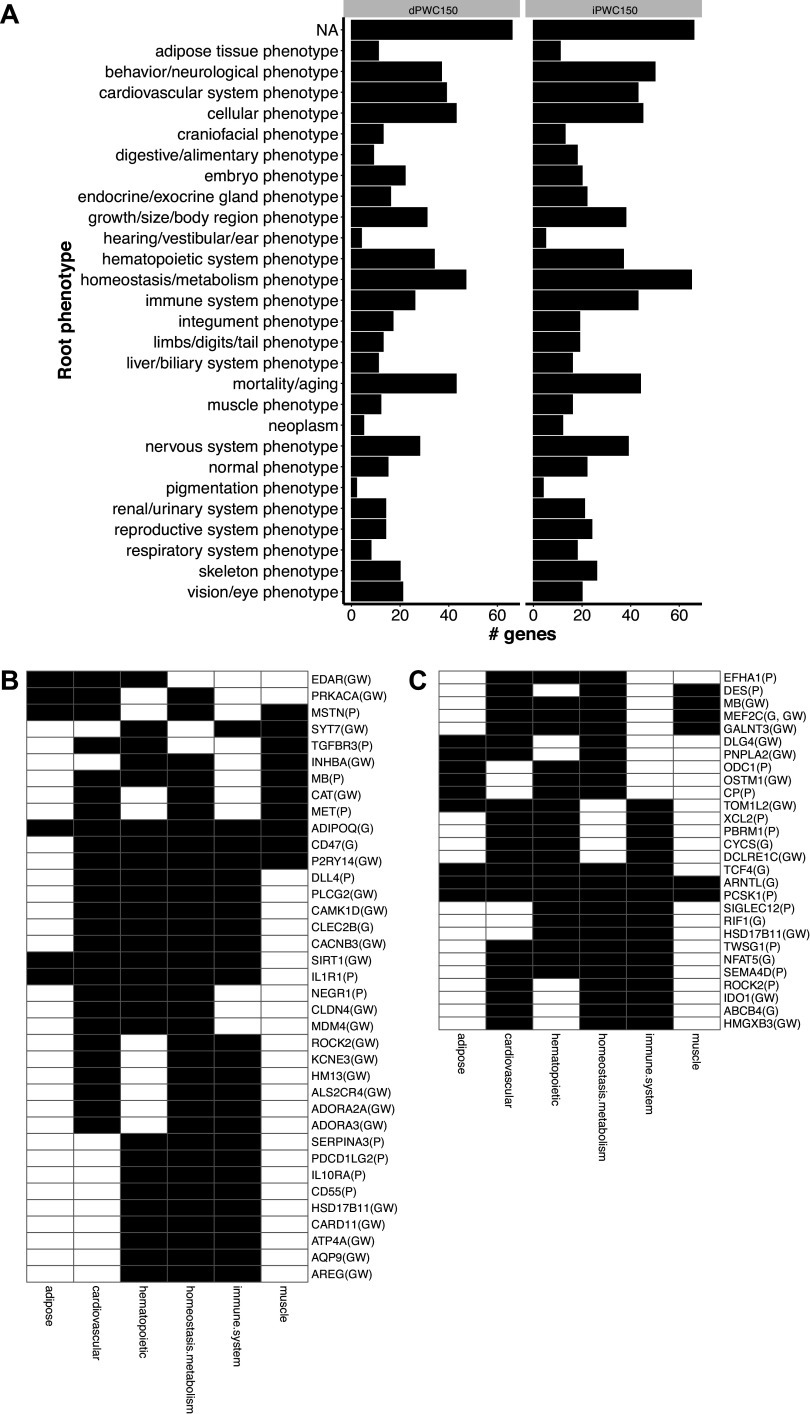
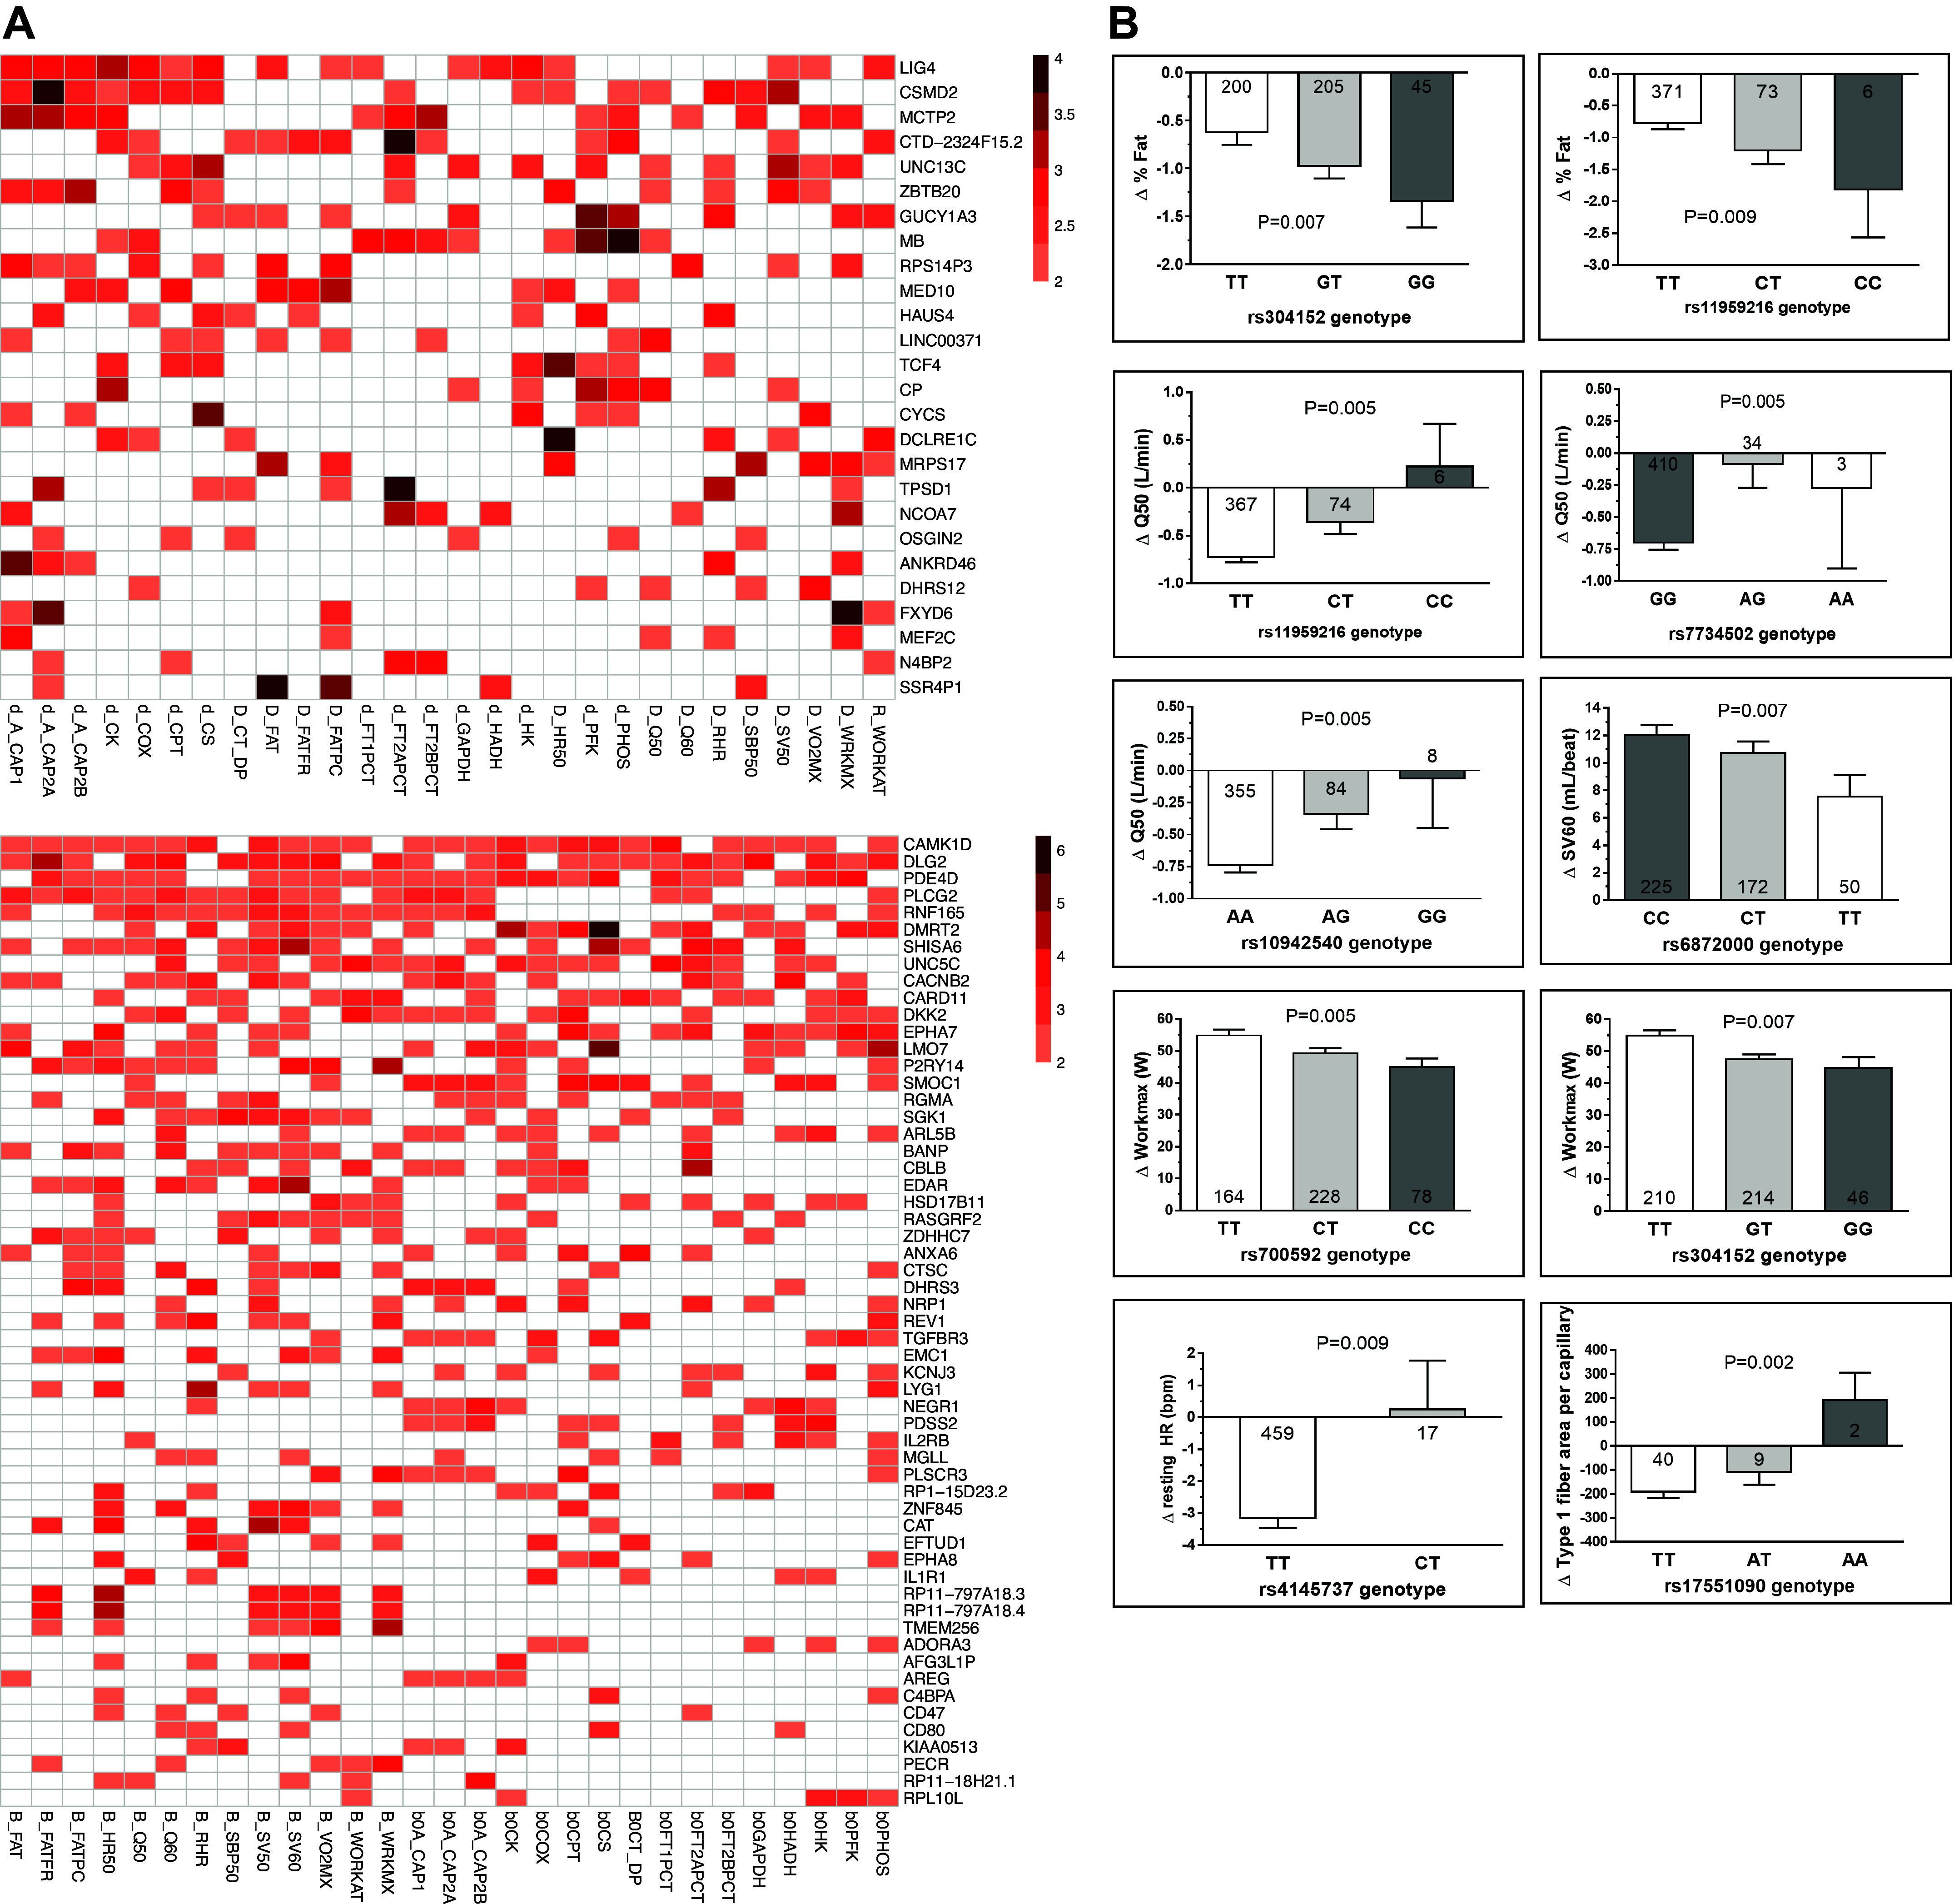
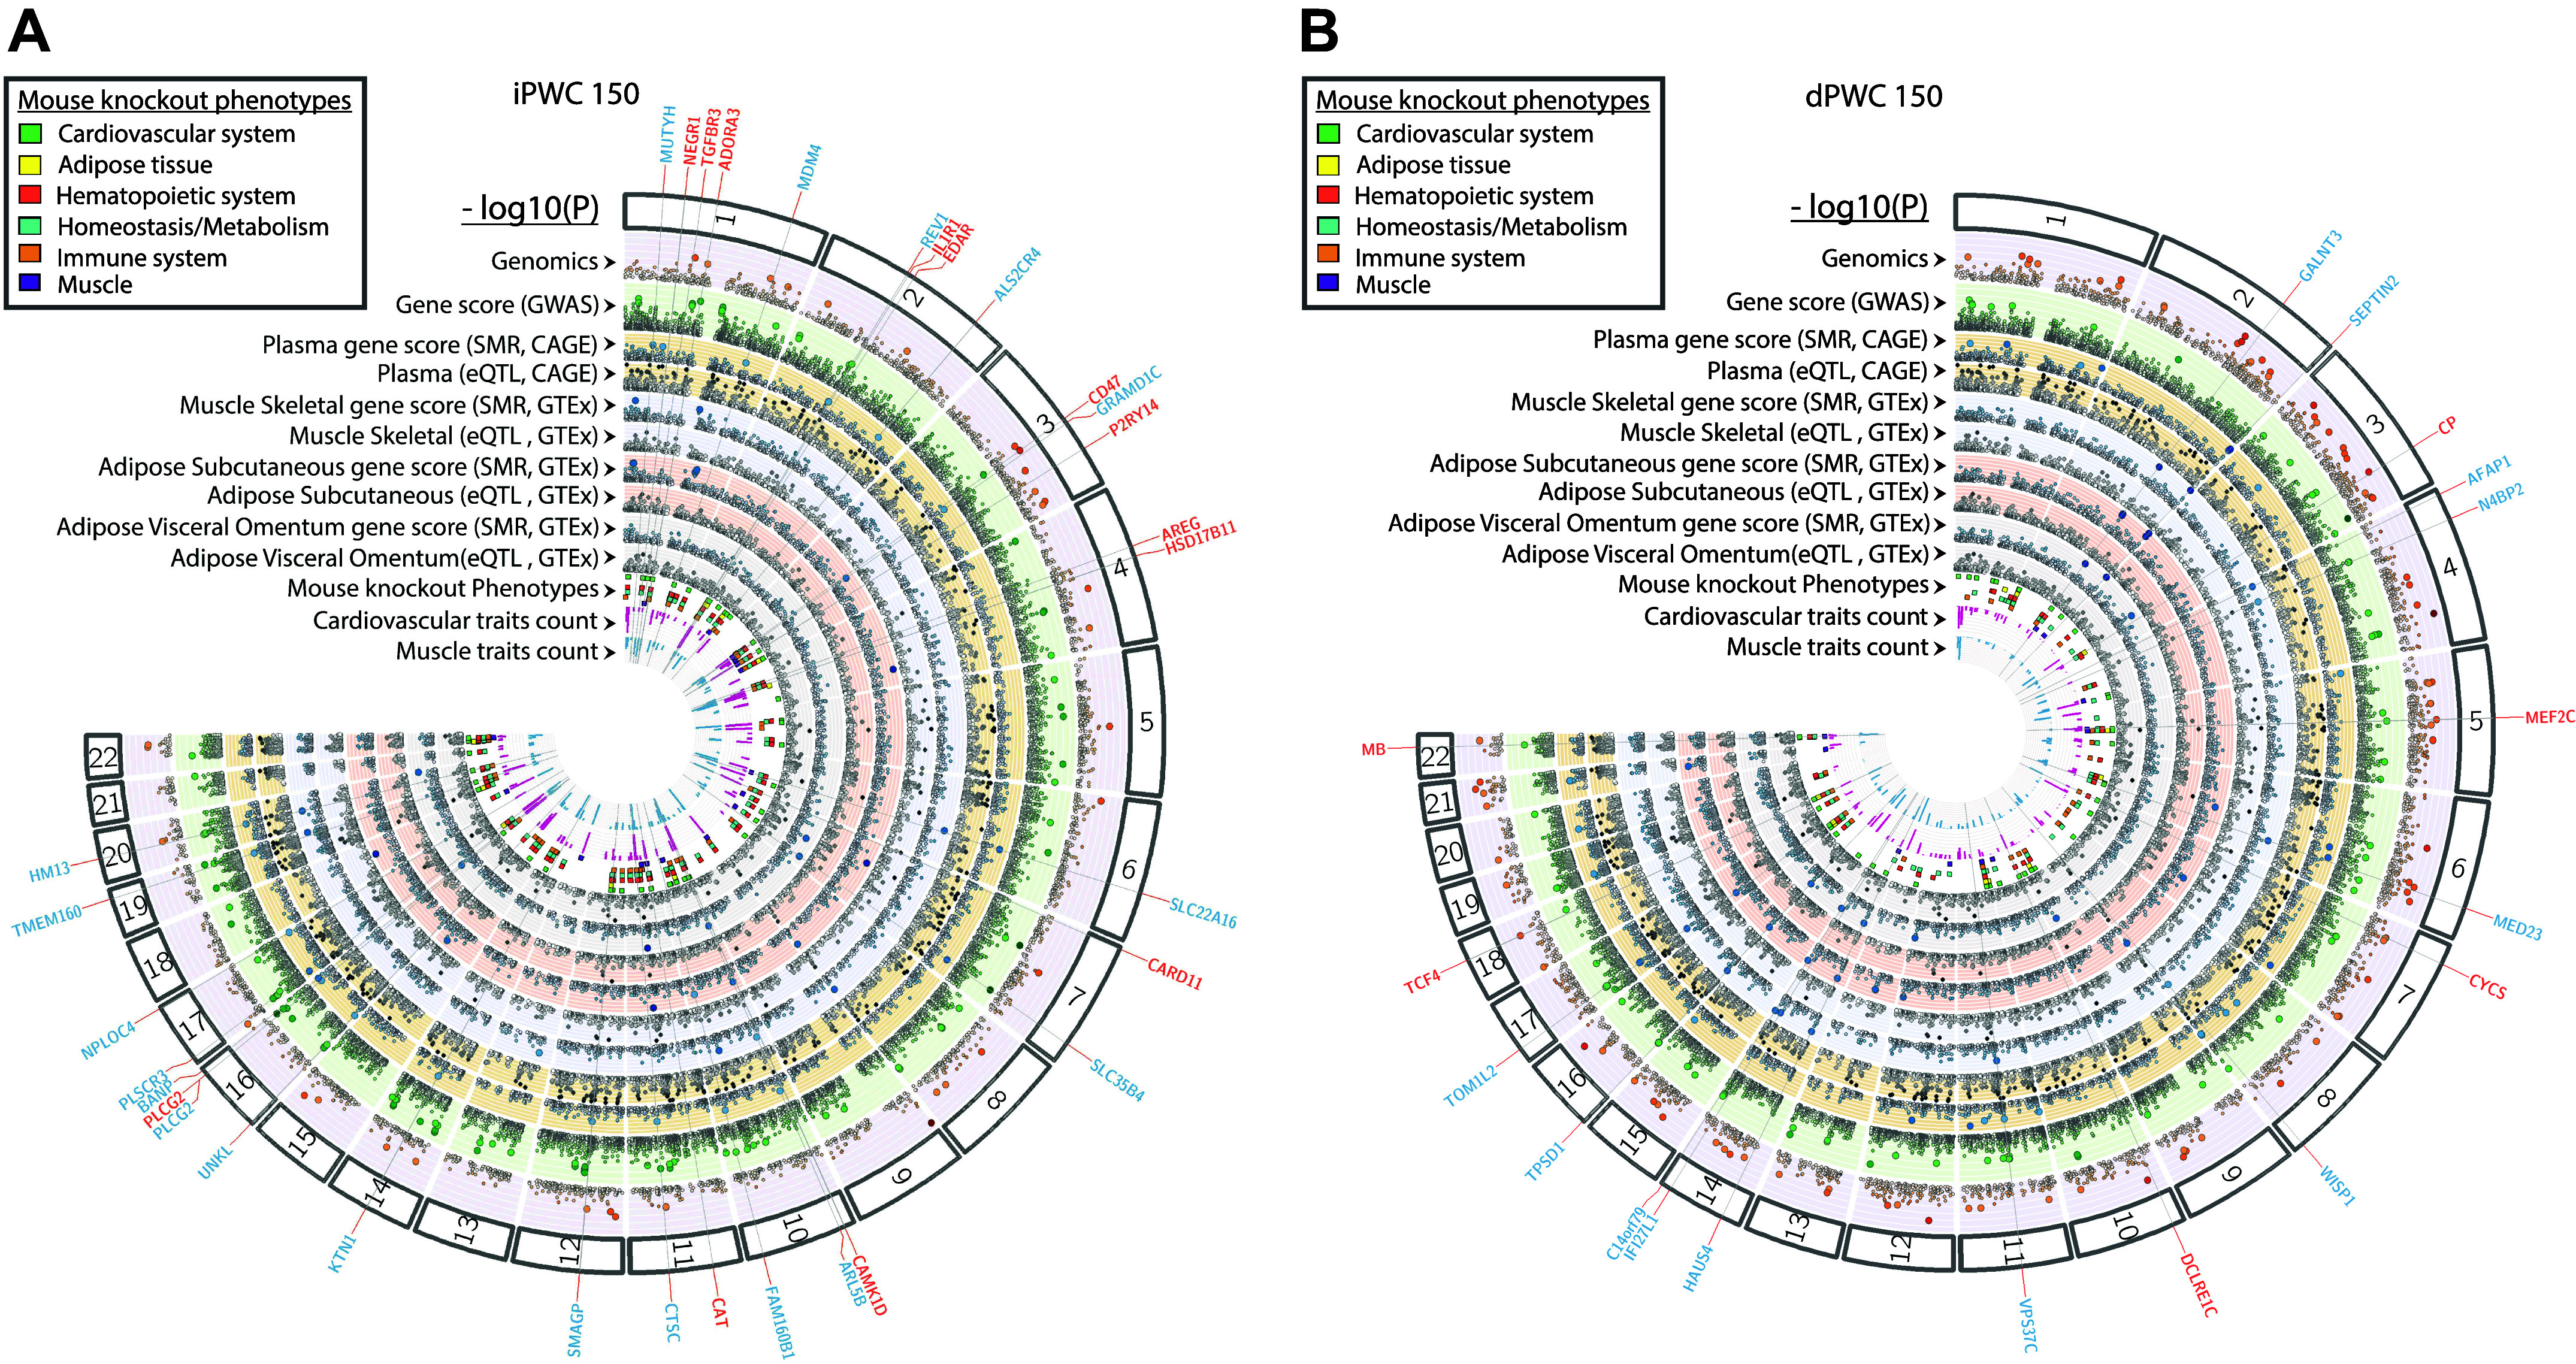
Submaximal exercise capacity is an indicator of cardiorespiratory fitness with clinical and public health implications. Submaximal exercise capacity and its response to exercise programs are characterized by heritability levels of about 40%. Using physical working capacity (power output) at a heart rate of 150 beats/min (PWC150) as an indicator of submaximal exercise capacity in subjects of the HERITAGE Family Study, we have undertaken multi-omics and in silico explorations of the underlying biology of PWC150 and its response to 20 wk of endurance training. Our goal was to illuminate the biological processes and identify panels of genes associated with human variability in intrinsic PWC150 (iPWC150) and its trainability (dPWC150). Our bioinformatics approach was based on a combination of genome-wide association, skeletal muscle gene expression, and plasma proteomics and metabolomics experiments. Genes, proteins, and metabolites showing significant associations with iPWC150 or dPWC150 were further queried for the enrichment of biological pathways. We compared genotype-phenotype associations of emerging candidate genes with reported functional consequences of gene knockouts in mouse models. We investigated the associations between DNA variants and multiple muscle and cardiovascular phenotypes measured in HERITAGE subjects. Two panels of prioritized genes of biological relevance to iPWC150 (13 genes) and dPWC150 (6 genes) were identified, supporting the hypothesis that genes and pathways associated with iPWC150 are different from those underlying dPWC150. Finally, the functions of these genes and pathways suggested that human variation in submaximal exercise capacity is mainly driven by skeletal muscle morphology and metabolism and red blood cell oxygen-carrying capacity.NEW & NOTEWORTHY Multi-omics and in silico explorations of the genes and underlying biology of submaximal exercise capacity and its response to 20 wk of endurance training were undertaken. Prioritized genes were identified: 13 genes for variation in submaximal exercise capacity in the sedentary state and 5 genes for the response level to endurance training, with no overlap between them. Genes and pathways associated with submaximal exercise capacity in the sedentary state are different from those underlying trainability.

Keywords: cardiorespiratory fitness; genomics; metabolomics; proteomics; transcriptomics.


Conflict of interest statement

No conflicts of interest, financial or otherwise, are declared by the authors.

Figures

None
Graphical abstract
Figure 1.
Figure 1.
Schematic of the overall analysis approach. The four streams of analysis are shown in colored boxes: genome-wide association study (GWAS; gray), transcriptomics (blue), proteomics (orange), and metabolomics (green). For each stream, analysis is conducted independently for intrinsic and delta physical working capacity at a heart rate of 150 beats/min (iPWC150 and dPWC150, respectively) associations. The GWAS analysis pipeline consisted of using the single-nucleotide polymorphism (SNP)-level association data to compute gene- and pathway-level associations and to conduct expression quantitative trait loci (eQTL) analysis in skeletal muscle, adipose, and whole blood, including tests for pleiotropy of candidate eQTL SNPs. For transcriptomics, proteomics, and metabolomics data, the respective expression levels were tested for association to iPWC150 or dPWC150 via linear models, after adjustments for age, sex, and body mass index. GWAS, transcriptome, and proteome data were analyzed to identify a list of candidate genes (top blue box). The candidate genes were then examined for phenotypes in knockout mouse models (when available) and human cardiovascular and muscle-relevant phenotypes measured on HERITAGE participants. The results from the phenotype analyses were used to identify a list of prioritized candidate genes. in addition, the results from GWAS, transcriptomics, proteomics, and metabolomics were also interrogated to identify biological mechanisms (pathways) associated with iPWC150 and dPWC150 (bottom blue box).
Figure 2.
Figure 2.
Distribution of intrinsic and delta physical working capacity at a heart rate of 150 beats/min (iPWC150 and dPWC150, respectively) responses to training in HERITAGE subjects. A: distribution of iPWC150 values in HERITAGE subjects in the sedentary state ordered from low to high. B: histogram of dPWC150 values across 10 classes of response levels to the exercise training program in the same set of HERITAGE White adults. Results are based on complete data on 446 White adults.
Figure 3.
Figure 3.
Pathway enrichment analysis based on single-nucleotide polymorphism (SNP) associations to intrinsic and delta physical working capacity at a heart rate of 150 beats/min (iPWC150 and dPWC150, respectively). A: pathways identified in common by GSASNP2 and Pascal for iPWC150-associated SNPs. The dendrogram was arranged by the extent of gene overlap between pathways. The enrichment P values for each pathway in GSASNP2 and Pascal are indicated in the table to the right of the dendrogram. B: dendrogram of common enriched pathways based on dPWC150-associated SNPs. Pathway P values in GSASNP2 and Pascal are indicated to the right of each pathway. KEGG, Kyoto Encyclopedia of Genes and Genomes.
Figure 4.
Figure 4.
Summary data-based Mendelian randomization (SMR)-based expression quantitative trait loci (eQTL) analysis in skeletal muscle. A: SMR-based locus plot shown for RP11-499P20.2 lncRNA, as an example. Top: −log10(P values) of the single-nucleotide polymorphisms (SNPs) near the RP11-499P20.2 locus from the genome-wide association study (GWAS) analysis of intrinsic physical working capacity at a heart rate of 150 beats/min (iPWC150). Red and blue diamonds represent −log10(P values) from the SMR tests for associations of gene expression with iPWC150. Probes showing pleiotropy (not rejected by the HEIDI test) are indicated by solid diamonds. Bottom: plot showing –log10(P values) of the SNP association for gene expression probe ENSG00000185324.17 (tagging RP11-499P20.2) from the GTEx skeletal muscle eQTL database and the genomic features around the SMR significant SNP. B: comparison of effect sizes in GWAS and eQTL datasets for probe ENSG00000185324.17 (red triangle). eQTLs around the top cis-eQTLs were positively associated with increased expression of RP11-499P20.2 (x-axis) and inversely associated with iPWC150 levels (y-axis), suggesting that increased lncRNA expression may regulate one or more genes associated with iPWC150. The color bar to the right shows the level of correlation of eQTLs with the top cis-eQTL. C: SMR-based locus plot for the actin filament-associated protein 1 (AFAP1) gene. Plot elements are same as for the locus plot for RP11-499P20.2. D: comparison of effect sizes in GWAS and eQTL for the AFAP1 probe. AFAP1-associated cis-eQTLs were negatively associated with both skeletal muscle AFAP1 gene expression and delta intrinsic physical working capacity at a heart rate of 150 beats/min (dPWC150) levels. Plot elements are the same as for effect size comparisons with RP11-499P20.2-associated SNPs.
Figure 5.
Figure 5.
Transcriptomics analysis of intrinsic and delta physical working capacity at a heart rate of 150 beats/min (iPWC150 and dPWC150, respectively) associations. A: partial residual plots of log2 gene expression versus iPWC150 levels for selected significantly associated genes. The name of the gene is indicated at the top of each plot. iPWC150 values are plotted on the x-axis, and the partial residual scores are plotted on the y-axis. The dashed line represents the line of best fit from linear regression analysis. B: partial residual plots for selected genes significantly associated with dPWC150. Plots are constructed in exactly the same way as described for iPWC150. C and D: enrichment plots of selected pathways from Gene Set Enrichment Analysis of gene expression association with iPWC150 or dPWC150, respectively. Pathway names are listed at the top of each plot. The enrichment of upregulated or downregulated genes in a given pathway is shown in the enrichment plots (negative enrichment scores in the plot imply downregulation of gene expression with iPWC150 or dPWC150 levels, and vice versa).
Figure 6.
Figure 6.
Proteomics analysis of intrinsic and delta physical working capacity at a heart rate of 150 beats/min (iPWC150 and dPWC150, respectively) associations. A: partial residual plots of log2 protein expression versus iPWC150 levels for selected significantly associated proteins. The name of the protein is indicated at the top of each plot. iPWC150 values are plotted on the x-axis, and partial residual scores are plotted on the y-axis. The dashed line represents the line of best fit from linear regression analysis. B: partial residual plots for selected proteins significantly associated with dPWC150. Plots are constructed in exactly the same way as described for iPWC150. C and D: enrichment plots of selected pathways from Gene Set Enrichment Analysis of protein expression association with iPWC150 or dPWC150, respectively. Pathway names are listed at the top of each plot. The enrichment of upregulated or downregulated genes in a given pathway is depicted in the enrichment plots.
Figure 7.
Figure 7.
Metabolomics analysis of intrinsic and delta physical working capacity at a heart rate of 150 beats/min (iPWC150 and dPWC150, respectively) associations. A: partial residual plots of selected significantly associated metabolites to iPWC150. The name of the metabolite is indicated at the top of each plot. iPWC150 values are plotted on the x-axis, and partial residuals for relevant metabolites are shown on the y-axis. The dashed line represents the line of best fit from linear regression analysis. B: partial residual plots for selected metabolites significantly associated with dPWC150. Plots are constructed in exactly the same way as described for iPWC150. C: visualization of metabolites significantly associated to dPWC150 in selected Kyoto Encyclopedia of Genes and Genomes pathways. Positive associations are shown in red, and negative associations are shown in blue.
Figure 8.
Figure 8.
Phenotypic consequences of candidate intrinsic and delta physical working capacity at a heart rate of 150 beats/min (iPWC150 and dPWC150, respectively) associated gene knockouts in the Mouse Genome Informatics (MGI) database. A: genes selected from genome-wide association study (GWAS), transcriptomics, and proteomics approaches were used to query the MGI database for phenotypes arising from targeted gene knockouts or gene trap models. The left and right graphs show results for dPWC150- and iPWC150-associated genes, respectively. The number of top-level phenotypes (root phenotypes) impacted are plotted. The root phenotype categories are indicated on the y-axis, and the total number of genes observed for each category are shown on the x-axis (genes without knockout mouse data are indicated as NA). B and C: heatmap depicting genes with ≥3 root phenotypes in the MGI database. B: iPWC150-associated genes. C: dPWC150-associated genes. Genes are listed in rows, and root phenotypes are listed in columns. The presence of a root phenotype in a gene knockout is indicated by shaded cells. The source of the genes is indicated next to the gene names in parentheses [GWAS (GW), transcriptomics (G), and proteomics (P)].
Figure 9.
Figure 9.
Single-nucleotide polymorphism (SNP)-trait association analysis for cardiovascular and muscle traits. A: heatmap of gene-trait associations. Genes are shown in rows, and traits are shown in columns. Heatmaps are color coded by the maximum of the negative log P values obtained for SNP-trait associations for all SNPs mapping to a gene (P < 0.01). For multiple significant SNPs mapping to a gene, the lowest SNP-trait association P value is used to represent the gene association P value. Only genes with association to ≥5 traits (out of 29 traits) are shown in the heatmap. Left: intrinsic physical working capacity at a heart rate of 150 beats/min (iPWC150); right: delta physical working capacity at a heart rate of 150 beats/min (dPWC150). B: an example of SNP-trait association for multiple SNPs in the myocyte enhancer factor 2 C (MEF2C) gene. SNP genotypes are plotted on the x-axis and average trait values (±SE) are shown on the y-axis in each plot.
Figure 10.
Figure 10.
Circos plot summarizing results from genome-wide association study (GWAS), transcriptomic, proteomic, and phenotype analysis in intrinsic and delta physical working capacity at a heart rate of 150 beats/min (iPWC150 and dPWC150, respectively). A: iPWC150 analysis results, with all plot points referring to the negative logarithm of P values, unless otherwise indicated. From outer to inner rings: chromosome ideogram, muscle gene expression profiling in a subset of HERITAGE subjects (pale purple ring), Pascal-derived gene-level association with iPWC150 (pale green ring), plasma expression quantitative trait loci (eQTL) analysis [top light tan ring: summary data-based Mendelian randomization (SMR) P value; bottom light tan ring: eQTL study P value], skeletal muscle eQTL analysis (top pale blue ring: SMR P value; bottom pale blue ring: eQTL study P value), subcutaneous adipose tissue eQTL analysis (top light red ring: SMR P value; bottom light red ring: eQTL study P value), visceral adipose tissue eQTL analysis (top pale gray ring: SMR P value; bottom pale gray ring: eQTL study P value), number of root phenotypes impacted in knockout mouse models (multicolored square tiles), number of SNP-trait associations for cardiovascular traits (pink bars), and number of SNP-trait associations for muscle traits (blue bars). Prioritized candidate genes identified from phenotype-focused analysis are shown in red, and genes identified from eQTL-focused analysis are indicated in blue. B: analysis results for dPWC150-associated genes. Data are organized in the same way as for iPWC150.

Similar articles

Cited by

References

    1. Ross R, Blair SN, Arena R, Church TS, Despres JP, Franklin BA, Haskell WL, Kaminsky LA, Levine BD, Lavie CJ, Myers J, Niebauer J, Sallis R, Sawada SS, Sui X, Wisloff U; American Heart Association Physical Activity Committee of the Council on Lifestyle and Cardiometabolic Health; Council on Clinical Cardiology; Council on Epidemiology and Prevention, Council on Cardiovascular and Stroke Nursing; Council on Functional Genomics and Translational Biology; Stroke Council. Importance of assessing cardiorespiratory fitness in clinical practice: a case for fitness as a clinical vital sign: a scientific statement from the American Heart Association. Circulation 134: e653–e699, 2016. doi:10.1161/CIR.0000000000000461. - DOI - PubMed
    1. Bouchard C, Blair SN, Katzmarzyk PT. Less sitting, more physical activity, or higher fitness? Mayo Clin Proc 90: 1533–1540, 2015. doi:10.1016/j.mayocp.2015.08.005. - DOI - PubMed
    1. Kodama S, Saito K, Tanaka S, Maki M, Yachi Y, Asumi M, Sugawara A, Totsuka K, Shimano H, Ohashi Y, Yamada N, Sone H. Cardiorespiratory fitness as a quantitative predictor of all-cause mortality and cardiovascular events in healthy men and women: a meta-analysis. JAMA 301: 2024–2035, 2009. doi:10.1001/jama.2009.681. - DOI - PubMed
    1. Boule NG, Bouchard C, Tremblay A. Physical fitness and the metabolic syndrome in adults from the Quebec Family Study. Can J Appl Physiol 30: 140–156, 2005. doi:10.1139/h05-111. - DOI - PubMed
    1. Rheaume C, Arsenault BJ, Belanger S, Perusse L, Tremblay A, Bouchard C, Poirier P, Despres J-P. Low cardiorespiratory fitness levels and elevated blood pressure: what is the contribution of visceral adiposity? Hypertension 54: 91–97, 2009. doi:10.1161/HYPERTENSIONAHA.109.131656. - DOI - PubMed