. 2023 Aug 16:14:1212126.
doi: 10.3389/fpls.2023.1212126. eCollection 2023.

Measuring calcium content in plants using NEXAFS spectroscopy

Affiliations

Measuring calcium content in plants using NEXAFS spectroscopy

Sintu Rongpipi et al. Front Plant Sci. .

Abstract

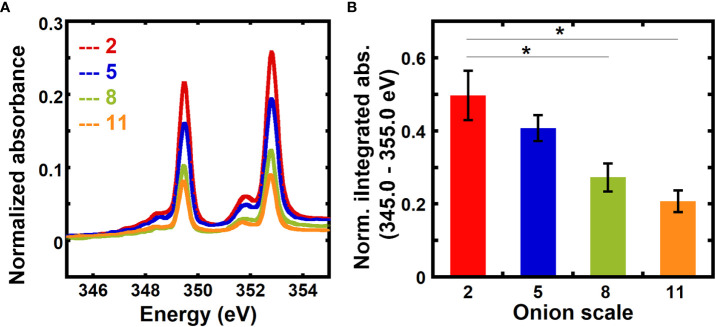
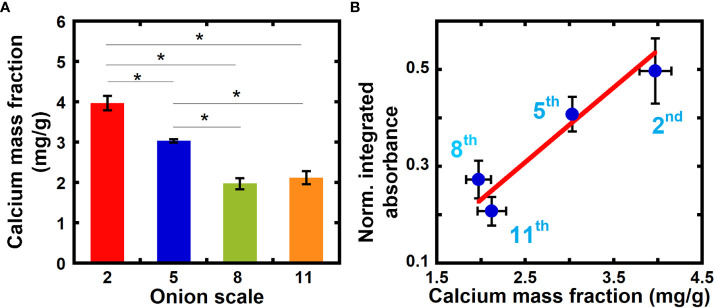
Calcium is important for the growth and development of plants. It serves crucial functions in cell wall and cell membrane structure and serves as a secondary messenger in signaling pathways relevant to nutrient and immunity responses. Thus, measuring calcium levels in plants is important for studies of plant biology and for technology development in food, agriculture, energy, and forest industries. Often, calcium in plants has been measured through techniques such as atomic absorption spectrophotometry (AAS), inductively coupled plasma-mass spectrometry (ICP-MS), and electrophysiology. These techniques, however, require large sample sizes, chemical extraction of samples or have limited spatial resolution. Here, we used near-edge X-ray absorption fine structure (NEXAFS) spectroscopy at the calcium L- and K-edges to measure the calcium to carbon mass ratio with spatial resolution in plant samples without requiring chemical extraction or large sample sizes. We demonstrate that the integrated absorbance at the calcium L-edge and the edge jump in the fluorescence yield at the calcium K-edge can be used to quantify the calcium content as the calcium mass fraction, and validate this approach with onion epidermal peels and ICP-MS. We also used NEXAFS to estimate the calcium mass ratio in hypocotyls of a model plant, Arabidopsis thaliana, which has a cell wall composition that is similar to that of onion epidermal peels. These results show that NEXAFS spectroscopy performed at the calcium edge provides an approach to quantify calcium levels within plants, which is crucial for understanding plant physiology and advancing plant-based materials.

Keywords: Arabidopsis hypocotyl; fluorescence yield NEXAFS; inductively coupled plasma mass spectrometry; onion epidermis; primary cell wall; transmission NEXAFS.


Conflict of interest statement

The authors declare that the research was conducted in the absence of any commercial or financial relationships that could be construed as a potential conflict of interest.

Figures

Figure 1
Figure 1
Calcium-treated onion epidermal cell walls show enhanced NEXAFS signal at the calcium edge. (A) Absorbance in optical density obtained from transmission near edge X-ray absorption fine structure (NEXAFS) spectroscopy near the calcium L3,2 edge of unextracted and calcium-treated onion 5th scale epidermal cell wall. (B) Absorbance at the calcium L3,2 edge of unextracted and calcium-treated onion 5th scale epidermal cell wall background corrected using the pre-edge region (340.0 eV to 342.0 eV) as described in the Methods Section and normalized by the carbon edge step jump (Absorbance325.0 eV – Absorbance270.0 eV).
Figure 2
Figure 2
Absorbance at the calcium edge varies with the age of onion scales. (A) Absorbance near the calcium L3,2 edge of unextracted onion 2nd, 5th, 8th, and 11th scale epidermal cell walls. Spectra are corrected by a linear background obtained from the pre-edge (340.0 to 342.0 eV) as described in the Methods and are normalized by the carbon edge step jump (Absorbance325.0 eV – Absorbance270.0 eV). (B) Absorbance integrated from 345 eV to 355 eV and normalized by the carbon edge jump for unextracted onion 2nd, 5th, 8th, and 11th scale epidermal cell walls. Error bars represent standard error of the mean and asterisks indicate significant differences (n ≥ 3, * p < 0.05).
Figure 3
Figure 3
Inductively Coupled Plasma Mass Spectrometry (ICP-MS) reveals higher calcium mass fraction in older onion scales when compared to younger scales. (A) Calcium mass fraction in unextracted onion 2nd, 5th, 8th, and 11th scale epidermal cell walls obtained from ICP-MS. Error bars represent standard error of the mean and asterisks indicate significant differences (n ≥ 3, * p < 0.05). (B) Correlation between normalized integrated absorbance (345.0 to 355.0 eV) and calcium mass fraction in onion epidermal cell wall obtained from ICP-MS from unextracted onion epidermal cell walls. Line denotes a weighted linear fit between the NEXAFS absorbance ratio (Y) and ICP calcium mass fraction in mg/g (X). Y = (-0.08 ± 0.11) + (0.15 ± 0.04) X, R2 = 0.91.
Figure 4
Figure 4
NEXAFS absorbance at the calcium L3,2 edge shows higher calcium mass fraction in the middle and bottom regions than in the top region of 6-day-old hypocotyls of Arabidopsis thaliana. (A) Absorbance at the calcium L3,2 edge of top, middle, and bottom regions of 6-day-old hypocotyls of Arabidopsis thaliana. Spectra are corrected by a linear background obtained from the pre-edge (340.0 to 342.0 eV) as described in the Methods and normalized by the carbon edge step jump (Absorbance325.0 eV – Absorbance270.0 eV). (B) Normalized absorbance integrated for energies 345.0 eV to 355.0 eV of top, middle, and bottom regions of hypocotyls. (C) Calcium mass fraction in different regions of hypocotyls calculated from the linear relationship between normalized integrated absorbance and calcium mass fraction from ICP-MS of onion scales. Error bars represent standard error of the mean and asterisks indicate significant differences (n = 3, * p < 0.05).
Figure 5
Figure 5
Fluorescence NEXAFS spectroscopy can be used to measure the calcium mass fraction in plant cell walls. (A) Fluorescence NEXAFS spectra of unextracted 2nd, 5th, 8th, and 11th onion scales at the calcium K-edge. Spectra are normalized by the average of intensities at energies from 4030 eV to 4040 eV (pre-edge). (B) Averaged fluorescence yield (FY) intensity for 4150 eV to 4200 eV (edge jump) normalized by the average intensity for energies 4030 eV to 4040 eV (pre-edge) and calcium mass fraction in onion cell wall obtained from ICP-MS. Line denotes a weighted linear fit between the NEXAFS fluorescence intensity ratio (Y) and the ICP calcium mass fraction (X) in mg/g. Y = (0.17 ± 0.04) + (0.81 ± 0.11) X, R2 = 0.81.

References

    1. Achkar A. J., Regier T. Z., Monkman E. J., Shen K. M., Hawthorn D. G. (2011). Determination of total x-ray absorption coefficient using non-resonant x-ray emission. Sci. Rep. 1, 182. doi: 10.1038/srep00182 - DOI - PMC - PubMed
    1. Altman N., Krzywinski M. (2017). P values and the search for significance. Nat. Methods 14, 3–4. doi: 10.1038/nmeth.4120 - DOI
    1. Baio J. E., Jaye C., Sullivan E., Rasmussen M. H., Fischer D. A., Gorb S., et al. . (2019). NEXAFS imaging to characterize the physio-chemical composition of cuticle from African Flower Scarab Eudicella gralli. Nat. Commun. 10, 4758. doi: 10.1038/s41467-019-12616-5 - DOI - PMC - PubMed
    1. Baio J. E., Spinner M., Jaye C., Fischer D. A., Gorb S. N., Weidner T. (2015). Evidence of a molecular boundary lubricant at snakeskin surfaces. J. R Soc. Interface 12, 20150817. doi: 10.1098/rsif.2015.0817 - DOI - PMC - PubMed
    1. Barnes W. J., Zelinsky E., Anderson C. T. (2022). Polygalacturonase activity promotes aberrant cell separation in the quasimodo2 mutant of Arabidopsis thaliana. Cell Surface 8, 100069. doi: 10.1016/j.tcsw.2021.100069 - DOI - PMC - PubMed