[Preprint]. 2023 Sep 10:2023.08.25.554891.
doi: 10.1101/2023.08.25.554891.

Cytoskeletal adaptation following long-term dysregulation of actomyosin in neuronal processes

Affiliations

Cytoskeletal adaptation following long-term dysregulation of actomyosin in neuronal processes

Bruno A Cisterna et al. bioRxiv. .

Update in

Abstract

Microtubules, intermediate filaments, and actin are cytoskeletal polymer networks found within the cell. While each has unique functions, all the cytoskeletal elements must work together for cellular mechanics to be fully operative. This is achieved through crosstalk mechanisms whereby the different networks influence each other through signaling pathways and direct interactions. Because crosstalk can be complex, it is possible for perturbations in one cytoskeletal element to affect the others in ways that are difficult to predict. Here we investigated how long-term changes to the actin cytoskeleton affect microtubules and intermediate filaments. Reducing F-actin or actomyosin contractility increased acetylated microtubules and intermediate filament expression, with the effect being significantly more pronounced in neuronal processes. Changes to microtubules were completely reversible if F-actin and myosin activity is restored. Moreover, the altered microtubules in neuronal processes resulting from F-actin depletion caused significant changes to microtubule-based transport, mimicking phenotypes that are linked to neurodegenerative disease. Thus, defects in actin dynamics cause a compensatory response in other cytoskeleton components which profoundly alters cellular function.


Conflict of interest statement

Declaration of Interests The authors declare no competing interests.

Figures
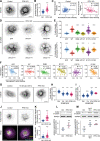
Figure 1.
Figure 1.. Reducing F-actin increases the number and acetylation of microtubules in undifferentiated CAD cells.
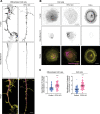
(A) Representative images of α-tubulin in Control and PNF1 KO CAD cells. Scale bar: 10 μm. (B) Quantification of mean α-tubulin intensity in (A). Data are normalized to Control and plotted as mean ± 95% confidence intervals (CI). n = 97 cells for Ctrl and n = 96 cells for PFN1 KO. (C) Correlation between F-actin and α-tubulin intensity for cells in (A). Intensities were normalized to the mean of each dataset. (D) Representative images of β-tubulin in Control cells transfected with GFP, GFP-PFN1WT, GFP-PFN1R88E, GFP-PFN1M114T, GFP-PFN1E117G or GFP-PFN1G118V. Scale bar: 10 μm. (E) Quantification of mean F-actin and β-tubulin intensity in (D). Data were normalized to PFN1WT and plotted as mean ± 95% CI. n = 120 cells for each transfection. (F) Correlation between F-actin and β-tubulin intensity for cells in (D). Intensities were normalized to the mean of each dataset. (G) Representative images of α-tubulin in Control cells, Control cells incubated with 10 nM Latrunculin A (Lat A) for 16 h, and PFN1 KO CAD cells. Scale bar: 10 μm. (H and I) Quantification of mean fluorescence intensities in (G). F-actin (H) and α-tubulin (I). Data are normalized to Control (Ctrl) and plotted as mean ± 95% CI. n = 101 cells for each condition. (J) Representative images of acetyl α-tubulin in Control and PFN1 KO cells at the top and merge of DAPI, α-tubulin, and acetyl α-tubulin at the bottom. Scale bar: 10 μm. (K) Quantification of mean fluorescence intensities in (J). acetyl α-tubulin at the top, and the acetyl α-tubulin/α-tubulin ratio at the bottom. Data are normalized to Ctrl and plotted as mean ± 95% CI. n = 96 cells for Ctrl and PFN1 KO. (L) Western blot of acetyl α-tubulin in Ctrl and PFN1 KO cells at the top and quantification of levels expression at the bottom. Individual data normalized to Ctrl and plotted as mean ± 95% CI. n = 4 biological replicates for Ctrl and PFN1 KO cells. (M) Western blot of acetyl α-tubulin in Ctrl cells, Ctrl cells incubated with 10 nM Lat A for 16 h, and PFN1 KO CAD cells at the top, and quantification of levels expression at the bottom. Individual data normalized to Ctrl and plotted as mean ± 95% CI. n = 3 biological replicates for Ctrl and PFN1 KO cells. **** indicates p < 0.0001, ** indicates p < 0.01, * indicates p = 0.03, n.s. = not significant (p > 0.05).
Figure 2.
Figure 2.. The increase in acetylated microtubules caused by PFN1 knockout is enhanced in the neuron-like processes of differentiated CAD cells and alters the active transport of organelles.
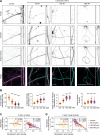
(A) Representative images of the F-actin staining in the nascent processes of differentiated CAD cells in Control and PNF1 KO cells. Scale bar: 4 μm. (B) Fluorescence quantification of (A). Mean F-actin intensity at the top and Process width at the bottom. Data are normalized to Ctrl (F-actin) and plotted as mean ± 95% CI. For F-actin quantification, n = 200 processes for Control and n = 120 for PNF1 KO. For Process width quantification, n = 200 processes for Control and n = 180 for PNF1 KO. (C) Representative images of α-tubulin in the nascent process of differentiated CAD cells in Control and PNF1 KO cells. Scale bar: 4 μm. (D) Fluorescence quantification of the processes inside the rectangles in (C). The mean fluorescence intensity of ten transversal lines to the axis of each process was plotted. n = 60 processes for Control and PNF1 KO cells. The results were compared to linescans of individual microtubules from undifferentiated cells on the same coverslip (bottom image) to estimate the number of microtubules (Mts) per process. Below the image is the average fluorescence intensity of one microtubule shown in arbitrary units (AU) ± 95% CI. (E) Representative images of the α-tubulin and acetyl α-tubulin and merge images in the processes of differentiated Control and PNF1 KO CAD cells. Scale bar: 15 μm. (F) Fluorescence quantification of (E). Mean α-tubulin intensity at the top, mean acetyl α-tubulin intensity in the middle, and acetyl α-tubulin/α-tubulin ratio at the bottom. Data are normalized to Ctrl (α-tubulin and acetyl α-tubulin) and plotted as mean ± 95% CI. n = 101 fields for each condition. (G-H) Western blot of α-tubulin (G) and acetyl α-tubulin (H) in Ctrl and PFN1 KO cells at the left and quantification of levels expression at the right. Individual data were normalized to Ctrl and plotted as mean ± 95% CI. n = 4 biological replicates for Ctrl and PFN1 KO cells. (I) Representative images of F-actin staining, TOM20, and β-tubulin immunostainings in processes of differentiated CAD cells in Control and PNF1 KO cells. Scale bar: 4 μm. (J) Kymographs from mitochondria (Mitotracker) and (L) lysosome (Lysotracker) in processes of differentiated CAD cells in Control and PNF1 KO cells. Vertical scale bar: 5 s and horizontal scale bar: 5 μm. (K and M) Kymograph quantifications. Run length at the top and Average velocity at the bottom. Data are plotted as mean ± 95% CI. For mitotracker Run length quantification, n = 7,376 for Control and n = 26,016 for PFN1 KO. For mitotracker Average velocity quantification, n = 24,441 for Control and n = 42,989 for PNF1 KO. For Lyostracker Run length quantification, n = 4,888 for Control and n = 7,534 for PFN1 KO. For Lysotracker Average velocity quantification, n = 4,937 for Control and n = 7,612 for PNF1 KO. **** indicates p < 0.0001, ** indicates p < 0.01.
Figure 3.
Figure 3.. PFN1 KO cells have elevated expression of neurofilament heavy chain.
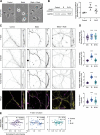
(A) Representative images of F-actin, neurofilament heavy chain (Neurofilament H), and merge images in neuron-like processes of Control and PFN1 KO CAD cells. Scale bar: 4 μm. (B) Representative images of F-actin, Neurofilament H, and merge images in Control, PFN1 KO CAD, and HeLa cells. Scale bar: 10 μm. (C) Fluorescence quantification of neuron-like processes of differentiated CAD cells (A). Mean Neurofilament H intensity. Data are normalized to Control and plotted as mean ± 95% CI. n = 73 processes for Control and PFN1 KO. (D) Fluorescence quantification of CAD cells (B). Mean Neurofilament H intensity. Data are normalized to Control and plotted as mean ± 95% CI. n = 80 cells for Control and n = 82 cells for PFN1 KO. **** indicates p < 0.0001.
Figure 4.
Figure 4.. Reducing F-actin increases the number and acetylation of microtubules in the processes of hippocampal neurons.
(A) From top to bottom, representative images of F-actin, α-tubulin, and acetyl α-tubulin, and acetyl α-tubulin/α-tubulin merge images in processes of hippocampal neurons incubated with 0, 50, 100, or 500 nM Latrunculin A (Lat A) for 16 h. Scale bar: 15 μm. (B) Quantification of the mean fluorescence intensity in (A). From top to bottom, F-actin, α-tubulin, acetyl α-tubulin, and acetyl α-tubulin/α-tubulin ratio. Data are normalized to Ctrl (F-actin, α-tubulin, and acetyl α-tubulin) and plotted as mean ± 95% CI. n = 50 fields for each condition. (C and D) Correlation between fluorescence intensities for neurites in (A). F-actin versus α-tubulin intensity (C), and F-actin versus acetyl α-tubulin (D). Intensities were normalized to the mean of each dataset. **** indicates p < 0.0001, n.s. = not significant (p > 0.05).
Figure 5.
Figure 5.. Inhibition of actomyosin contractility increases the number and acetylation of microtubules without depolymerizing F-actin.
(A) Representative bright field images of CAD cells incubated with 0, 15 μM Blebbistatin (Blebb) for 24 h, and cells incubated with Blebb for 24 h and then washed and incubated with fresh medium (Wash) for 24 h. Scale bar: 20 μm. (B) Western blot of acetyl α-tubulin in CAD cells incubated with Blebb (24 h) and Blebb (24 h) plus Wash (24 h) at the top and quantification of levels expression at the bottom. Individual data normalized to Ctrl and plotted as mean ± 95% CI. n = 4 biological replicates for each condition. (C) From top to bottom, representative images of F-actin, α-tubulin, and acetyl α-tubulin, and F-actin/α-tubulin merge images in processes of hippocampal neurons incubated with Blebb (24 h), and Blebb (24 h) plus Wash (24 h). Scale bar: 15 μm. (D) Quantification of the mean fluorescence intensity in (C). From top to bottom, F-actin, α-tubulin, acetyl α-tubulin, and acetyl α-tubulin/α-tubulin ratio. Data are normalized to Ctrl (F-actin, α-tubulin, and acetyl α-tubulin) and plotted as mean ± 95% CI. n = 50 fields for Control and Blebb (24 h) plus Wash (24 h), n = 53 fields for Blebb (24 h). (E) Correlations between F-actin and α-tubulin intensity for neurites in (C). Intensities were normalized to the mean of each dataset. **** indicates p < 0.0001, n.s. = not significant (p > 0.05).

References

    1. Chugh P., and Paluch E.K. (2018). The actin cortex at a glance. J Cell Sci 131. 10.1242/jcs.186254. - DOI - PMC - PubMed
    1. Murrell M., Oakes P.W., Lenz M., and Gardel M.L. (2015). Forcing cells into shape: the mechanics of actomyosin contractility. Nat Rev Mol Cell Biol 16, 486–498. 10.1038/nrm4012. - DOI - PMC - PubMed
    1. Vicente-Manzanares M., Ma X., Adelstein R.S., and Horwitz A.R. (2009). Non-muscle myosin II takes centre stage in cell adhesion and migration. Nat Rev Mol Cell Biol 10, 778–790. 10.1038/nrm2786. - DOI - PMC - PubMed
    1. Walker M., Rizzuto P., Godin M., and Pelling A.E. (2020). Structural and mechanical remodeling of the cytoskeleton maintains tensional homeostasis in 3D microtissues under acute dynamic stretch. Sci Rep 10, 7696. 10.1038/s41598-020-64725-7. - DOI - PMC - PubMed
    1. Pollard T.D., and Goldman R.D. (2018). Overview of the Cytoskeleton from an Evolutionary Perspective. Cold Spring Harb Perspect Biol 10. 10.1101/cshperspect.a030288. - DOI - PMC - PubMed

Publication types