[Preprint]. 2023 Aug 21:2023.08.20.553924.
doi: 10.1101/2023.08.20.553924.

Structural basis for the ligand recognition and signaling of free fatty acid receptors

Affiliations

Structural basis for the ligand recognition and signaling of free fatty acid receptors

Xuan Zhang et al. bioRxiv. .

Update in

Abstract

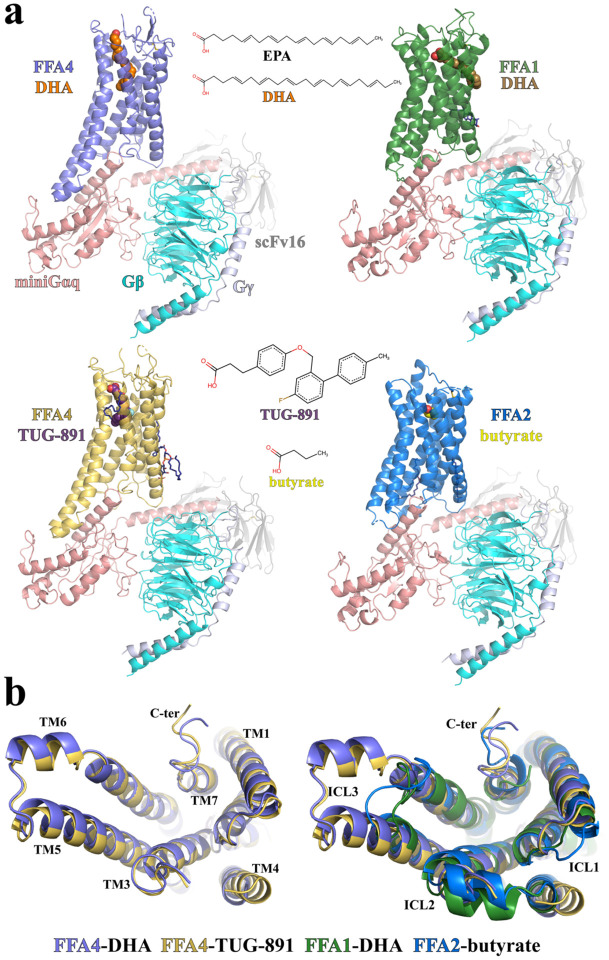
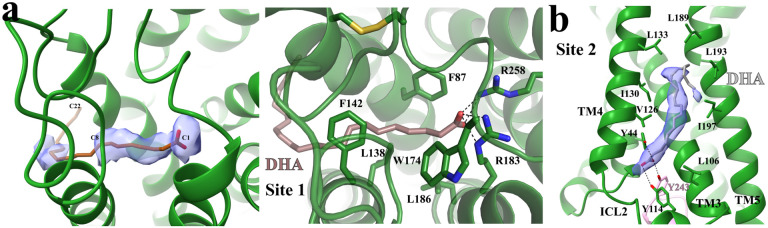
Free fatty acid receptors 1-4 (FFA1-4) are class A G protein-coupled receptors (GPCRs). FFA1-3 share substantial sequence similarity whereas FFA4 is unrelated. Despite this FFA1 and FFA4 are activated by the same range of long chain fatty acids (LCFAs) whilst FFA2 and FFA3 are instead activated by short chain fatty acids (SCFAs) generated by the intestinal microbiota. Each of FFA1, 2 and 4 are promising targets for novel drug development in metabolic and inflammatory conditions. To gain insights into the basis of ligand interactions with, and molecular mechanisms underlying activation of, FFAs by LCFAs and SCFAs, we determined the active structures of FFA1 and FFA4 bound to the polyunsaturated LCFA docosahexaenoic acid (DHA), FFA4 bound to the synthetic agonist TUG-891, as well as SCFA butyrate-bound FFA2, each complexed with an engineered heterotrimeric Gq protein (miniGq), by cryo-electron microscopy. Together with computational simulations and mutagenesis studies, we elucidated the similarities and differences in the binding modes of fatty acid ligands with varying chain lengths to their respective GPCRs. Our findings unveil distinct mechanisms of receptor activation and G protein coupling. We anticipate that these outcomes will facilitate structure-based drug development and underpin future research to understand allosteric modulation and biased signaling of this group of GPCRs.


Conflict of interest statement

Competing Interests GM is co-founder and a director of both Caldan Therapeutics (https://www.caldantherapeutics.com/) and KelticPharmaTherapeutics (https://keltic-pharma.com/) which both have interests in the development of FFA4 activators. The other authors declare no competing financial interests.

Figures

Figure 1.
Figure 1.. Overall structures of FFA1, FFA2, and FFA4 signaling complexes.
(a) Overall structures of DHA-FFA4 (slate), DHA-FFA1 (green), TUG-891-FFA4 (dark yellow) and butyrate-FFA2 (blue), each in complex with miniGq, are shown, as are the chemical structures of the bound ligands. miniGαq, Gβ and Gγ subunits are colored in salmon, cyan and light blue, respectively. ScFv16 is colored grey. The LCFA eicosapentaenoic acid (EPA) is also shown for comparison to DHA (see main text for discussion). (b) Comparison of the above structures as seen from the intracellular face.
Figure 2.
Figure 2.. Ligand binding in FFA4.
(a-d) Details of the interactions of DHA (orange) and TUG-891 (purple) with FFA4. Panel a illustrates the general positions of the two ligands whilst b highlights the closed nature of the occupied ligand binding pockets. Details of key residues of the binding pockets are highlighted for DHA (c) and TUG-891 (d, left). TUG-1197 docked into the FFA4 structure (d, right) highlights the important role of T119 and the similarity of the binding mode of TUG-1197 and TUG-891 at the bottom of the pocket. (e) Various point mutants of FFA4 generated and assessed for the ability of each of TUG-891, TUG-1197 and DHA to promote interactions with arrestin-3. See Fig. S7 for quantitation. In concert with the large-scale mutagenesis studies reported previously , this provides a comprehensive analysis of the orthosteric binding pocket of FFA4. (f) Continuous electron density observed between W198 and E204. The cryo-EM map is contoured at the level of 0.13. (g) Negative charge potential of the FFA4 binding pocket with DHA. (h) Additional length of DHA compared to EPA and the position of the DHA carboxylate above and beyond E204.
Figure 3.
Figure 3.. Potential DHA binding sites in FFA1.
(a) DHA binding in ‘Site 1’. The partial cryo-EM density map of DHA colored in light blue in the left panel is contoured at the level of 0.07. C1, C8 and C22 atoms of DHA are labeled. The occupancy of DHA C9-C22 was assigned as zero due to a lack of density. The details of interactions between DHA and FFA1 in ‘Site 1’ are shown in the right panel. DHA is colored brown. (b) Putative DHA binding in ‘Site 2’. The strong cryo-EM density map in this site is contoured at the level of 0.12. The modeled DHA molecule is colored grey. Polar interactions are shown as black dashed lines. FFA1 is colored green.
Figure 4.
Figure 4.. Recognition of butyrate by FFA2.
(a) Structural alignment of FFA2-butyrate and FFA1-DHA. The carboxylate of butyrate occupies the equivalent position to the carboxylate of DHA. (b) Details of interactions between butyrate and FFA2. (c) Overall shape of the butyrate binding pocket. (d) Differences in location of TM3 and TM4 in FFA1 and FFA2. In all panels, FFA1 and FFA2 are colored in green and blue, respectively, whilst DHA and butyrate are colored in brown and yellow, respectively. Polar interactions are shown as black dashed lines.
Figure 5.
Figure 5.
Agonist recognition of FFA4 and FFA2 probed by MD simulations. (a) FFA4-DHA, (b) FFA4-TUG-891, and (c) FFA2-butyrate complexes. A representative frame is shown with key residues forming contacts with DHA (orange) with DHA carbon-carbon double bonds numbered 1–6, TUG-891 (purple) and butyrate (yellow) in stick representation. The size and color of the residues correspond to the average strength of van der Waals and electrostatic interactions with the agonist, respectively. Water clusters observed in the MD simulations are shown in the cyan surface-like representation. The superscripts in the amino acid labels denote the Ballesteros–Weinstein generic GPCR residue numbering.
Figure 6.
Figure 6.. Activation of FFAs.
(a) Superimposition of the active DHA-bound FFA4 structure (slate) to the Alphafold predicted inactive FFA4 structure FFA4-AF (light grey) viewed from the intracellular (left) and the extracellular (right) sides. (b) Residues involved in the receptor activation at the core region of FFA4. (c) Superimposition of the active butyrate-bound FFA2 structure (blue) to the Alphafold predicted FFA2 structure FFA2-AF (dark grey) viewed from the intracellular (left) and the extracellular (right) sides. (d) Superimposition of the active DHA-bound FFA1 structure (green) to the Alphafold predicted FFA1 structure FFA1-AF (light blue) viewed from the intracellular side. Red solid and dash arrows represent conformational changes of TMs and individual residues, respectively, from the Alphafold predicted structures to the active agonist-bound structures of FFA1, FFA2, and FFA4.
Figure 7.
Figure 7.. Differences in the coupling of miniGq to FFAs.
(a) Alignment of the structures of FFA1, FFA2, and FFA4 coupled with miniGq based on the receptors. (b) Differences in the interactions between miniGαq and ICL2 of FFA1, FFA2, and FFA4. (c) Differences in the interactions between miniGαq and ICL3 of FFA1, FFA2, and FFA4. (d) Superimposition of the AlphaFold predicted structure of FFA4Long to the structure of DHA-bound FFA4 coupled with miniGq. MiniGαq, Gβ and Gγ subunits are colored in salmon, cyan and light blue, respectively. The colors of receptors and ligands are indicated in each panel.

References

    1. Ichimura A., Hirasawa A., Hara T. & Tsujimoto G. Free fatty acid receptors act as nutrient sensors to regulate energy homeostasis. Prostaglandins Other Lipid Mediat 89, 82–88, doi: 10.1016/j.prostaglandins.2009.05.003 (2009). - DOI - PubMed
    1. Hara T. et al. Role of free fatty acid receptors in the regulation of energy metabolism. Biochim Biophys Acta 1841, 1292–1300, doi: 10.1016/j.bbalip.2014.06.002 (2014). - DOI - PubMed
    1. Alvarez-Curto E. & Milligan G. Metabolism meets immunity: The role of free fatty acid receptors in the immune system. Biochem Pharmacol 114, 3–13, doi: 10.1016/j.bcp.2016.03.017 (2016). - DOI - PubMed
    1. Kimura I., Ichimura A., Ohue-Kitano R. & Igarashi M. Free Fatty Acid Receptors in Health and Disease. Physiol Rev 100, 171–210, doi: 10.1152/physrev.00041.2018 (2020). - DOI - PubMed
    1. Oh D. Y. et al. GPR120 is an omega-3 fatty acid receptor mediating potent anti-inflammatory and insulin-sensitizing effects. Cell 142, 687–698, doi: 10.1016/j.cell.2010.07.041 (2010). - DOI - PMC - PubMed

Publication types