[Preprint]. 2024 Feb 7:2023.08.20.23294350.
doi: 10.1101/2023.08.20.23294350.

Heterogeneous SARS-CoV-2 kinetics due to variable timing and intensity of immune responses

Affiliations

Heterogeneous SARS-CoV-2 kinetics due to variable timing and intensity of immune responses

Katherine Owens et al. medRxiv. .

Update in

Abstract

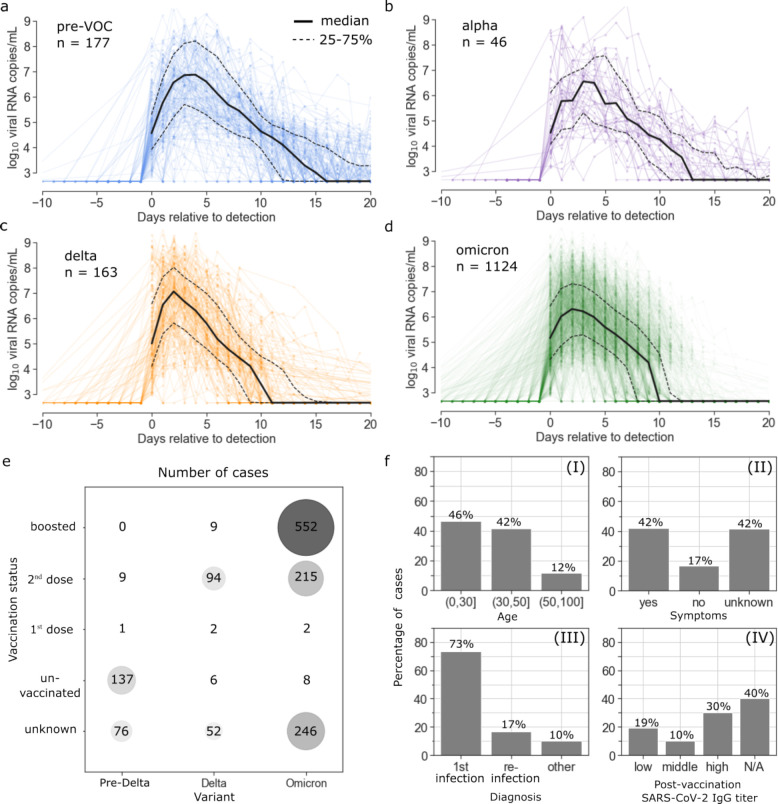
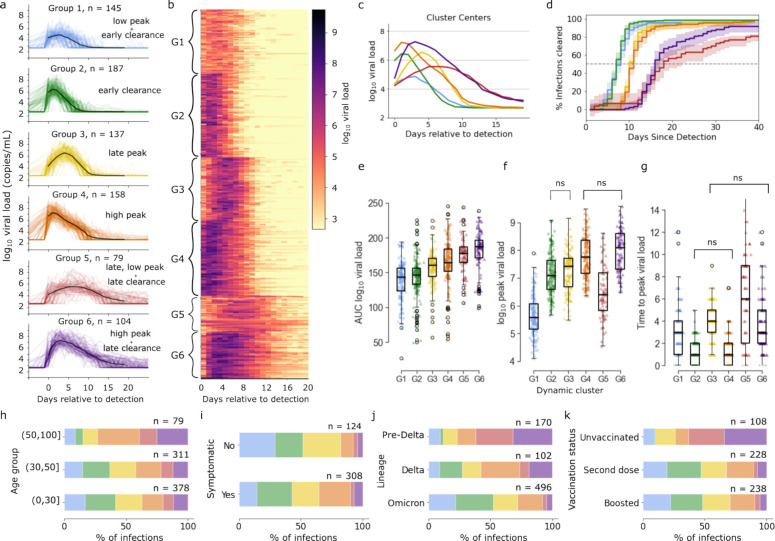
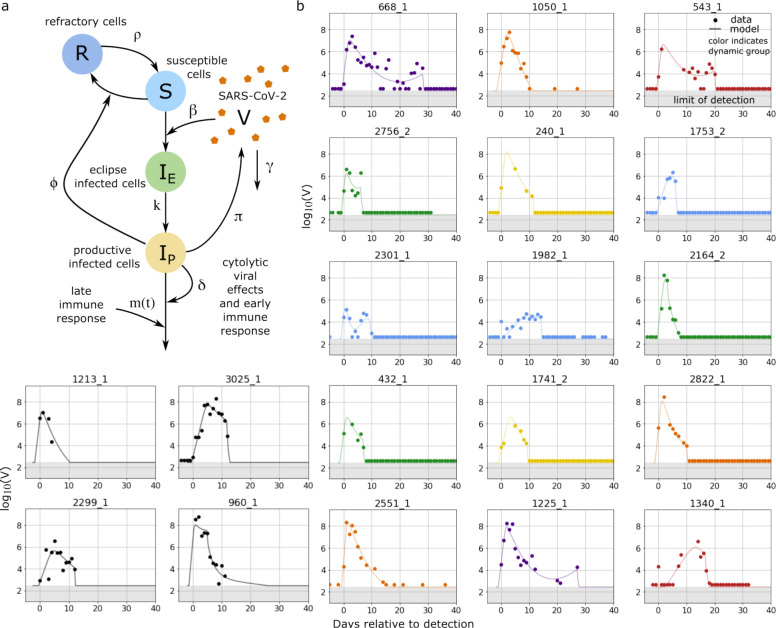
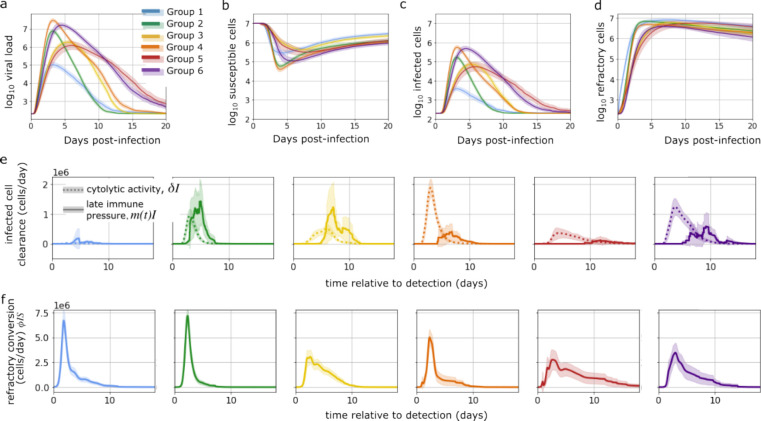
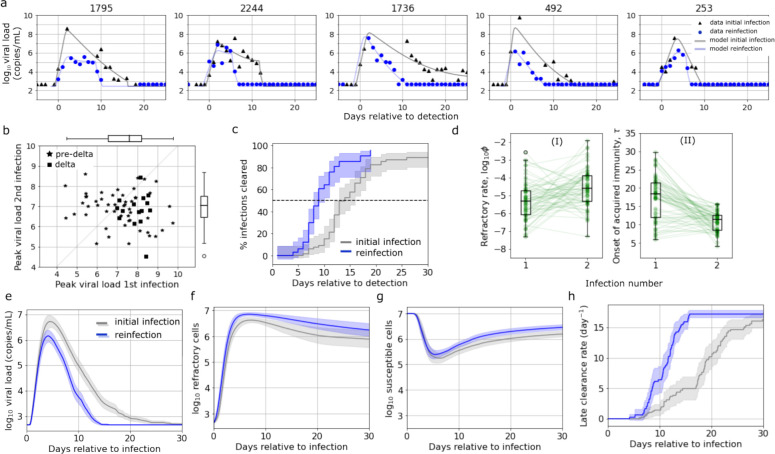
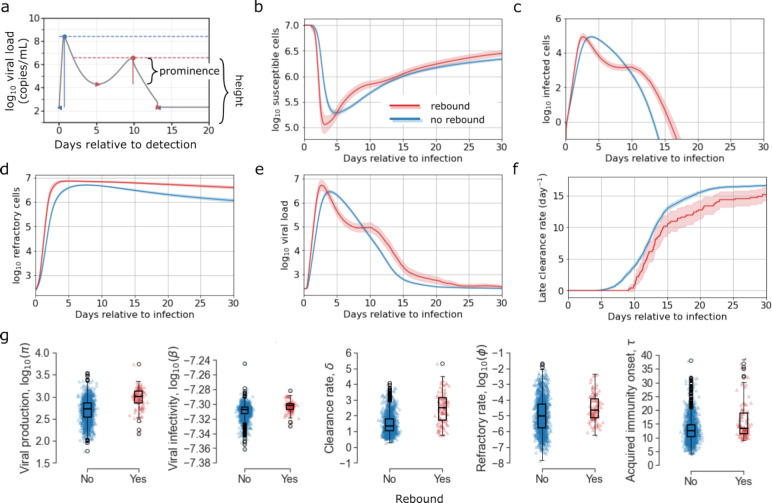
The viral kinetics of documented SARS-CoV-2 infections exhibit a high degree of inter-individual variability. We identified six distinct viral shedding patterns, which differed according to peak viral load, duration, expansion rate and clearance rate, by clustering data from 768 infections in the National Basketball Association cohort. Omicron variant infections in previously vaccinated individuals generally led to lower cumulative shedding levels of SARS-CoV-2 than other scenarios. We then developed a mechanistic mathematical model that recapitulated 1510 observed viral trajectories, including viral rebound and cases of reinfection. Lower peak viral loads were explained by a more rapid and sustained transition of susceptible cells to a refractory state during infection, as well as an earlier and more potent late, cytolytic immune response. Our results suggest that viral elimination occurs more rapidly during omicron infection, following vaccination, and following re-infection due to enhanced innate and acquired immune responses. Because viral load has been linked with COVID-19 severity and transmission risk, our model provides a framework for understanding the wide range of observed SARS-CoV-2 infection outcomes.


Figures

Figure 1:
Figure 1:. Viral kinetics by variant in the National Basketball Association cohort from June 2020-January 2022.
1510 SARS-CoV-2 infections are documented. Time series are stratified by variant with individual viral loads plotted in color, the median viral load plotted with a solid black line, and the 25th and 75th percentiles plotted in dashed black lines for (a) pre-variant of concern viruses, (b) alpha, (c) delta, and (d) omicron infections. (e) Bubble plot showing the relationship between variant of infection and vaccina2on status of the individual. Both the color and the size of the circle indicate the number of infections in each category. (f) Addi2onal informa2on about infections includes age, presence of symptoms, re-infection status, and pre-infection antibody titer following vaccina2on.
Figure 2:
Figure 2:. Distinct viral dynamic profiles in the National Basketball Association cohort from June 2020-January 2022.
(a) Trajectories stratified by cluster assignment after k-means clustering with k = 6. Cluster centers are shown in black. (b) Heat map of log viral load over time. Each row corresponds to an infection and trajectories are ordered according to cluster. (c) Cluster centers plotted on the same axis demonstrate differing peak viral loads, time of viral peak, clearance rate and time to clearance by cluster. (d) The proportion of infections cleared over time for each cluster with 95% confidence interval shaded. Boxplots of (e) area under the log10 viral load curve, (f) peak viral load for different dynamic groups, and (g) days between detection and peak viral load. According to a Mann-Whitney U-test, distinctions in the mean for all possible pairs of groups are significant (padjusted<0.05) except for the pairs marked “ns.” In the final row, stacked bar charts indicate the percentage of cases that fall into each dynamic group when cases are stratified by (h) age group, (i) symptom status, (j) infecting variant, and (k) vaccination status.
Figure 3:
Figure 3:. Mechanistic mathematical model with fits to viral loads from each cluster.
(a) Schematic of the ordinary differential equations model used to simulate SARS-CoV-2 infection with state variables indicated by capital letters, interactions indicated by arrows and parameters indicated by symbols adjacent to arrows. The model contains an early and late cytolytic immune response. (b) Examples of data from individual infections and corresponding model simulations colored according to cluster identified via k-means clustering as in Fig 2 with group 1 in blue, group 2 in green, group 3 in yellow, group 4 in orange, and group 5 in red and group 6 in purple. The black examples were not included in cluster analysis. The model also captures instances of rebound or non-monotonic clearance.
Figure 4:
Figure 4:. Mechanistic differences between dynamic groups.
Panels (a-d) show the mean viral load and cell populations in the mechanistic model for each group over time with 95% confidence interval shaded. The quantities are (a) log viral load, log10(V), (b) number of susceptible cells, log10(S),(c)numberofactiveinfectedcells,log10(I) and (d) the number of cells refractory to infection log10(R). Next, we plot the mean and standard deviation of immune pressures over time for each dynamic group. Panel (e) shows the infected cell clearance due to both constant cytolytic activity and delayed immune pressure. Panel (f) shows the conversion of susceptible cells to a refractory state.
Figure 5:
Figure 5:. Mechanistic underpinning of more rapid clearance of SARS-CoV-2 during re-infection versus initial infection.
Initial infection and re-infection were documented for 67 individuals in the NBA cohort. (a) Examples of data and model fits for infection and reinfection in the same individual (b) As measured from the data, peak viral load of reinfection against peak viral load of first infection. In all cases the variant causing the reinfection was omicron, and the variant causing the first infection was either delta or a pre-delta variant. The mean peak viral load was around 0.5 log lower for second infection (t-test sta2s2c = 2.26, p = .0254) (c) Propor2on of infections cleared for reinfection (blue) and first infections (gray) over 2me, as measured from the data. Median 2me to clearance is 7.5 vs. 12 days since detection. (d) Boxplots of es2mated individual parameters for infection and reinfection that are significantly different between the two groups (padjusted<0.05 for Mann-Whitney U-test). During re-infection with omicron, the rate that susceptible cells convert to a refractory state is higher and the onset of the late immune response occurs significantly earlier. (e) Mean viral load, (f) number of refractory cells, (g) number of suscep2ble cells, and (h) late clearance rates over time for the two groups as predicted by mechanistic model.
Figure 6:
Figure 6:. Model fitting to viral rebound in the NBA cohort.
(a) We classified infections as examples of viral rebound if there are at least two peaks in the model simulation with height of 3 logs and prominence of 0.5 log. Mean (b) number of susceptible cells, (c) number of active infected cells, (d) number of target cells that are refractory, (e) viral load, and (f) rate of late clearance as predicted by our mathematical model for rebound vs. non-rebound cases in red and blue respectively. 95% confidence interval shaded. (g) Distribution of individual parameter estimates for the rebound vs. non-rebound cases. Only those for which the mean differs significantly are displayed (padjusted<0.05) for Mann-Whitney U test).

Similar articles

References

    1. Bobrovitz N. et al. Protective effectiveness of previous SARS-CoV-2 infection and hybrid immunity against the omicron variant and severe disease: a systematic review and meta-regression. Lancet Infect Dis 23, 556–567 (2023). - PMC - PubMed
    1. van Kampen J. J. A. et al. Duration and key determinants of infectious virus shedding in hospitalized patients with coronavirus disease-2019 (COVID-19). Nat Commun 12, 267 (2021). - PMC - PubMed
    1. Wu Y. et al. Duration of viable virus shedding and polymerase chain reaction positivity of the SARS-CoV-2 Omicron variant in the upper respiratory tract: a systematic review and meta-analysis. Int J Infect Dis 129, 228–235 (2023). - PMC - PubMed
    1. Schiffer J. T. et al. Mathematical modeling of herpes simplex virus-2 suppression with pritelivir predicts trial outcomes. Sci Transl Med 8, (2016). - PMC - PubMed
    1. Goyal A., Liao L. E. & Perelson A. S. Within-host mathematical models of hepatitis B virus infection: Past, present, and future. Current Opinion in Systems Biology vol. 18 27–35 Preprint at 10.1016/j.coisb.2019.10.003 (2019). - DOI - PMC - PubMed

Publication types