

This is a preprint.
AORTA Gene: Polygenic prediction improves detection of thoracic aortic aneurysm
- PMID: 37662232
- PMCID: PMC10473783
- DOI: 10.1101/2023.08.23.23294513
AORTA Gene: Polygenic prediction improves detection of thoracic aortic aneurysm
Update in
-
The AORTA Gene score for detection and risk stratification of ascending aortic dilation.Eur Heart J. 2024 Oct 21;45(40):4318-4332. doi: 10.1093/eurheartj/ehae474. Eur Heart J. 2024. PMID: 39132911 Free PMC article.
Abstract
Background: Thoracic aortic disease is an important cause of morbidity and mortality in the US, and aortic diameter is a heritable contributor to risk. Could a polygenic prediction of ascending aortic diameter improve detection of aortic aneurysm?
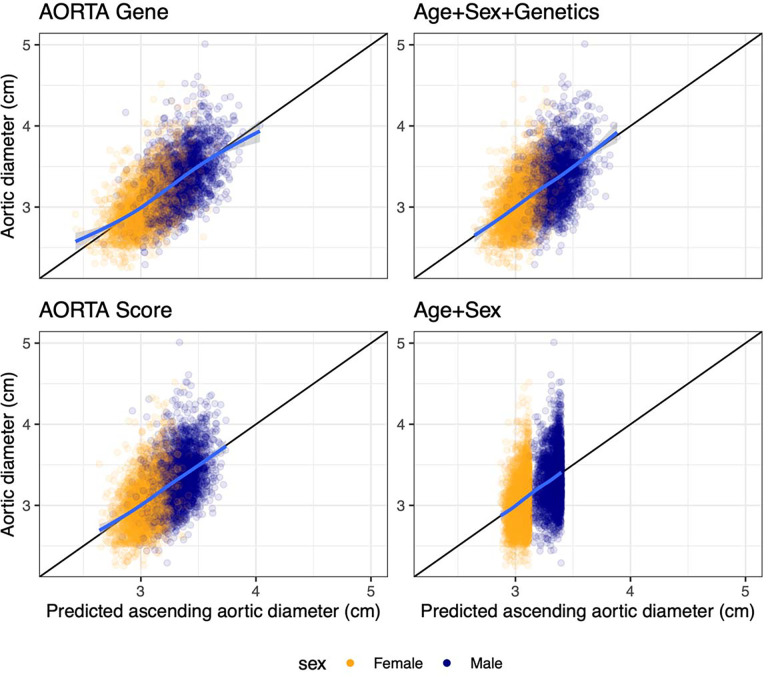
Methods: Deep learning was used to measure ascending thoracic aortic diameter in 49,939 UK Biobank participants. A genome-wide association study (GWAS) was conducted in 39,524 participants and leveraged to build a 1.1 million-variant polygenic score with PRScs-auto. Aortic diameter prediction models were built with the polygenic score ("AORTA Gene") and without it. The models were tested in a held-out set of 4,962 UK Biobank participants and externally validated in 5,469 participants from Mass General Brigham Biobank (MGB), 1,298 from the Framingham Heart Study (FHS), and 610 participants from All of Us.
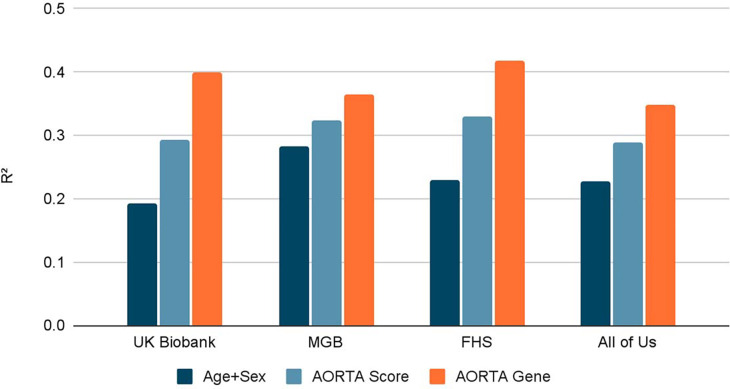
Results: In each test set, the AORTA Gene model explained more of the variance in thoracic aortic diameter compared to clinical factors alone: 39.9% (95% CI 37.8-42.0%) vs 29.2% (95% CI 27.1-31.4%) in UK Biobank, 36.5% (95% CI 34.4-38.5%) vs 32.5% (95% CI 30.4-34.5%) in MGB, 41.8% (95% CI 37.7-45.9%) vs 33.0% (95% CI 28.9-37.2%) in FHS, and 34.9% (95% CI 28.8-41.0%) vs 28.9% (95% CI 22.9-35.0%) in All of Us. AORTA Gene had a greater AUROC for identifying diameter ≥4cm in each test set: 0.834 vs 0.765 (P=7.3E-10) in UK Biobank, 0.808 vs 0.767 in MGB (P=4.5E-12), 0.856 vs 0.818 in FHS (P=8.5E-05), and 0.827 vs 0.791 (P=7.8E-03) in All of Us.
Conclusions: Genetic information improved estimation of thoracic aortic diameter when added to clinical risk factors. Larger and more diverse cohorts will be needed to develop more powerful and equitable scores.
Keywords: All of Us; Ascending aorta; Framingham Heart Study; Mass General Brigham; UK Biobank; polygenic score.
Figures


References
-
- Howard DPJ, Banerjee A, Fairhead JF, Perkins J, Silver LE, Rothwell PM, Oxford Vascular Study. Population-based study of incidence and outcome of acute aortic dissection and premorbid risk factor control: 10-year results from the Oxford Vascular Study. Circulation. 2013;127:2031–2037. - PMC - PubMed
-
- Yamaguchi T, Nakai M, Yano T, Matsuyama M, Yoshino H, Miyamoto Y, Sumita Y, Matsuda H, Inoue Y, Okita Y, Minatoya K, Ueda Y, Ogino H. Population-based incidence and outcomes of acute aortic dissection in Japan. European Heart Journal Acute Cardiovascular Care. 2021;10:701–709. - PubMed
-
- Kim JB, Spotnitz M, Lindsay ME, MacGillivray TE, Isselbacher EM, Sundt TM. Risk of Aortic Dissection in the Moderately Dilated Ascending Aorta. J Am Coll Cardiol. 2016;68:1209–1219. - PubMed
-
- Solomon MD, Leong T, Sung SH, Lee C, Allen JG, Huh J, LaPunzina P, Lee H, Mason D, Melikian V, Pellegrini D, Scoville D, Sheikh AY, Mendoza D, Naderi S, Sheridan A, Hu X, Cirimele W, Gisslow A, Leung S, Padilla K, Bloom M, Chung J, Topic A, Vafaei P, Chang R, Miller DC, Liang DH, Go AS, Kaiser Permanente Northern California Center for Thoracic Aortic Disease. Association of Thoracic Aortic Aneurysm Size With Long-term Patient Outcomes: The KP-TAA Study. JAMA Cardiology [Internet]. 2022. [cited 2022 Oct 11];Available from: 10.1001/jamacardio.2022.3305 - DOI - PMC - PubMed
-
- Pape LA, Tsai TT, Isselbacher EM, Oh JK, O’gara PT, Evangelista A, Fattori R, Meinhardt G, Trimarchi S, Bossone E, Suzuki T, Cooper JV, Froehlich JB, Nienaber CA, Eagle KA, International Registry of Acute Aortic Dissection (IRAD) Investigators. Aortic diameter >or = 5.5 cm is not a good predictor of type A aortic dissection: observations from the International Registry of Acute Aortic Dissection (IRAD). Circulation. 2007;116:1120–1127. - PubMed
Publication types
Grants and funding
- K08 HL159346/HL/NHLBI NIH HHS/United States
- U01 AG068221/AG/NIA NIH HHS/United States
- OT2 OD026556/OD/NIH HHS/United States
- R01 HL141434/HL/NHLBI NIH HHS/United States
- OT2 OD025315/OD/NIH HHS/United States
- OT2 OD026551/OD/NIH HHS/United States
- U24 OD023121/OD/NIH HHS/United States
- OT2 OD026552/OD/NIH HHS/United States
- OT2 OD025337/OD/NIH HHS/United States
- OT2 OD025277/OD/NIH HHS/United States
- OT2 OD026555/OD/NIH HHS/United States
- OT2 OD026550/OD/NIH HHS/United States
- OT2 OD026553/OD/NIH HHS/United States
- OT2 OD023205/OD/NIH HHS/United States
- OT2 OD025276/OD/NIH HHS/United States
- 75N92019D00031/HL/NHLBI NIH HHS/United States
- OT2 OD026554/OD/NIH HHS/United States
- U24 OD023163/OD/NIH HHS/United States
- OT2 OD023206/OD/NIH HHS/United States
- U24 OD023176/OD/NIH HHS/United States
- OT2 OD026548/OD/NIH HHS/United States
- R01 HL092577/HL/NHLBI NIH HHS/United States
- U2C OD023196/OD/NIH HHS/United States
- OT2 OD026549/OD/NIH HHS/United States
- U54 HL120163/HL/NHLBI NIH HHS/United States
- R01 HL128914/HL/NHLBI NIH HHS/United States
- R01 HL157635/HL/NHLBI NIH HHS/United States
- OT2 OD026557/OD/NIH HHS/United States
LinkOut - more resources
Full Text Sources