[Preprint]. 2023 Aug 22:2023.08.22.554238.
doi: 10.1101/2023.08.22.554238.

Reprogramming of breast tumor-associated macrophages with modulation of arginine metabolism

Affiliations

Reprogramming of breast tumor-associated macrophages with modulation of arginine metabolism

Veani Fernando et al. bioRxiv. .

Update in

Abstract

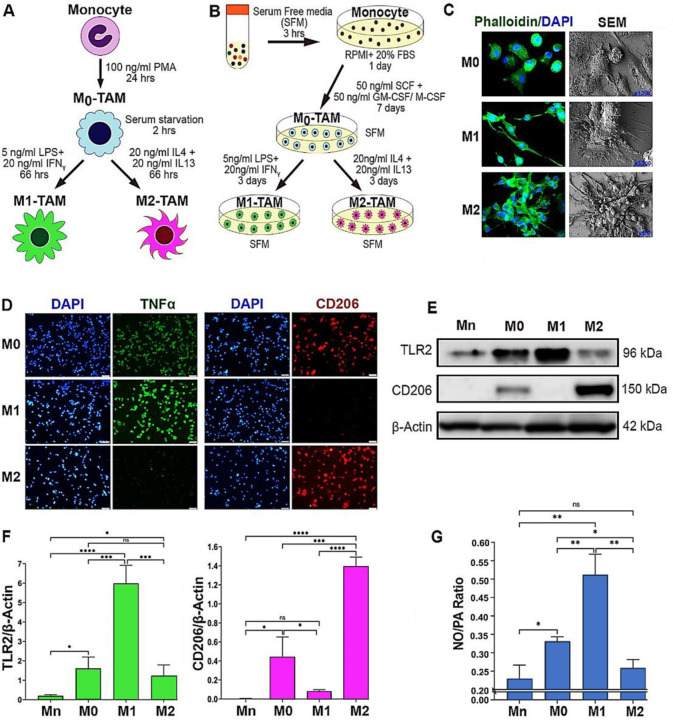
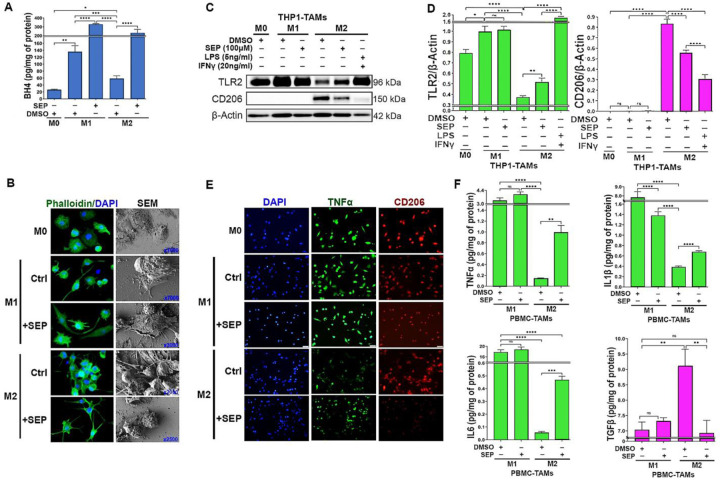
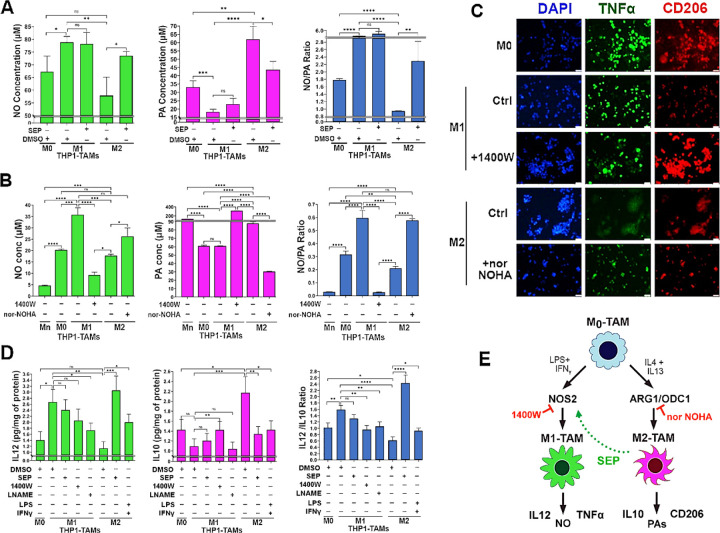
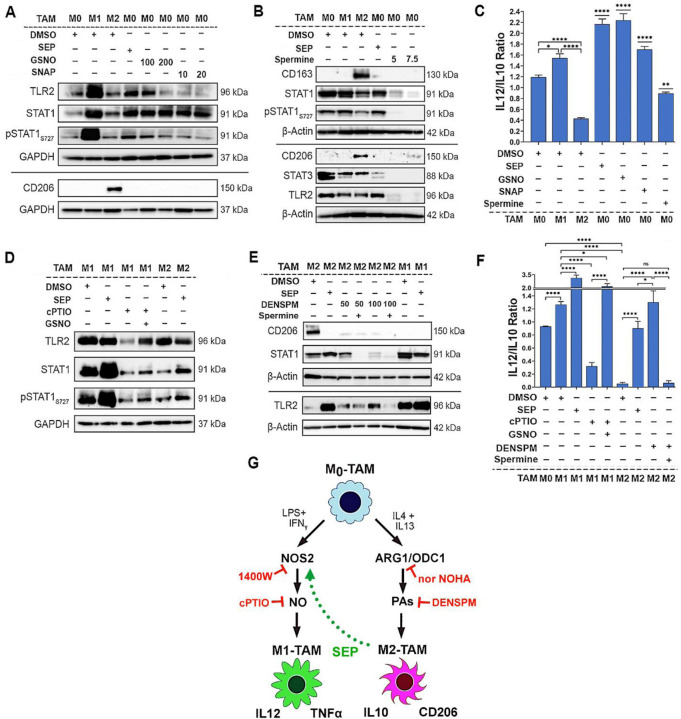
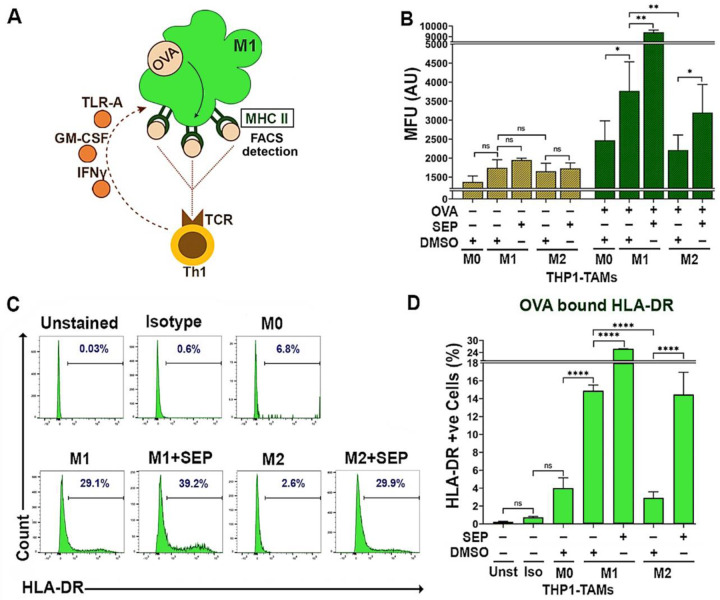
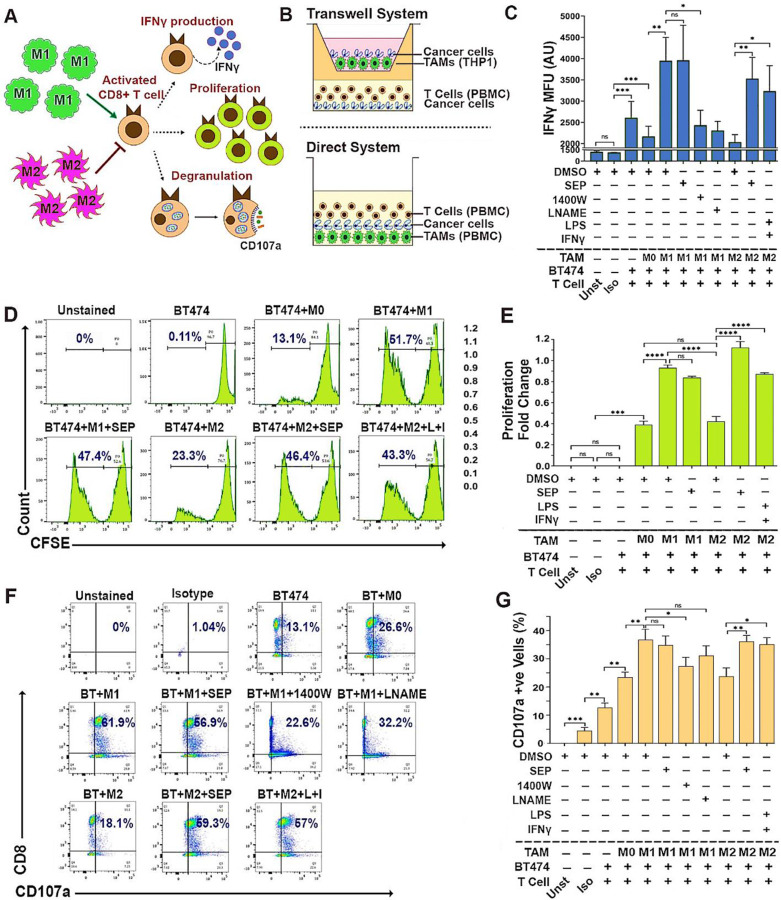
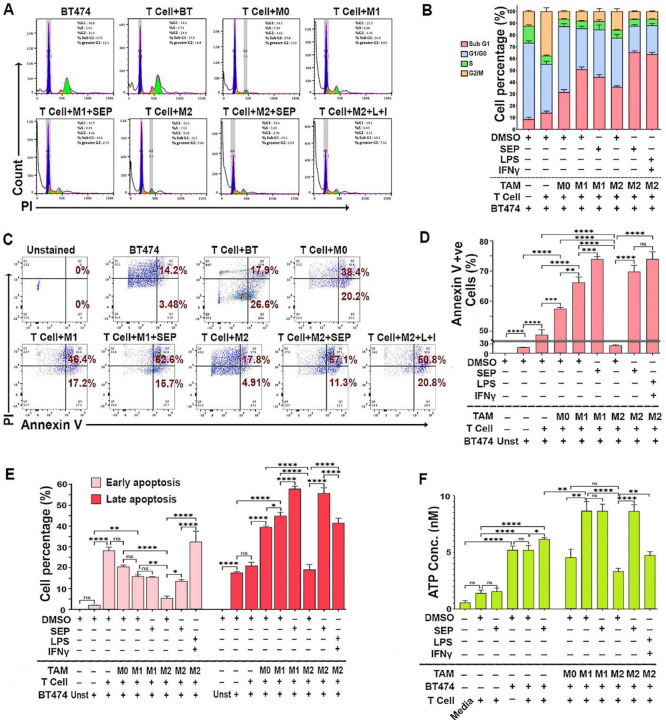
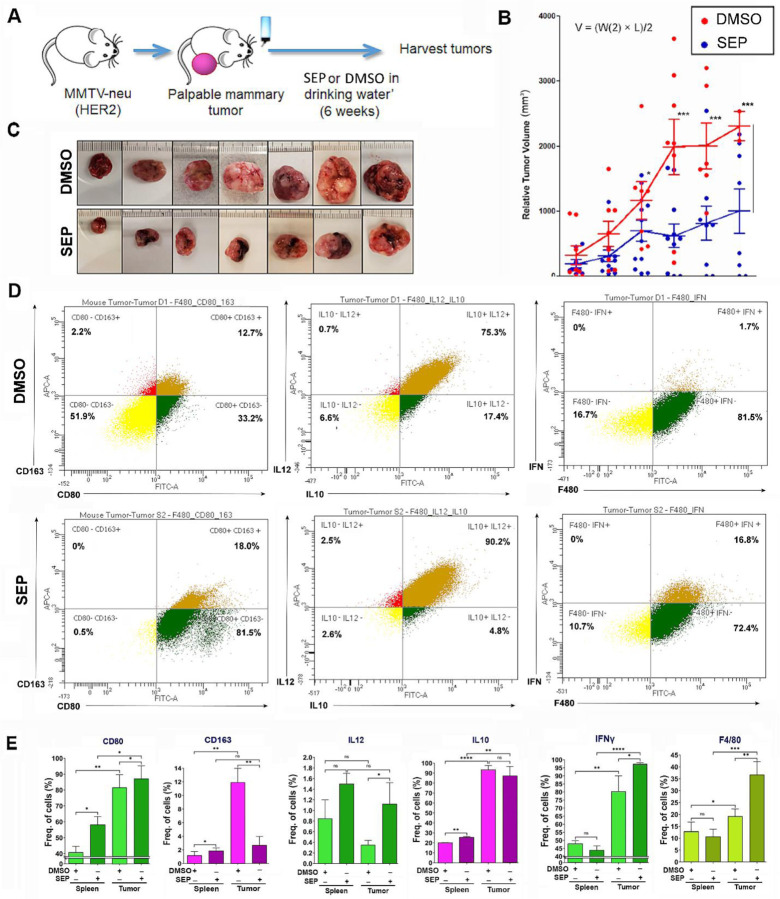
HER2+ breast tumors have abundant immune-suppressive cells, including M2-type tumor associated macrophages (TAMs). While TAMs consist of the immune-stimulatory M1-type and immune-suppressive M2-type, M1/M2-TAM ratio is reduced in immune-suppressive tumors, contributing to their immunotherapy refractoriness. M1 vs. M2-TAM formation depends on differential arginine metabolism, where M1-TAMs convert arginine to nitric oxide (NO) and M2-TAMs convert arginine to polyamines (PAs). We hypothesize that such distinct arginine metabolism in M1- vs M2-TAMs is attributed to different availability of BH4 (NO synthase cofactor) and that its replenishment would reprogram M2-TAMs to M1-TAMs. Recently, we reported that sepiapterin (SEP), the endogenous BH4 precursor, elevates the expression of M1-TAM markers within HER2+ tumors. Here, we show that SEP restores BH4 levels in M2-TAMs, which then redirects arginine metabolism to NO synthesis and converts M2-TAMs to M1-TAMs. The reprogrammed TAMs exhibit full-fledged capabilities of antigen presentation and induction of effector T cells to trigger immunogenic cell death of HER2+ cancer cells. This study substantiates the utility of SEP in metabolic shift of HER2+ breast tumor microenvironment as a novel immunotherapeutic strategy.

Keywords: HER2; breast cancer; nitric oxide; polyamines; tetrahydrobiopterin.


Conflict of interest statement

Disclosure and competing interests statement The authors declare that they have no conflict of interest.

Figures

Figure 1:
Figure 1:. M1 vs. M2 TAMs are distinguished by the preferential production of NO vs. PAs through differential arginine metabolism.
A, B) Schematic representation of the polarization protocols of TAMs derived from THP–1 human monocytic cell line (A) & PBMC (B). THP–1 monocyte (Mn) was treated with phorbol myristate aetate (PMA) for differentiation to inactive macrophages (M0). PBMC-derived Mn was treated with SCF+GM-CSF (leading to M1) or M-CSF (leading to M2) for differentiation to M0. For M1 polarization, M0–TAMs were treated with LPS and IFNγ; for M2 polarization, M0–TAMs were treated with IL4 plus IL13. C) Representative images of phalloidin staining (left, n=3) & scanning electron microscopy (SEM, right, n=3) imaging of M0, M1 and M2-TAMs. Green: phalloidin; blue: DAPI. SEM images are shown at different magnifications; M0: x1300), M1: x3700), and M2: x500. D) Immunofluorescence images of TAM subsets (n=3) stained for M1 (green, TNFα) vs. M2 markers (red, CD206) and counterstained with DAPI (blue). Scale bars: 50μm. E) Western blot analysis (n=3) of THP–1 derived Mn, M0, M1 and M2-TAMs for the expression of TLR2 (M1 marker) vs. CD206 (M2 marker). β–Actin was used as the internal loading control. F) Quantification of the western results of the expression of TLR2 (left) and CD206 (right) normalized against β–Actin and presented as fold differences. G) NO to PA ratios in THP–1 derived TAM subsets (n = 6) measured with ELISA. Error bars: ±standard errors of mean (SEM). *, p ≤ 0.05; **, p ≤ 0.01; ***, p ≤ 0.001; ****, p ≤ 0.0001 and ns, p >0.05.
Figure 2:
Figure 2:. SEP elevates M1 marker expression in M2 TAMs.
A) Levels of BH4 produced by THP–1 derived M0, M1, and M2-TAMs after treated with vehicle (DMSO) or SEP (100μM) for 3 days (n=6). BH4 levels were measured with ELISA and normalized against the total protein levels. One way ANOVA with post hoc test (Tukey test) was performed to measure the significance of mean difference between treatment groups. B) Phalloidin staining and SEM imaging of THP–1 derived M0, M1 and M2-TAMs treated as in A) (n=3). SEM images are shown at different magnifications. C) Western blot analysis of TAM subsets treated with vehicle or SEP as in A), and β–Actin was used as the internal loading control (n=5). D) Quantification of the western results based on the expression of TLR2 (M1 marker) vs. CD206 (M2 marker) normalized against β–Actin signal and presented as fold differences. E) Immunofluorescence imaging of THP–1 derived TAMs after treatments as shown above and stained for M1 marker (green, TNFα) vs. M2 marker (red, CD206) and counterstained with DAPI (blue)(n=3). F) The levels of secreted cytokines, Type 1: TNFα (top left), IL1β (top right), and IL6 (bottom left) vs. Type 2: TGFβ (bottom right), for M1 vs. M2 TAMs treated with vehicle vs. SEP (n=6) measured with ELISA. Error bars: ±SEM. *, p ≤ 0.05; **, p ≤ 0.01; ***, p ≤ 0.001; ****, p ≤ 0.0001 and ns, p >0.05.
Figure 3:
Figure 3:. SEP redirects arginine metabolism from PA to NO synthesis in M2 TAMs, while rendering them M1-TAM phenotype.
A) Levels of NO (left), PAs (middle) and NO/PA ratios for THP–1 derived M0, M1 and M2-TAMs after treated with DMSO (vehicle) and SEP (100 μM) for 3 days (n = 5). B) One way ANOVA with post hoc Tukey test was used for statistical analysis. Error bars: ±SEM. GraphPad Prism Version 9.5.1. was used to perform all statistical analyses. B) Levels of NO (left), PAs (middle) and NO/PA ratios for THP–1 derived Mn, M0, M1 and M2-TAMs after treated with DMSO (vehicle), NOS2 inhibitor, 1400W (50 μM), or Arginase 1 (Ang1) inhibitor, nor NOHA (50 μM) for 3 days (n = 5). Note the significant decrease of NO level in 1400W-treated M1-TAMs and significant decrease of PA level in nor-NOHA-treated M2-TAMs. C) Immune fluorescence imaging of THP–1 derived M0, M1 and M2-TAMs stained for M1 marker (green, TNFα) vs. M2 marker (red, CD206) and counterstained with DAPI (blue). M1-TAMs were treated with DMSO (Control: Ctrl) or NOS2 inhibitor (100μM 1400W), whereas M2-TAMs were treated with DMSO (Ctrl) or ARG1 inhibitor (50μM nor-NOHA) for 3 days (n=3). D) Levels of Type 1 cytokine IL12 (left) and Type 2 cytokine IL10 (middle) as well as IL12/IL10 ratios for THP-1 derived TAM subsets measured with ELISA. M1-TAMs were treated with DMSO or NOS inhibitors, 1400W (50 μM) and LNAME (2.5 mM). M2-TAMs were treated with DMSO, SEP (100 μM) or positive control LPS (5ng/ml) plus IFNγ (20ng/ml) for 3 days (n=6). The cytokine levels were measured using ELISA and normalized against the total protein levels. Error bars: ±SEM. *, p ≤ 0.05; **, p ≤ 0.01; ***, p ≤ 0.001; ****, p ≤ 0.0001 and ns, p >0.05. E) Working scheme for the induction of M1 vs. M2 polarization by activation of NOS2 vs. ARG1/OCD1 pathways and M2-to-M1 reprogramming by SEP.
Figure 4:
Figure 4:. Arginine metabolites, nitric Oxide and polyamines, drive M1 and M2-TAM polarization, respectively.
A) Western blot analysis on M1 markers: TLR2, STAT1 and pSTAT1S727 vs. M2 marker: CD206 in THP1–derived M0-TAMs treated with DMSO (vehicle control), SEP (100 μM), or NO donor (GSNO [100 μM, 200 μM] and SNAP [10 μM, 20 μM]) in comparison to M1- and M2-TAMs (n=4). GAPDH was used as the internal loading control. B) Western blot analysis on M1 markers: STAT1, and TLR2, vs. M2 marker: CD206 in M0-TAMs treated with DMSO (vehicle control), SEP (100 μM), or PAs (5 or 7.5 mM Spermine) in comparison to M1- and M2-TAMs (n=4). β–Actin was used as the internal loading control. (For quantification of A and B, see Appendix Figures S1.) C) The ratios of IL12/IL10 secreted by THP–1 derived M0-TAMs treated with DMSO, SEP, NO donors and PAs in comparison to M1- and M2-TAMs. D) Western blot analysis on M1 markers: TLR2, STAT1 and pSTAT1S727 in M1-TAMs treated with NO scavenger (50 μM cPTIO) with and without NO donor (100 μM GSNO) and M2-TAMs treated with DMSO or SEP (n=4). GAPDH was used as the internal loading control. E) Western blot analysis on M1 markers: TLR2, STAT1 and pSTAT1S727 vs. M2 marker: CD206 in THP1-derived M2-TAMs treated with PA analog (50 μM, 100 μM DENSPM) and PAs (5 mM Spermine) and M1-TAMs treated with DMSO or SEP (n=4). β–Actin was used as the internal loading control. (For quantification of D and E see Appendix Figures S2.) F) The ratios of IL12/IL10 secreted by THP–1 derived M1- and M2-TAMs with treatment combinations shown in D) and E). Error bars represent ± SEM. GraphPad Prism Version 9.5.1. was used to perform all statistical analyses. *, p ≤ 0.05; **, p ≤ 0.01; ***, p ≤ 0.001; ****, p ≤ 0.0001 and ns, p >0.05. G) Scheme for the induction of M1 vs. M2 polarization by NO vs. PAs and M2-to-M1 reprogramming by SEP.
Figure 5:
Figure 5:. M2-TAMs treated with SEP show increased antigen presentation activities.
A) The scheme of measuring antigen presentation activities of TAMs. Once M1 macrophage is pulsed with OVA323–339 peptide, it phagocytoses and presents the epitope through the cell surface MHC II. The level of cell surface MHC II, representing antigen presentation activity, is detected by FACS. (The presented epitope is then recognized by T cell receptor (TCR) on Th1 T cells to trigger immunogenic responses.) B) Mean fluorescence intensity (MFU) of cell surface HLA-DR (MHC II) after pulsed with or without OVA323–339 peptide (20μg/ml for 2 hours)) on THP–1 derived M0, M1 and M2-TAMs pre-treated with DMSO or 100 μM SEP. Two sample t-tests (unpaired) were performed for pairwise comparison. C, D) Percentages of TAM subsets treated as in B) that expressed cell surface HLA-DR (bound by OVA peptide) presented as histograms (C) and quantification (D). Unstained (Unst) and isotype (Iso) controls were used (n=5). Error bars: ± SEM. *, p ≤ 0.05; **, p ≤ 0.01; ***, p ≤ 0.001; ****, p ≤ 0.0001 and ns, p >0.05.
Figure 6:
Figure 6:. SEP treated M2-TAMs activate cytotoxic T cells.
A) Scheme of detection methods for activation of cytotoxic CD8+ T cells, based on IFNγ production, proliferation, and degranulation indicated by cell surface CD107a expression. B) Schemes of the TAM-T cell-cancer cell co-cultures (2:2:1 ratio) using Transwell system (top) and direct system (bottom). (Top) THP–1 derived TAMs, PBMC derived T cells, and BT474 breast cancer cells co-cultured using Transwell. (Bottom) PBMC derived autologous TAMs and T cells were directly co-cultured with BT474 cells. C) FACS-detected IFNγ expression levels in CD8+ T cells after co-cultured with BT474 cells and PBMC derived TAM subsets pretreated with DMSO or 100 μM SEP (n=6). Positive control: M2-TAMs treated with LPS and IFNγ. Negative control: M1-TAMs treated with 1400W and LNAME. T cells were gated for CD3 and CD8 expression. IFNγ levels are shown as MFU. D) Detection of proliferation of cytotoxic T cells co-cultured as in C) based on the dilution of CFSE signals through cell doubling (n=6). Percentages of proliferating T cells (CFSE low) are highlighted in the histogram. E) Cytotoxic T cell proliferation shown as fold change of proliferating cells (CFSE low) with respect to non-proliferating cells (CFSE high). F) Cell surface CD107a (degranulation marker) expression on cytotoxic T cells directly co-cultured as in B). Percentages of CD107a+ CD8+ cells are shown in the plots. G) Quantification of the percentages of CD107a+ CD8+ cells in co-cultures. Error bars: ± SEM. *, p ≤ 0.05; **, p ≤ 0.01; ***, p ≤ 0.001; ****, p ≤ 0.0001 and ns, p >0.05.
Figure 7:
Figure 7:. SEP treated M2-TAMs induce T cells to kill HER2+ breast cancer cells.
A) Cell cycle analyses of BT474 cancer cells (CMFDA-labeled) co-cultured with PBMC derived TAM subsets, pretreated with DMSO (vehicle), SEP (100 μM), or LPS + IFNγ (positive control), along with T cells. Adherent cells (TAMs+BT474 cells) were dissociated, fixed in 70% ethanol for 3 hours, and stained with PI. BT474 cells were gated based on CMFDA signal and analyzed for the PI-stained DNA contents. B) Cell cycle distribution of BT474 cells co-cultured with TAMs and T cells as in A). Note the dramatic increase in SubG1 population in co-cultured with SEP treated M2-TAMs. (For quantification of Sub-G1 and G1/G0 populations, see Appendix Figures S3A.) C) Annexin V/PI staining of co-cultured BT474 cells to measure cell deaths (n=6). Viable cells: Annexin V-ve, PI-ve; early apoptotic cells: Annexin V +ve, PI-ve; late apoptotic cells: Annexin V +ve, PI +ve; and necrotic cells: Annexin V -ve, PI +ve. D) Percentage of total apoptotic (Annexin V +ve) cancer cells. E) Early and late apoptotic cancer cells. F) Levels of ATP secreted by BT474 cells in co-cultures. Secretion of ATP indicates immunogenic cell death of cancer cells. Note the dramatic increase in ATP secretion by cancer cells in co-culture with SEP-pretreated M2 TAMs. Error bars: ± SEM. *, p ≤ 0.05; **, p ≤ 0.01; ***, p ≤ 0.001; ****, p ≤ 0.0001 and ns, p >0.05.
Figure 8:
Figure 8:. Oral SEP treatment promotes the immunogenicity of TAMs and suppresses the growth of spontaneous MMTV-neu (HER2) mammary tumors.
A) Scheme of the experiment where MMTV-neu (unactivated) mice were allowed to develop palpable mammary tumors (tumor latency of 6–14 months) and given DMSO or SEP (10 mg/kg) in drinking water ad libitum for 6 weeks (n=7). B) Tumor growth was measured by caliper and the volume was determined (V = (W(2) x L)/2). C) Pictures of exercised tumors. D) Exercised tumors were analyzed for M1- vs. M2-TAM profiles (CD80 vs. CD163; IL12 vs. IL10; and IFNγ) by FACS. (Top row) DMSO-treated tumors; (bottom row) SEP-treated tumors. E) Quantification of the expression of M1- vs. M2-TAM markers as in D) in exercised tumors (n=6) in comparison to spleens (n=6) of the same animals.

Similar articles

References

    1. Antoniades C., Cunnington C., Antonopoulos A., Neville M., Margaritis M., Demosthenous M., Bendall J., Hale A., Cerrato R., Tousoulis D., Bakogiannis C., Marinou K., Toutouza M., Vlachopoulos C., Leeson P., Stefanadis C., Karpe F. and Channon K.M. (2011) Induction of Vascular GTP-Cyclohydrolase I and Endogenous Tetrahydrobiopterin Synthesis Protect Against Inflammation-Induced Endothelial Dysfunction in Human Atherosclerosis. Circulation, 124, 1860–1870. - PMC - PubMed
    1. Ayoub N.M., Al-Shami K.M. and Yaghan R.J. (2019) Immunotherapy for HER2-positive breast cancer: recent advances and combination therapeutic approaches. Breast Cancer (Dove Med Press), 11, 53–69. - PMC - PubMed
    1. Bailey J.D., Diotallevi M., Nicol T., McNeill E., Shaw A., Chuaiphichai S., Hale A., Starr A., Nandi M., Stylianou E., McShane H., Davis S., Fischer R., Kessler B.M., McCullagh J., Channon K.M. and Crabtree M.J. (2019) Nitric Oxide Modulates Metabolic Remodeling in Inflammatory Macrophages through TCA Cycle Regulation and Itaconate Accumulation. Cell Rep, 28, 218–230.e217. - PMC - PubMed
    1. Barker R.N., Erwig Lp Fau - Hill K.S.K., Hill Ks Fau - Devine A., Devine A Fau - Pearce W.P., Pearce Wp Fau - Rees A.J and Rees A.J. (2002) Antigen presentation by macrophages is enhanced by the uptake of necrotic but not apoptotic cells. - PMC - PubMed
    1. Bertani F.R., Mozetic P., Fioramonti M., Iuliani M., Ribelli G., Pantano F., Santini D., Tonini G., Trombetta M., Businaro L., Selci S. and Rainer A. (2017) Classification of M1/M2-polarized human macrophages by label-free hyperspectral reflectance confocal microscopy and multivariate analysis. Scientific Reports, 7, 8965. - PMC - PubMed

Publication types