[Preprint]. 2023 Aug 24:2023.08.22.554309.
doi: 10.1101/2023.08.22.554309.

Mycobacterium tuberculosis response to cholesterol is integrated with environmental pH and potassium levels via a lipid utilization regulator

Affiliations

Mycobacterium tuberculosis response to cholesterol is integrated with environmental pH and potassium levels via a lipid utilization regulator

Yue Chen et al. bioRxiv. .

Update in

Abstract

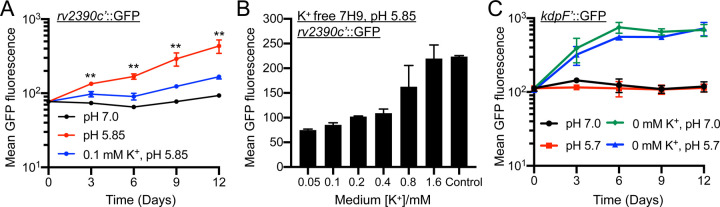
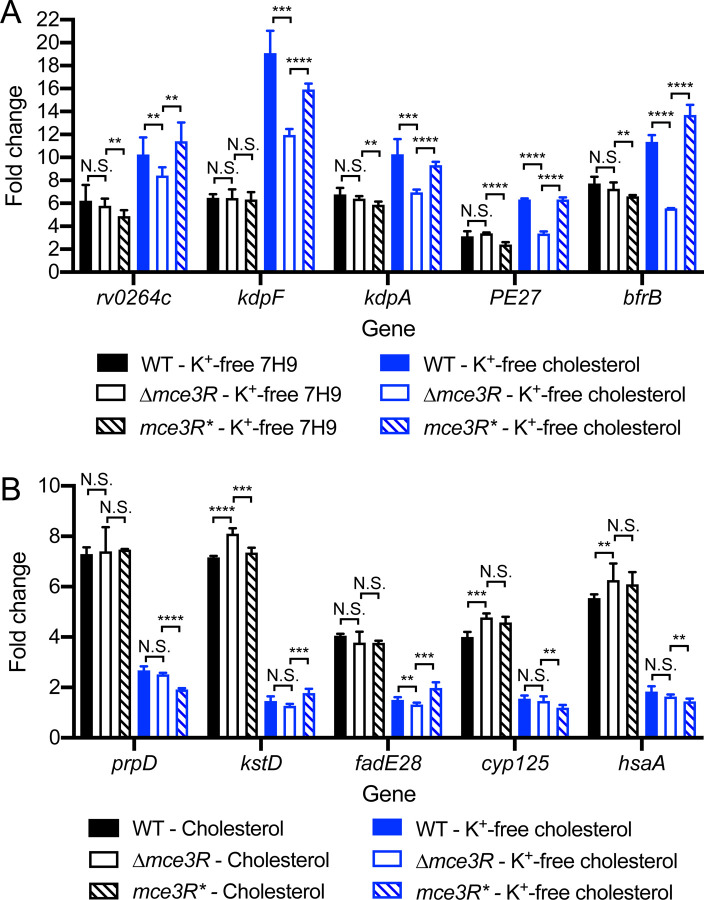
How bacterial response to environmental cues and nutritional sources may be integrated in enabling host colonization is poorly understood. Exploiting a reporter-based screen, we discovered that overexpression of Mycobacterium tuberculosis (Mtb) lipid utilization regulators altered Mtb acidic pH response dampening by low environmental potassium (K+). Transcriptional analyses unveiled amplification of Mtb response to acidic pH in the presence of cholesterol, a major carbon source for Mtb during infection, and vice versa. Strikingly, deletion of the putative lipid regulator mce3R resulted in loss of augmentation of (i) cholesterol response at acidic pH, and (ii) low [K+] response by cholesterol, with minimal effect on Mtb response to each signal individually. Finally, the ∆mce3R mutant was attenuated for colonization in a murine model that recapitulates lesions with lipid-rich foamy macrophages. These findings reveal critical coordination between bacterial response to environmental and nutritional cues, and establish Mce3R as a crucial integrator of this process.

Keywords: C3HeB/FeJ; Mycobacterium tuberculosis; acidic pH; cholesterol; environmental cues; foamy macrophages; lipids; mce3R; potassium.


Conflict of interest statement

DECLARATION OF INTERESTS The authors declare no competing interests.

Figures

Figure 1.
Figure 1.. Environmental K+ levels modulate Mtb transcriptional response to acidic pH.
(A) rv2390c’::GFP reporter response to acidic pH is dampened in the presence of low [K+]. Mtb(rv2390c’::GFP) was grown in 7H9, pH 7.0 or pH 5.85 media, or in K+-free 7H9, pH 5.85 medium, supplemented with 0.1 mM K+. Samples were taken at indicated time points, fixed, and GFP induction analyzed by flow cytometry. Data are shown as means ± SD from 3 experiments. p-values were obtained with an unpaired t-test with Welch’s correction, and compare the 7H9, pH 5.85 to the 0.1 mM K+, pH 5.85 condition. ** p<0.01. (B) Dampening of Mtb response to acidic pH by low K+ is concentration dependent. Mtb(rv2390c’::GFP) was grown in 7H9, pH 5.85 medium (“control”), or in K+-free 7H9, pH 5.85 medium, supplemented with indicated amounts of K+. Samples were taken 9 days post-assay start, fixed, and GFP induction analyzed by flow cytometry. Data are shown as means ± SD from 3 experiments. (C) Mtb response to low [K+] is not affected by environmental pH. Mtb(kdpF’::GFP) was grown in 7H9, pH 7.0 or pH 5.7, or in K+-free 7H9, pH 7 or pH 5.7 media. Samples were taken at indicated time points, fixed, and GFP induction analyzed by flow cytometry. Data are shown as means ± SD from 3 experiments.
Figure 2.
Figure 2.. A rv2390c’::luciferase reporter transcription factor overexpression screen identifies lipid utilization regulators as modulators of the interplay between environmental [K+] and Mtb pH response.
(A and B) Lipid utilization regulator hits from reporter-based, inducible transcription factor (TF) overexpression screen. A library of inducible TF overexpression plasmids (P1’::TF-FLAG-tetON) in the background of a Mtb(rv2390c’::luciferase) strain was screened for their response to acidic pH in the presence of low [K+]. TF overexpression was induced by adding 200 ng/ml of anhydrotetracycline (ATC) 1 day before Mtb was exposed to K+-free 7H9, pH 7 or K+-free 7H9, pH 5.85 media supplemented with 1.6 mM or 0.05 mM K+. 9 days post-exposure (continuous ATC presence), light output (relative light units, RLU) and OD600 were measured. Fold induction compares RLU/OD600 in each condition to RLU/OD600 in the control K+-free 7H9, pH 7 condition. (A) shows results of the lipid utilization regulator hits, together with an empty vector plasmid control. (B) shows validation of the screen hits in (A), with each hit TF compared to its uninduced control (ethanol, “EtOH”, as a carrier control). In (B), data are shown as means ± SD from three experiments, and p-values were obtained with an unpaired t-test with Welch’s correction. N.S. not significant, * p<0.05, ** p<0.01, *** p<0.001, **** p<0.0001. (C) Mce3R modulates the interplay between environmental [K+] and Mtb pH response. Log-phase WT, ∆mce3R and mce3R* (complemented mutant) were exposed for 4 hours to K+-free 7H9, pH 7 or K+-free 7H9, pH 5.85 media supplemented with 1.6 mM or 0.05 mM K+, before RNA was extracted for qRT-PCR analysis. Fold change is as compared to the K+-free 7H9, pH 7 condition. sigA was used as the control gene, and data are shown as means ± SD from 3 technical replicates, representative of 3 experiments. p-values were obtained with an unpaired t-test with Welch’s correction and Holm-Sidak multiple comparisons, N.S. not significant, *** p<0.001, **** p<0.0001.
Figure 3.
Figure 3.. Mtb transcriptional response to low [K+] and cholesterol are linked.
(A) Low [K+] dampens Mtb response to cholesterol. Log-phase Mtb was exposed for 4 hours to (i) 7H9, pH 7, (ii) cholesterol, pH 7, or (iii) K+-free cholesterol, pH 7 media, before RNA was extracted for qRT-PCR analysis. (B) Cholesterol augments Mtb response to low [K+]. Log-phase Mtb was exposed for 4 hours to (i) 7H9, pH 7, (ii) K+-free 7H9, pH 7, or (iii) K+-free cholesterol, pH 7 media, before RNA was extracted for qRT-PCR analysis. Fold change is as compared to the 7H9, pH 7 condition in all cases. sigA was used as the control gene, and data are shown as means ± SD from 3 technical replicates, representative of 3 experiments. p-values were obtained with an unpaired t-test with Welch’s correction, *** p<0.001, **** p<0.0001.
Figure 4.
Figure 4.. Mtb transcriptional response to acidic pH and cholesterol are linked globally.
(A and D) Global changes in Mtb response to cholesterol and acidic pH in the simultaneous presence of both signals. Log-phase Mtb was exposed for 4 hours to (i) 7H9, pH 7, (ii) 7H9, pH 5.7, (iii) cholesterol, pH 7, or (iv) cholesterol, pH 5.7 media, before RNA was extracted for RNAseq analysis. Log2-fold change compares gene expression in each indicated condition to the 7H9, pH 7 condition. Genes marked in red had a log2-fold change ≥ 0.6 between the two conditions compared (p<0.05, FDR<0.01 in both sets, with log2-fold change ≥1 in the single condition set). (B and C) Effect of acidic pH on Mtb response to cholesterol is concentration dependent. Log-phase Mtb was exposed to the indicated conditions, along with control 7H9, pH7 condition, for 4 hours, before RNA was extracted for qRT-PCR analysis. (E and F) Effect of cholesterol on Mtb response to acidic pH is concentration dependent. For all qRT-PCR data, fold change is as compared to the 7H9, pH 7 condition, and data are shown as means ± SD from 3 technical replicates, representative of 3 experiments.
Figure 5.
Figure 5.. Mce3R regulates Mtb response to cholesterol only in the context of acidic pH.
Log-phase WT, ∆mce3R and mce3R* (complemented strain) Mtb were exposed for 4 hours to (i) 7H9, pH 7, (ii) 7H9, pH 5.7, (iii) cholesterol, pH 7, or (iv) cholesterol, pH 5.7 media, before RNA was extracted for RNAseq (A-C) or qRT-PCR (D-F). For RNAseq data, log2-fold change compares gene expression in each indicated condition to the 7H9, pH 7 condition. Genes marked in red had a log2-fold change ≥ 0.6 between ∆mce3R and WT strains in the indicated condition (p<0.05, FDR<0.01 in both sets, with log2-fold change ≥1 in WT). For qRT-PCR data, fold change is as compared to the 7H9, pH 7 condition. Data are shown as means ± SD from 3 technical replicates, representative of 3 independent experiments. p-values were obtained with as unpaired t-test with Welch’s correction and Holm-Sidak multiple comparisons. N.S. not significant, ** p<0.01, *** p<0.001, **** p<0.0001.
Figure 6.
Figure 6.. Mce3R deletion dampens Mtb response to K+ in the presence of cholesterol.
Log-phase WT, Δmce3R, and mce3R* (complemented strain) Mtb were exposed for 4 hours to (A) K+-free 7H9 or cholesterol media at pH 7, or (B) cholesterol or K+-free cholesterol media at pH 7, along with 7H9, pH 7 as the control condition. Fold change is as compared to the 7H9, pH 7 condition in all cases. sigA was used as the control gene, and data are shown as means ± SD from 3 technical replicates, representative of 3 experiments. p-values were obtained with an unpaired t-test with Welch’s correction and Holm-Sidak multiple comparisons, N.S. not significant, ** p<0.01, *** p<0.001, **** p<0.0001.
Figure 7.
Figure 7.. A ∆mce3R Mtb mutant is attenuated for host colonization in the presence of lipids.
(A) Δmce3R Mtb is attenuated for macrophage colonization. Murine bone marrow-derived macrophages untreated or pre-treated with oleate for 24 hours to induce foamy macrophages were infected with WT, Δmce3R, or mce3R* (complemented mutant) Mtb, and colony forming units (CFUs) tracked over time. Data are shown as means ± SD from 3 wells, representative of 3 independent experiments. p-values were obtained with an unpaired t-test with Welch’s correction, comparing ∆mce3R to WT Mtb in untreated macrophages (*) or foamy macrophages (#). */# p<0.05, ** p<0.01. (B) Mtb is present in foamy macrophages 6 weeks post-infection in C3HeB/FeJ mice. C3HeB/FeJ mice were infected with Mtb constitutively expressing mCherry, and animals sacrificed at 2 or 6 weeks post-infection. Lungs were fixed and processed for confocal microscopy imaging. Images shown are z-slices from reconstructed 3D images. Nuclei are shown in grayscale (DAPI), all bacteria are marked in red (mCherry), f-actin is shown in blue (phalloidin), and lipid droplets are shown in green (Bodipy 493/503). Scale bar 10 µm. (C) Δmce3R Mtb is attenuated for colonization in a murine infection model. C3HeB/FeJ mice were infected with WT, Δmce3R, or mce3R* Mtb, and lung homogenates plated for CFUs 2 or 6 weeks post-infection. p-values were obtained with a Mann-Whitney statistical test. N.S. not significant, **p<0.01.

Similar articles

References

    1. Rohde K.H., Abramovitch R.B., and Russell D.G. (2007). Mycobacterium tuberculosis invasion of macrophages: linking bacterial gene expression to environmental cues. Cell Host Microbe 2, 352–364. 10.1016/j.chom.2007.09.006. - DOI - PubMed
    1. Tan S., Sukumar N., Abramovitch R.B., Parish T., and Russell D.G. (2013). Mycobacterium tuberculosis responds to chloride and pH as synergistic cues to the immune status of its host cell. PLoS Pathog 9, e1003282. 10.1371/journal.ppat.1003282. - DOI - PMC - PubMed
    1. MacGilvary N.J., Kevorkian Y.L., and Tan S. (2019). Potassium response and homeostasis in Mycobacterium tuberculosis modulates environmental adaptation and is important for host colonization. PLoS Pathog 15, e1007591. 10.1371/journal.ppat.1007591. - DOI - PMC - PubMed
    1. World Health Organization. (2022). Global tuberculosis report. https://www.who.int/publications/i/item/9789240061729. (Last accessed 18 August 2023.)
    1. Pérez E., Samper S., Bordas Y., Guilhot C., Gicquel B., and Martín C. (2001). An essential role for phoP in Mycobacterium tuberculosis virulence. Mol Microbiol 41, 179–187. 10.1046/j.1365-2958.2001.02500.x. - DOI - PubMed

Publication types