[Preprint]. 2025 Mar 28:2023.08.16.23294179.
doi: 10.1101/2023.08.16.23294179.

Neuroimaging-AI endophenotypes reveal underlying mechanisms and genetic factors contributing to progression and development of four brain disorders

Affiliations

Neuroimaging-AI endophenotypes reveal underlying mechanisms and genetic factors contributing to progression and development of four brain disorders

Junhao Wen et al. medRxiv. .

Update in

Abstract

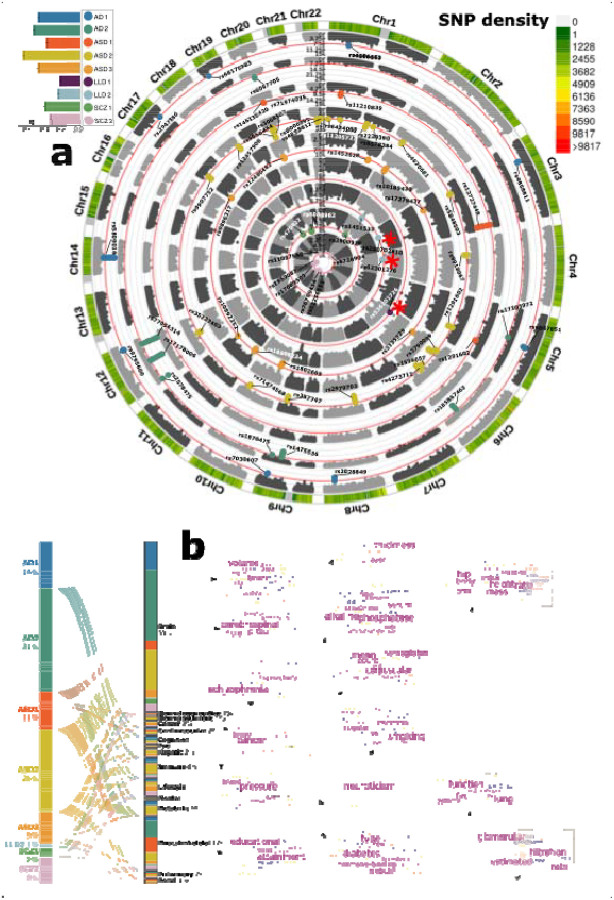
Recent work leveraging artificial intelligence has offered promise to dissect disease heterogeneity by identifying complex intermediate brain phenotypes, called dimensional neuroimaging endophenotypes (DNEs). We advance the argument that these DNEs capture the degree of expression of respective neuroanatomical patterns measured, offering a dimensional neuroanatomical representation for studying disease heterogeneity and similarities of neurologic and neuropsychiatric diseases. We investigate the presence of nine DNEs derived from independent yet harmonized studies on Alzheimer's disease, autism spectrum disorder, late-life depression, and schizophrenia in the UK Biobank study. Phenome-wide associations align with genome-wide associations, revealing 31 genomic loci (P-value<5×10⁻⁸/9) associated with the nine DNEs.The nine DNEs, along with their polygenic risk scores, significantly enhanced the predictive accuracy for 14 systemic disease categories, particularly for conditions related to mental health and the central nervous system, as well as mortality outcomes. These findings underscore the potential of the nine DNEs to capture the expression of disease-related brain phenotypes in individuals of the general population and to relate such measures with genetics, lifestyle factors, and chronic diseases.


Conflict of interest statement

Competing Interests Statement None

Figures

Figure 1:
Figure 1:. Study workflow
a) The concept of semi-supervised learning methods used in this study. These AI methods model the patterns and transformations from the healthy control (CN) to the patient (PT) domain, thus capturing variations related to underlying disease pathology. Nine DNEs previously published,,, from four disease-focused, case-control studies were investigated. b) The expression of the nine DNEs in the UK Biobank (UKBB) general population. The trained models were then applied to the UKBB population to quantify the expression of the neuroanatomical patterns of the nine DNEs at individual levels; a higher DNE score indicates a greater expression (manifestation/presence) of the respective neuroanatomical pattern. For example, the blue samples express predominantly AD2, whereas the pink samples express predominantly SCZ2. The kernel density estimate for each DNE is shown. Of note, AD1–2 DNEs are from the Surreal-GAN model and others from the HYDRA model, resulting in varying DNE score ranges by modeling. Overall, lower scores imply milder imaging pattern expressions. c) Phenome- and genome-wide analyses were performed on the nine DENs. Phenome-wide association studies (PWAS) were conducted to associate the nine DNEs with phenotypes across nine organ systems, cognition, and lifestyle factors. Genome-wide association studies (GWAS) were performed to investigate associations between the nine DNEs and common genetic variants (SNPs). Finally, the nine DNEs and their polygenic risk scores predicted 14 disease categories (ICD-10-based), 8 cognitive scores, and mortality. CN: healthy control; PT: patient.
Figure 2:
Figure 2:. Phenome-wide associations of the nine DNEs
a) The neuroanatomical patterns of the nine DNEs were manifested in the UKBB general population and were concordant with the patterns initially derived from the original disease populations,,,. A linear regression model was applied to the 119 gray matter regions of interest (ROIs) derived from T1-weighted MRI data while accounting for various covariates. We present the β coefficients of the ROIs that withstood the Bonferroni correction. Positive correlations are depicted using warm reddish colors, while cold blue colors represent negative correlations. For AD2, we showed the sagittal view to visualize the hippocampus and medial temporal lobe. Sample sizes range from 40,534 to 40,981 to derive these results. b) The nine DNEs are over-expressed (i.e., a higher mean of the DNE score in the population) and under-expressed (i.e., a lower mean of the DNE score) in the general population compared to the disease populations. The kernel density estimates of the nine DNEs are shown for both the training dataset (gray-colored in patients) and the independent test dataset from the UK Biobank (UKBB). Significant differences that survived the Bonferroni corrections between the training and independent test datasets (two-sampled t-test) are denoted with the symbol *. Sample sizes range from 38,534 to 38,981 to derive these results in UKBB and from 307 to 1510 in the original diseased populations. c) Phenome-wide associations (PWAS) between the nine DNEs (left panel) and 611 phenotypes (middle panel) are dominated by brain phenotypic measures. The right panel shows representative phenotypes linked to multiple phenotype categories with the highest statistical significance after the Bonferroni correction (two-sided t-test P-value<0.05/611). A thicker colored line corresponds to a higher value of −log10(P-value). The symbols “+” and “-” represent positive and negative correlations. IDP: imaging-derived phenotype; OD: orientation dispersion; FA: fractional anisotropy; ICVF: intracellular volume fraction; FC: functional connectivity; DSST: digit symbol substitution test. Sample sizes range from 722 to 39,174 after merging the DNEs and these phenotypes. The illustration of the human anatomy is from NIH BIOART Source (https://bioart.niaid.nih.gov/).
Figure 3:
Figure 3:. Genome-wide associations of the nine DNEs
a) Genome-wide associations identified 66 (10, 8, 5, 21, 9, 1, 3, 3, 6 for the nine DNEs) genomic loci (P-value<5×10⁻⁸) associated with the nine DNEs. Using the top lead SNP, we denoted each genomic loci linked to the 9 DNEs. Red * symbols indicate that the locus LD has not been previously associated with any trait in the EMBL-EBI GWAS catalog. The left legend indicates the significant SNP-based heritability (h2) for the nine DNEs; the right legend represents the SNP density of our genetic data throughout the human genome. GWAS was performed using the Genome Reference Consortium Human Build 37 (GRCh37). These GWASs included 31,976 participants of European ancestry. b) Phenome-wide association query of the previously identified genomic loci (left panel) in the EMBL-EBI GWAS Catalog (via FUMA 1.4.2) shows a brain-dominant genetic architecture. We categorized all clinical traits (middle panel) into several high-level categories linked to multiple organ systems, neurodegenerative and neuropsychiatric disorders, lifestyle factors, etc. We then show the keyword cloud plots for each category (right panel). The illustration of the human anatomy is from NIH BIOART Source (https://bioart.niaid.nih.gov/).
Figure 4:
Figure 4:. The genetic correlation, colocalization, and causal networks of the nine DNEs
a) The genetic correlation between two DNEs (gc, lower triangle) mirrors their phenotypic correlation (pc, upper triangle). Red-shadowed rectangles highlight two exceptions. The symbol * indicates significant results after the Benjamini-Hochberg correction. The symbol # indicates nominal significance. b) genetic correlations between the nine DNEs and nine biological age gaps (BAG) for nine human organ systems. c) genetic correlations between the nine DNEs and six neurodegenerative and neuropsychiatric disorders. The bar plots display the estimated mean genetic correlation along with its standard error. d) genetic correlations between the nine DNEs and four traits related to lifestyle factors and cognition. The bar plots display the estimated mean genetic correlation along with its standard error. A two-sided p-value is used to determine statistical significance. e) genetic colocalization was evidenced at one locus (6p21.1) between ASD2 and SCZ1. The signed PP.H4.ABF (0.92) denotes the posterior probability (PP) of hypothesis H4, which suggests that both traits share the same causal SNP (rs2790099). A positive PP indicates concordant β values for both DNEs, while a negative PP implies opposite β values. f) genetic colocalization was evidenced at one locus (3p.22.1) between ASD2 and brain BAG: PP.H4.ABF=0.95 with the cause SNP rs5848503. g) genetic colocalization was evidenced at one locus (6p.22.1) between ASD3 and SCZ case-control GWAS from PGC (European ancestry): PP.H4.ABF=0.82 with the cause SNP rs9257566. h) the causal network of the nine DNEs with the eight multi-organ BAGs. Solid arrow lines (from the exposure to the outcome variables) indicate significant causal relationships after the Benjamini-Hochberg correction; dotted arrow lines show nominal significance (P-value<0.05). The symbols + (OR>1 and gc>0) and – (OR<1 and gc<0) represent a positive relationship between the two traits. i) the causal network of the nine DNEs with the eleven chronic diseases (e.g., AD, ADHD, BIP, and SCZ from PGC). Abbreviation: AD: Alzheimer’s disease; ADHD: Attention-deficit/hyperactivity disorder; ASD: autism spectrum disorder; BIP: bipolar disorder; SCZ: schizophrenia; OCD: Obsessive-compulsive disorder; RA: rheumatoid arthritis; CD: Crohn’s disease; T2D: type 2 diabetes; IBD: inflammatory bowel disease; PBC: Primary biliary cirrhosis. The illustration of the human anatomy is from NIH BIOART Source (https://bioart.niaid.nih.gov/).
Figure 5:
Figure 5:. Additional prediction power of the nine DNEs and PRSs for 14 systemic diseases, cognition, and mortality outcomes
a) The incremental R-squared (R2) values of the nine DNEs for predicting 14 systemic disease categories were assessed using the entire UKBB sample, with N=39,178 participants as independent test data. The results focusing only on the PRS target population (N=15,891) can be found in Supplementary Figure 18. “ALL” indicates the incremental R2 contributed by combining the nine DNEs. b) The incremental R2 of the PRS of the nine DNEs to predict 14 systemic diseases based on the ICD-10 code using only the PRS target sample. c) In the PRS target sample, disease classification accuracy from the independently hold-out test data (N=5581) was assessed using nested cross-validated support vector machines in the training/validation/test data (N=10,000) by fitting various sets of features (Cov indicates age and sex). d) In the PRS target sample, cognitive score prediction accuracy (Peasrson’s r) from the independently hold-out test data (3632<N<5570) was assessed using nested cross-validated support vector regression models. e) The SCZ1, SCZ1-PRS, AD1-PRS, and ASD1 show significant associations with the risk of mortality in the PRS target sample. Age and sex were included as covariates in the Cox proportional hazard model. f) The nine DNEs and PRSs were cumulatively included as features in cross-validation for mortality risk prediction. The symbol * indicates significant results that survived the Benjamini-Hochberg correctionThe symbol # indicates nominal significance. All P values are two-sided. HR: hazard ratio; CI: concordance index; DSST: digit symbol substitution test; TMT: trail-making test. The box plots display the mean of the CIs, while the violin plots illustrate their distribution during cross-validation.

References

    1. Hwang G. et al. Assessment of Neuroanatomical Endophenotypes of Autism Spectrum Disorder and Association With Characteristics of Individuals With Schizophrenia and the General Population. JAMA Psychiatry (2023) doi:10.1001/jamapsychiatry.2023.0409. - DOI - PMC - PubMed
    1. Wen J. et al. Characterizing Heterogeneity in Neuroimaging, Cognition, Clinical Symptoms, and Genetics Among Patients With Late-Life Depression. JAMA Psychiatry (2022) doi:10.1001/jamapsychiatry.2022.0020. - DOI - PMC - PubMed
    1. Young A. L. et al. Uncovering the heterogeneity and temporal complexity of neurodegenerative diseases with Subtype and Stage Inference. Nat Commun 9, 4273 (2018). - PMC - PubMed
    1. Yang Z. et al. A deep learning framework identifies dimensional representations of Alzheimer’s Disease from brain structure. Nat Commun 12, 7065 (2021). - PMC - PubMed
    1. Zhang X. et al. Bayesian model reveals latent atrophy factors with dissociable cognitive trajectories in Alzheimer’s disease. Proc Natl Acad Sci USA 113, E6535–E6544 (2016). - PMC - PubMed

Publication types