[Preprint]. 2023 Sep 1:2023.08.23.554536.
doi: 10.1101/2023.08.23.554536.

Efficient and multiplexed tracking of single cells using whole-body PET/CT

Affiliations

Efficient and multiplexed tracking of single cells using whole-body PET/CT

Hieu T M Nguyen et al. bioRxiv. .

Update in

Abstract

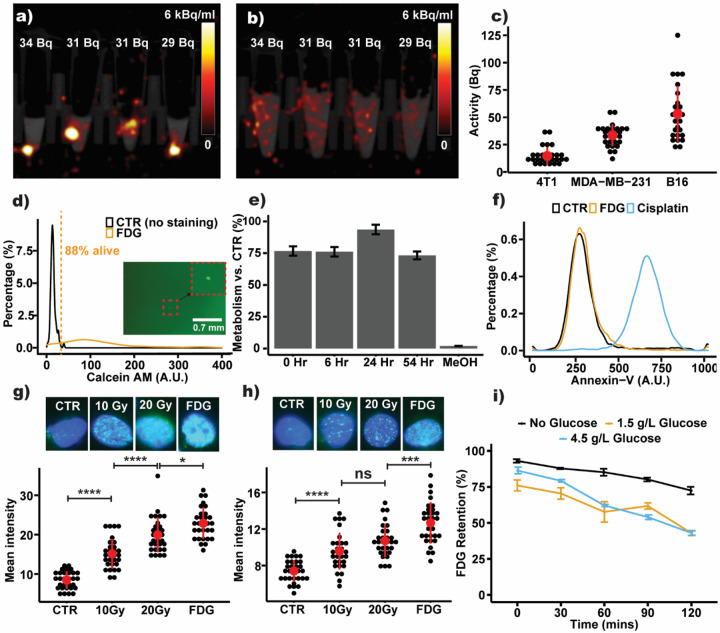
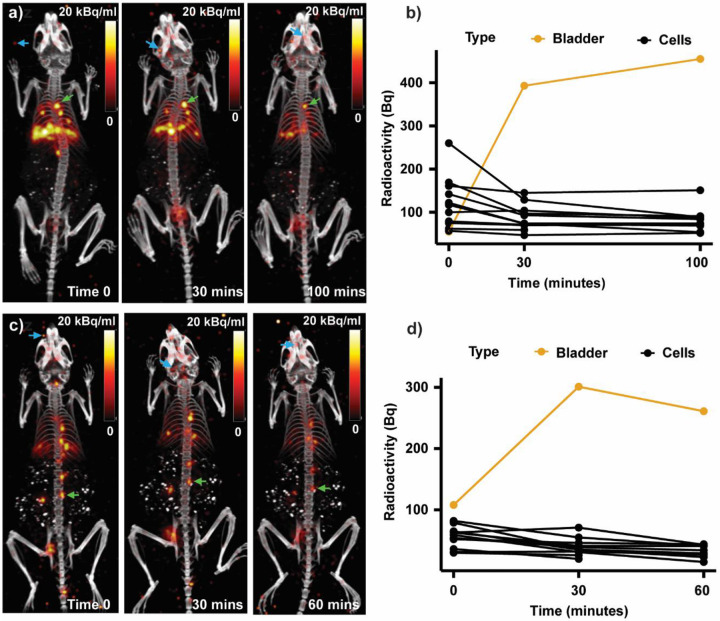
In vivo molecular imaging tools are crucially important for elucidating how cells move through complex biological systems, however, achieving single-cell sensitivity over the entire body remains challenging. Here, we report a highly sensitive and multiplexed approach for tracking upwards of 20 single cells simultaneously in the same subject using positron emission tomography (PET). The method relies on a new tracking algorithm (PEPT-EM) to push the cellular detection threshold to below 4 Bq/cell, and a streamlined workflow to reliably label single cells with over 50 Bq/cell of 18F-fluorodeoxyglucose (FDG). To demonstrate the potential of method, we tracked the fate of over 70 melanoma cells after intracardiac injection and found they primarily arrested in the small capillaries of the pulmonary, musculoskeletal, and digestive organ systems. This study bolsters the evolving potential of PET in offering unmatched insights into the earliest phases of cell trafficking in physiological and pathological processes and in cell-based therapies.

Keywords: FDG; cell tracking; positron emission tomography; reconstruction algorithms; single-cell analysis.


Figures

Figure 1.
Figure 1.. Workflow for tracking single radiolabeled cells in vivo with PET.
Cancer cells (B16) were radiolabeled with FDG (1), then sorted and dispensed as single cells using a microfluidic device (2). As a proof of concept, the labeled cells were injected into a murine model via either intravenous (3a) or intracardiac (3b) routes. Cells injected intravenously were trapped in the lungs, whereas those injected intracardially were widely disseminated throughout the entire body. We used PET/CT and a custom algorithm to estimate the 3D locations of these single cells (4).
Figure 2.
Figure 2.. In vitro characterization of FDG cell labeling.
(a, b) Single FDG-labeled cells (B16) were placed in vials and imaged with PET/CT before and after adding lysis buffer, showing that focal PET signal is a characteristic feature of live cells. (c) The radioactivity of single cells was measured with a gamma counter, revealing that B16 cells could be labeled with FDG more effectively than MDA-MB-231 and 4T1 cells. (d) Viability of FDG-labeled cells was >88%, as assessed by Calcein-AM staining. Inset picture: fluorescence micrograph confirming that the device dispensed exactly one cell. (e) CCK-8 assay, demonstrating a 75% cell metabolic rate 54 hours after labeling, relative to control cells. (f) Annexin-V assay, showing comparable levels of cell apoptosis in labeled and control cells 3 hours after labeling and significantly less than the positive control (Cisplatin). (g, h) DNA damage characterized using γH2AX staining for control, X-ray irradiated, and FDG-labeled cells, measured 10 minutes (g) and 24 hours after labeling (h). (i) FDG efflux from FDG-labeled cells in the presence of different concentrations of D-glucose (0, 1.5g/L, and 4.5g/L).
Figure 3.
Figure 3.. In vivo PET imaging of FDG-labeled single cells.
(a, c) PET/CT images of radiolabeled single cells, which were introduced into mice via intravenous (a) or intracardiac injection (c). PET images were reconstructed using the conventional OSEM method. The focal signals seen in the PET images represent single labeled cells (green arrows). High-frequency reconstruction noise is also visible in the images near the edge of the field of view (blue arrows). (b, d) Region-of-interest quantification of the PET images, showing the change in radioactivity in single cells and bladder over time.
Figure 4.
Figure 4.. PEPT-EM improves the detection of single cells.
(a) Schematic representation of OSEM, the standard algorithm for PET reconstruction. (b) PET image obtained by OSEM reconstruction, showing five FDG-labeled cells imaged in vials. The lowest detectable cell had 12 Bq. (c) Schematic representation of PEPT-EM, a tracking algorithm based on a Gaussian mixture model that estimates the 3D positions of radioactive sources directly from the recorded coincident annihilation photons. (d) The 3D positions of the discrete sources were reconstructed by PEPT-EM from the same PET dataset, shown here as red asterisks over the CT image of the vials. (e) The PEPT-EM algorithm was initialized by generating random cell locations. As the algorithm iterates, it progressively converges towards the maximum-likelihood location of the cells, leading to a significant reduction in the standard deviation of the estimated position (represented by the radius of the circle).
Figure 5.
Figure 5.. In vivo tracking single cells using PEPT-EM.
(a) The PEPT-EM algorithm was applied to a PET dataset acquired after intravenously injecting ten to twenty single cells into Foxn1nu mice. The resulting cell positions (red asterisks; right panel) are compared to the conventional OSEM reconstruction of the same dataset (left panel). (b-c) Both algorithms were also applied to a PET dataset obtained by injecting FDG-labeled cells into the left ventricle of a mouse. The results are shown for 10-minute (b) and 1-minute acquisitions (c).
Figure 6.
Figure 6.. In vivo tracking of the fate of single cells after intracardiac injection.
(a) PET/CT image (OSEM reconstruction; maximum intensity projection) of a mouse right after intracardiac (left ventricle) injection, with labels indicating the anatomical locations where cancer cells were arrested. (b) A comprehensive summary of the results, showing the sites and organ systems in which 74 labeled cells arrested (n=6 mice). (c) Three-dimensional rendering showing single-cell distribution (OSEM reconstruction) relative to the segmented bony and cardiovascular anatomy.

References

    1. Hong H., Yang Y., Zhang Y. & Cai W. Non-Invasive Cell Tracking in Cancer and Cancer Therapy. Current Topics in Medicinal Chemistry 10, 1237–1248 (2010). https://doi.org/http://dx.doi.org.stanford.idm.oclc.org/10.2174/156802610791384234 - DOI - PMC - PubMed
    1. Ottobrini L., Martelli C., Trabattoni D. L., Clerici M. & Lucignani G. In vivo imaging of immune cell trafficking in cancer. European Journal of Nuclear Medicine and Molecular Imaging 38, 949–968 (2011). 10.1007/s00259-010-1687-7 - DOI - PubMed
    1. Lauri C., Varani M., Bentivoglio V., Capriotti G. & Signore A. Present status and future trends in molecular imaging of lymphocytes. Seminars in Nuclear Medicine 53, 125–134 (2023). https://doi.org/10.1053/j.semnuclmed.2022.08.011 - DOI - PMC - PubMed
    1. Oliveira F. A. et al. Noninvasive Tracking of Hematopoietic Stem Cells in a Bone Marrow Transplant Model. Cells 9 (2020). - PMC - PubMed
    1. Laird D. J., von Andrian U. H. & Wagers A. J. Stem cell trafficking in tissue development, growth, and disease. Cell 132, 612–630 (2008). 10.1016/j.cell.2008.01.041 - DOI - PubMed

Publication types