[Preprint]. 2023 Aug 21:2023.08.19.553954.
doi: 10.1101/2023.08.19.553954.

Coxsackievirus infection induces direct pancreatic β-cell killing but poor anti-viral CD8+ T-cell responses

Affiliations

Coxsackievirus infection induces direct pancreatic β-cell killing but poor anti-viral CD8+ T-cell responses

Federica Vecchio et al. bioRxiv. .

Update in

  • Coxsackievirus infection induces direct pancreatic β cell killing but poor antiviral CD8+ T cell responses.
    Vecchio F, Carré A, Korenkov D, Zhou Z, Apaolaza P, Tuomela S, Burgos-Morales O, Snowhite I, Perez-Hernandez J, Brandao B, Afonso G, Halliez C, Kaddis J, Kent SC, Nakayama M, Richardson SJ, Vinh J, Verdier Y, Laiho J, Scharfmann R, Solimena M, Marinicova Z, Bismuth E, Lucidarme N, Sanchez J, Bustamante C, Gomez P, Buus S; nPOD-Virus Working Group; You S, Pugliese A, Hyoty H, Rodriguez-Calvo T, Flodstrom-Tullberg M, Mallone R. Vecchio F, et al. Sci Adv. 2024 Mar 8;10(10):eadl1122. doi: 10.1126/sciadv.adl1122. Epub 2024 Mar 6. Sci Adv. 2024. PMID: 38446892 Free PMC article.

Abstract

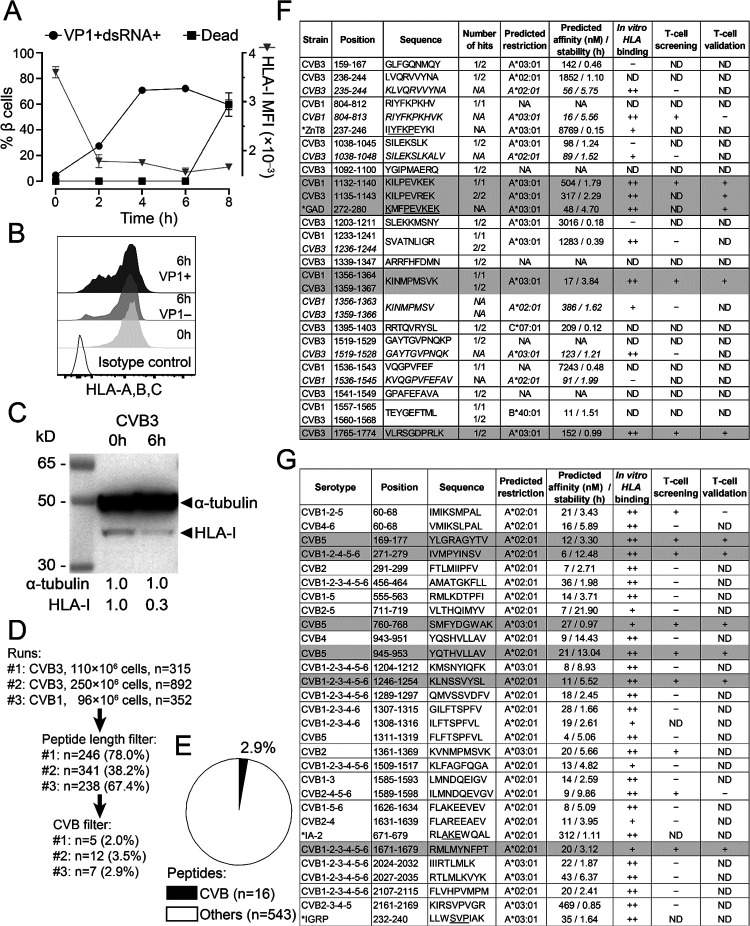
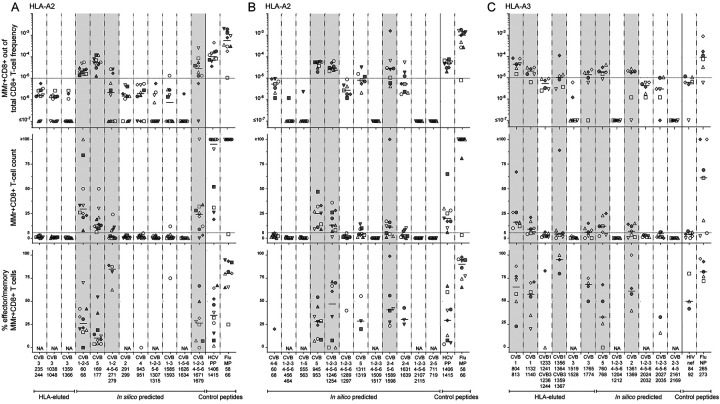
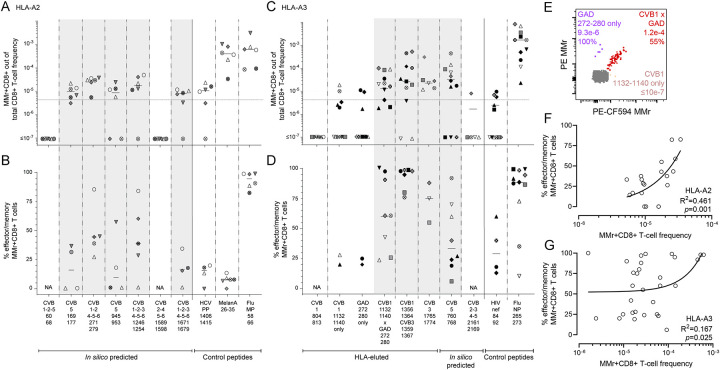
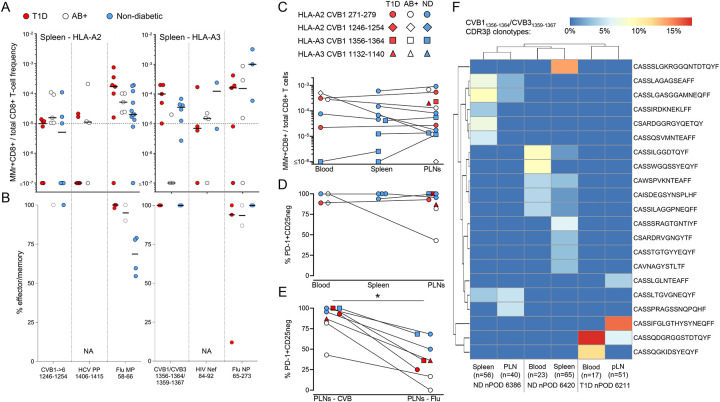
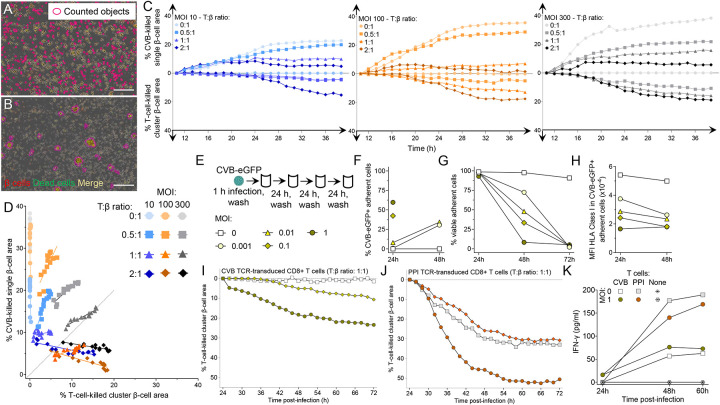
Coxsackievirus B (CVB) infection of pancreatic β cells is associated with β-cell autoimmunity. We investigated how CVB impacts human β cells and anti-CVB T-cell responses. β cells were efficiently infected by CVB in vitro, downregulated HLA Class I and presented few, selected HLA-bound viral peptides. Circulating CD8+ T cells from CVB-seropositive individuals recognized only a fraction of these peptides, and only another sub-fraction was targeted by effector/memory T cells that expressed the exhaustion marker PD-1. T cells recognizing a CVB epitope cross-reacted with the β-cell antigen GAD. Infected β cells, which formed filopodia to propagate infection, were more efficiently killed by CVB than by CVB-reactive T cells. Thus, our in-vitro and ex-vivo data highlight limited T-cell responses to CVB, supporting the rationale for CVB vaccination trials for type 1 diabetes prevention. CD8+ T cells recognizing structural and non-structural CVB epitopes provide biomarkers to differentially follow response to infection and vaccination.

Keywords: Enterovirus; HLA; cytotoxic T lymphocytes; epitopes; glutamic acid decarboxylase; immunopeptidome; mimicry; type 1 diabetes; vaccination.


Conflict of interest statement

H.H. is a board member and stock owner in Vactech Ltd, which develops vaccines against picornaviruses and licensed CVB vaccine-related intellectual property rights to Provention Bio Inc. M.F.-T. serves and A.P. served on the scientific advisory board of Provention Bio Inc. R.M. received research funding from Provention Bio Inc.

Figures

Figure 1.
Figure 1.. CVB-infected β cells downregulate surface HLA-I expression and present few selected HLA-I-bound viral peptides.
A. ECN90 β cells were infected in vitro with CVB3 at 300 MOI. The kinetics of expression of the viral markers VP1 and dsRNA, of cell death (left y-axis) and of HLA-I median fluorescence intensity (MFI; right y-axis) was measured by flow cytometry. B-C. HLA-I expression measured by flow cytometry (B) and Western blot (C) on ECN90 β cells 6 h post-infection. D. The 6-h time point was chosen and 3 HLA-I peptidomics runs performed. Cells were lysed and HLA-I-bound peptides eluted and sequenced by MS. Sequences were filtered for peptide length (8–12 aa) and for matches with the translated RNA sequences of the CVB strains used. The number of peptides retained at each filtering step are shown (percent of peptides out of those from the previous step in parentheses). E. Percent CVB peptides out of total 8–12mer peptides eluted. F. CVB peptides retrieved from HLA peptidomics experiments and length variants of the core sequences identified (shown in italics). The number of hits out of the 3 peptidomics runs performed (Fig. 1D) are listed for each peptide, and their mapping in the CVB polyprotein sequence is detailed in Fig. S1. A ZnT8237–246 peptide homologous to CVB1804–812 (identified by Blast search) and a GAD272–280 peptide homologous to the CVB11132–1140/CVB31135–1143 sequence retrieved from our previous datasets are indicated with an asterisk (conserved aa underlined). HLA-I restrictions were assigned using NetMHCStabpan 1.0, and predicted affinity and stability values are listed. Subsequent columns list in-vitro HLA binding results (detailed in Fig. S2) and peptides identified as recognized by CD8+ T cells in the screening (Fig. 2) and validation runs (Fig. 3). Peptides eventually validated for T-cell recognition are shaded in grey. CVB11132–1140 and CVB31135–1143 differ only by 1 aa and were thus counted as one peptide (total n=16). G. CVB nonamer peptides identified in a parallel in-silico search for all 6 CVB strains. Homologous β-cell peptides identified by Blast search are indicated with an asterisk. Three peptides that did not confirm as binders in vitro were excluded (see Fig. S2). For HLA-eluted peptides, sequence annotations refer to the CVB1/CVB3 strains used to infect β cells. For in-silico predicted peptides, annotations indicate sequence identities across serotypes. NA, not applicable or not assigned; ND, not determined.
Figure 2.
Figure 2.. Screening of CVB peptides for recognition by blood CD8+ T cells in seropositive healthy adults.
A-C. HLA-A2-rectricted (A-B) and HLA-A3-restricted candidates (C) were tested with combinatorial MMr assays (see reproducibility in Fig. S2F-G). Each symbol represents a donor (legends in Table S1) and the bars display median values. For each panel, the top graph depicts the frequency of MMr+CD8+ T cells out of total CD8+ T cells, with the horizontal line indicating the 10‒5 frequency cut-off used as a first validation criterion; the middle graph displays the number of MMr+CD8+ T cells counted, with the horizontal line indicating the cut-off of 5 cells used to assign an effector/memory phenotype; the bottom graph shows the percent fraction of effector/memory cells (i.e. excluding naïve CD45RA+CCR7+ cells) among MMr+CD8+ T cells (for those donors with ≥5 cells counted; NA when not assigned). Peptides validated in this screening phase are highlighted in grey. In each panel, control peptides are derived from viruses eliciting predominantly naïve responses in these unexposed individuals (HLA-A2-restricted HCV PP1406–1415 and HLA-A3-restricted HIV nef84–92) and from Influenza virus (Flu MP58–66 and NP265–273 peptides) eliciting predominantly effector/memory responses.
Figure 3.
Figure 3.. Validation of CVB epitopes as targets of blood CD8+ T cells in seropositive healthy adults.
A-D. The HLA-A2-rectricted and HLA-A3-restricted peptides selected for validation from the screening round (Fig. 2) are shown in panels A-B and C-D, respectively (see Fig. S3 for representative dot plots and Table S2 for detailed results). In the HLA-A3 panel, the CVB2–3-4–52161–2169 peptide not retained after screening was here included as negative control. Each symbol represents a donor (legends in Table S1), with donors recruited in Paris and Miami depicted in panels C-D as white/gray and black symbols, respectively. Bars indicate median values. Panels A, C depict the frequency of MMr+CD8+ T cells out of total CD8+ T cells, with the horizontal line indicating the 5×10⁻⁶ frequency cut-off used for validation, with only peptides scoring ≥3 MMr+ cells retained for this more stringent analysis. Panels B, D show the percent fraction of effector/memory cells among MMr+CD8+ T cells. Validated peptides are highlighted in grey. In each panel, control peptides are derived from viruses or self-antigens eliciting predominantly naïve responses (HLA-A2-restricted HCV PP1406–1415/MelanA26–35 and HLA-A3-restricted HIV nef84–92) and from Influenza virus, eliciting predominantly effector/memory responses. For the CVB11132–1140 peptide homologous to GAD272–280, frequencies and effector/memory fractions are shown for T cells recognizing either peptide or both. E. CD8+ T cells cross-reactive to CVB11132–1140 (loaded on PE-CF594/BV711 MMrs) and GAD272–280 (loaded on PE/BV711 MMrs) appearing as a triple-stained population labeled by the 4 MMrs (see Fig. S3C-D for gating details). F-G. Correlation between the frequency of CVB epitope-reactive MMr+CD8+ T cells and their percent effector/memory fraction for HLA-A2- (F) and HLA-A3-restricted peptides (G). Each symbol represents an individual epitope specificity in an individual donor.
Figure 4.
Figure 4.. CVB-reactive CD8+ T cells are also found in spleen and pancreatic lymph nodes and display a PD-1+ phenotype.
A-B. Detection of CVB epitope-reactive CD8+ T cells in splenocytes from nPOD organ donors (HLA-A2+, left; and HLA-A3+, right; see details in Table S3). Each symbol represents a donor and bars indicate median values. Panel A depicts the frequency of MMr+CD8+ T cells out of total CD8+ T cells, with the horizontal line indicating the 10−5 frequency cut-off. A median of 73,320 CD8+ T cells were counted (range 9,611–307,697). Only epitopes testing positive are depicted (complete peptide panels listed in Fig. S5A). Panel B displays the percent effector/memory fraction within each MMr+CD8+ population for those donors/epitopes with ≥5 MMr+ cells counted. C-D. CVB epitope-reactive CD8+ T cells in lymphoid tissues from nPOD cases. CVB MMr+CD8+ T-cell frequencies (C) and percent PD-1+CD25 MMr+ cells (D; for donors/epitopes with cell counts ≥5) across available tissues are depicted. E. Comparison of PD-1+CD25 fractions between CVB and Influenza virus MMr+CD8+ T cells detected in the same PLN; *p=0.014 by Wilcoxon signed rank test. F. Expanded TCR CDR3β clonotypes in individual CVB1/CVB31356–1364/1359–1367-reactive CD8+ T cells from the same nPOD cases/tissues. Expanded clonotypes were defined as those found in at least 2 MMr+ cells in the same tissue from the same donor, and are clustered according to frequency (one columns per tissue/case) and sequence similarity (one row per CDR3β clonotype). Further details are provided in Fig. S5-S6.
Figure 5.
Figure 5.. CVB-reactive CD8+ T cells stained on spleen and PLN tissue sections are more abundant than other viral antigen reactivities in T1D donors.
A-I. Representative immunofluorescence images of spleen (A-B-C), PLN (D-E-F) and pancreas (G-H-I) tissue sections (detailed in Table S4) stained with pooled CMV/Flu, pooled CVB or single WNV MMrs (red; see Fig. S7) and CD8 (green). Cell nuclei are stained in blue. Scale bars: 20 μm for spleen, 50 μm for CVB PLN, 20 μm for CMV/Flu PLN, 10 μm for WNV PLN, and 50 μm for pancreas. White arrows indicate MMr+CD8+ T cells. J-K. Bar graphs showing the mean+SD of MMr+ cell densities (number of MMr+ cells/mm2 area) in the spleen (J) and PLNs (K) for CVB, CMV/Flu and WNV specificities in T1D, double-aAb+ (2AB+) and non-diabetic HLA-A2+ (triangles) and HLA-A3+ (circles) donors. **p=0.008 and *p=0.05 by Wilcoxon signed rank test.
Figure 6.
Figure 6.. Kinetics of CVB infection and β-cell death and presentation of CVB peptides.
A. Kinetics of infection and death measured by real-time imaging in ECN90 β cells infected with CVB3-eGFP at the indicated MOI and stained with Cytotox Red to visualize dead cells. Infection curves (green total area, in green) and death curves (red total area, in red) are plotted on the left and right y-axis, respectively. Each data point represents the mean±SD of at least duplicate measurements from a representative experiment performed in duplicate. B. Representative images from Movie S1 showing an intact β cell at 5 h (white arrow) in contact with the filopodia of an infected eGFP+ cell (red arrow), turning eGFP+ at 8 h and subsequently emanating filopodia at 11 h before dying (Cytotox Red+) at 16 h. Scale bar: 30 μm. C. Eccentricity of infected vs. non-infected ECN90 β cells (300 MOI). Each point represents the mean±SD of 8 images, p<0.01 at all time points (barring 2 h) by unpaired Student’s t test. D. Representative immunofluorescence images from pancreas tissue sections of T1D donor 6243 stained for VP1 (green) and DAPI (blue), alone (top) or after merging with insulin staining (red, bottom). Scale bar: 50 μm. E-F-G. Comparison of VP1 vs. VP1+ β-cell area (E), perimeter (F) and diameter (G) in pancreas tissue sections stained as above. Each point represents a β cell from sections obtained from 3 T1D donors; bars represent mean+SEM values. ***p≤0.0004 by unpaired Student’s t test. H. CVB-reactive TCRs sequenced and re-expressed in carrier cells. I. CVB11356–1364-reactive TCR activation in NFAT-driven ZsGreen fluorescent reporter, TCR-transduced 5KC cells upon an 18-h co-culture with CVB3-infected (green; 300 MOI) vs. mock-infected ECN90 β cells (blue), plotted as mean ± 95% confidence interval of triplicate wells from a representative experiment performed in duplicate. A parallel dose-response curve with increasing peptide concentrations pulsed on non-infected β cells (black) estimated the concentration of peptide recognized on CVB-infected β cells to 2.7 nM. J. Negative control TCR recognizing the CVB11246–1254 peptide (not eluted from β cells) transduced into the same reporter 5KC cells and co-cultured as above, depicted as in panel I.
Figure 7.
Figure 7.. Infected β cells are more efficiently killed by CVB than by CVB-reactive T cells.
A-B. Representative real-time images from Movie S4A-B (taken at 300 MOI, 1:1 T:β-cell ratio) showing (A) CVB-killed β cells detected by single-cell analysis mask and (B) β cells killed by CVB TCR-transduced CD8+ T cells, detected by cluster analysis mask. β cells and dead cells were labeled with CellTracker Red and Cytotox Green dye, respectively; dead β cells are therefore labeled in yellow. Scale bar: 30 μm. CVB-killed single β cells counted in the absence of T cells and T-cell-killed cluster β cells counted in the absence of CVB after peptide pulsing are shown in Movies S2-S3, respectively. C. ECN90 β cells were stained as above and infected with CVB at the indicated MOIs. Curves display the percent CVB-killed single β-cell area (top) and the percent T-cell-killed cluster β-cell area (bottom) at the indicated T:β-cell ratios over a 48-h real-time imaging acquisition. β-cell areas are expressed as median percent of total β-cell area from at least duplicate wells, normalized to the 8-h time point. A representative experiment out of 2 performed is displayed. D. Correlation analysis between the percent CVB-killed single β-cell area and the percent T-cell-killed cluster β-cell area from the same experiment depicted in (C) during the last 24 h of acquisition. Further details are provided in Fig. S8. E. Schematic of the low-grade infection protocol. ECN90 β cells were incubated with CVB3-eGFP for 1 h, followed by washing and culture for 72 h, with washes to remove free virions, cell sampling for flow cytometry and medium replenishment every 24 h. F. Percent CVB3-eGFP+ adherent ECN90 β cells detected at 24 and 48 h at different MOIs. G-H. Percent viable adherent cells (G) and HLA-I MFI (H) in CVB3-eGFP+ adherent cells from the same experiment. Each point represents the mean of duplicate measurements from a representative experiment. For panels F and H, some time points are not depicted due to the low number of remaining viable cells. I-J. Percent T-cell-killed cluster β-cell area following infection for 1 h at the indicated MOIs, washing, 24-h culture and real-time imaging after addition of CVB11356–1364 (I) or PPI15–24 (J) TCR-transduced CD8+ T cells at a 1:1 T:β cell ratio. β-cell areas are expressed as median percent of total β-cell area from at least duplicate wells of a representative experiment, normalized at the 24-h time point. Symbol legends are the same as in panel E (depicted in different colors for panel J). K. IFN-γ secretion at the indicated MOIs and T-cell/β-cell co-culture conditions. Each point represents the mean of duplicate measurements from the experiment depicted in panels I-J.

References

    1. Carré A., Vecchio F., Flodstrom-Tullberg M., You S., and Mallone R. (2023). Coxsackievirus and type 1 diabetes: diabetogenic mechanisms and implications for prevention. Endocr Rev 44, 737–751. 10.1210/endrev/bnad007. - DOI - PubMed
    1. Gillespie K.M., Bain S.C., Barnett A.H., Bingley P.J., Christie M.R., Gill G.V., and Gale E.A. (2004). The rising incidence of childhood type 1 diabetes and reduced contribution of high-risk HLA haplotypes. Lancet 364, 1699–1700. 10.1016/S0140-6736(04)17357-1. - DOI - PubMed
    1. Patterson C.C., Harjutsalo V., Rosenbauer J., Neu A., Cinek O., Skrivarhaug T., Rami-Merhar B., Soltesz G., Svensson J., Parslow R.C., et al. (2019). Trends and cyclical variation in the incidence of childhood type 1 diabetes in 26 European centres in the 25 year period 1989–2013: a multicentre prospective registration study. Diabetologia 62, 408–417. 10.1007/s00125-018-4763-3. - DOI - PubMed
    1. Ziegler A.G., Bonifacio E., and Babydiab-Babydiet Study Group. (2012). Age-related islet autoantibody incidence in offspring of patients with type 1 diabetes. Diabetologia 55, 1937–1943. 10.1007/s00125-012-2472-x. - DOI - PubMed
    1. Parikka V., Nanto-Salonen K., Saarinen M., Simell T., Ilonen J., Hyoty H., Veijola R., Knip M., and Simell O. (2012). Early seroconversion and rapidly increasing autoantibody concentrations predict prepubertal manifestation of type 1 diabetes in children at genetic risk. Diabetologia 55, 1926–1936. 10.1007/s00125-012-2523-3. - DOI - PubMed

Publication types