[Preprint]. 2024 Dec 19:2023.08.25.554832.
doi: 10.1101/2023.08.25.554832.

Niche-specific macrophage loss promotes skin capillary aging

Affiliations

Niche-specific macrophage loss promotes skin capillary aging

Kailin R Mesa et al. bioRxiv. .

Update in

Abstract

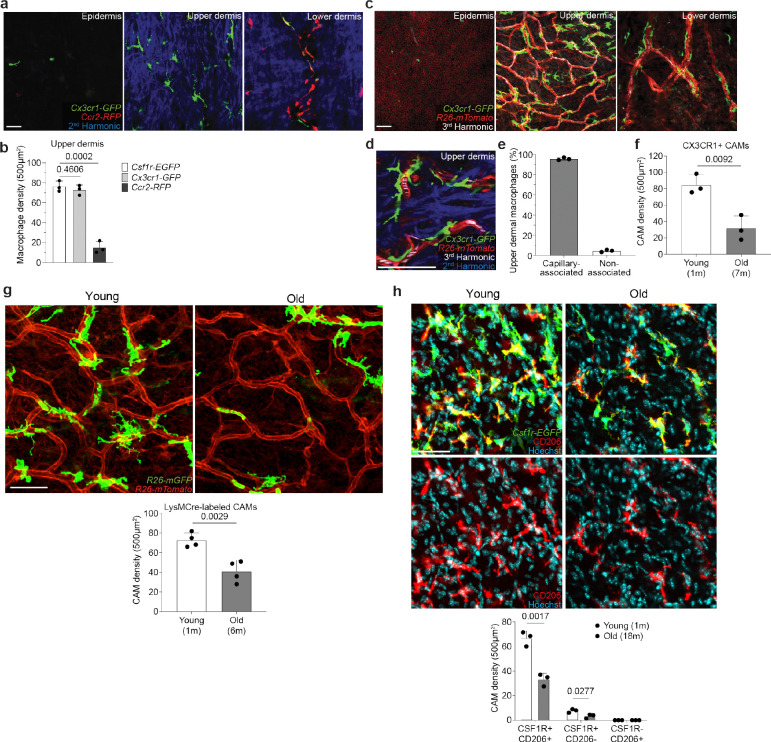
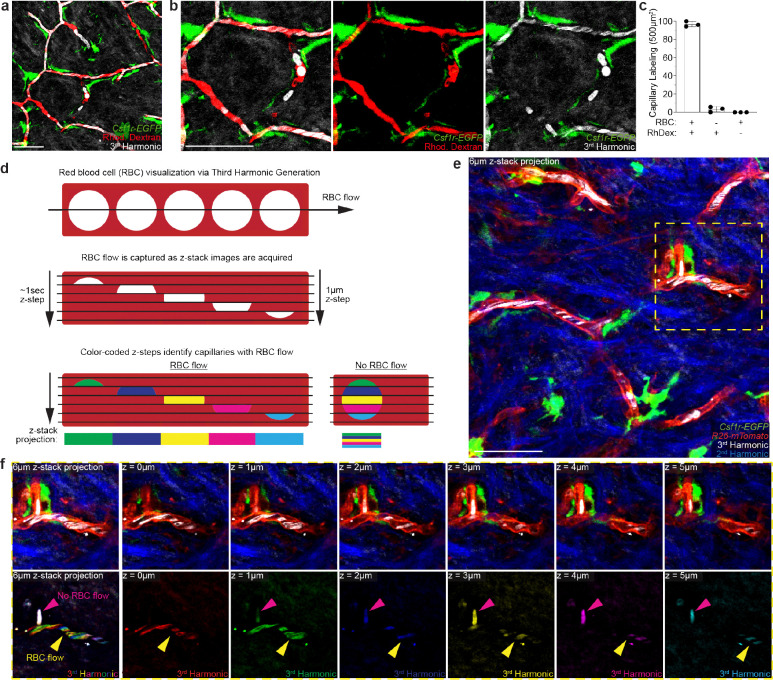
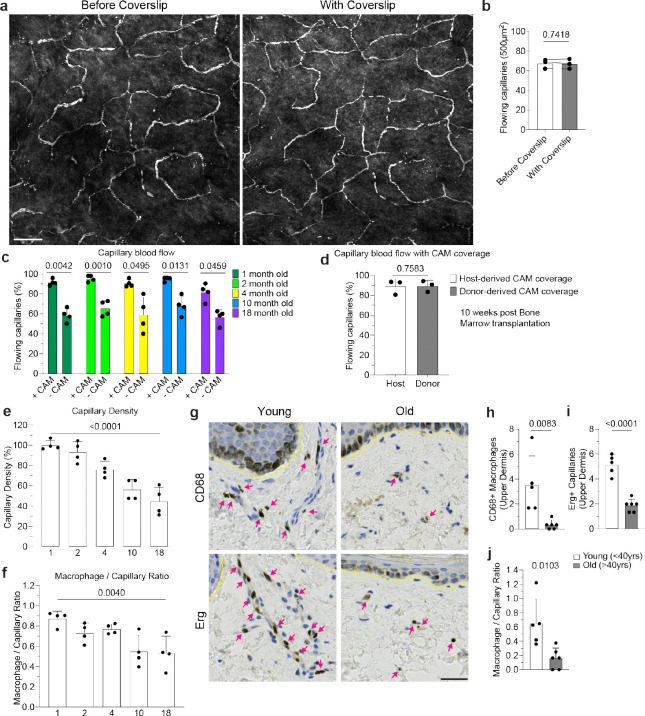
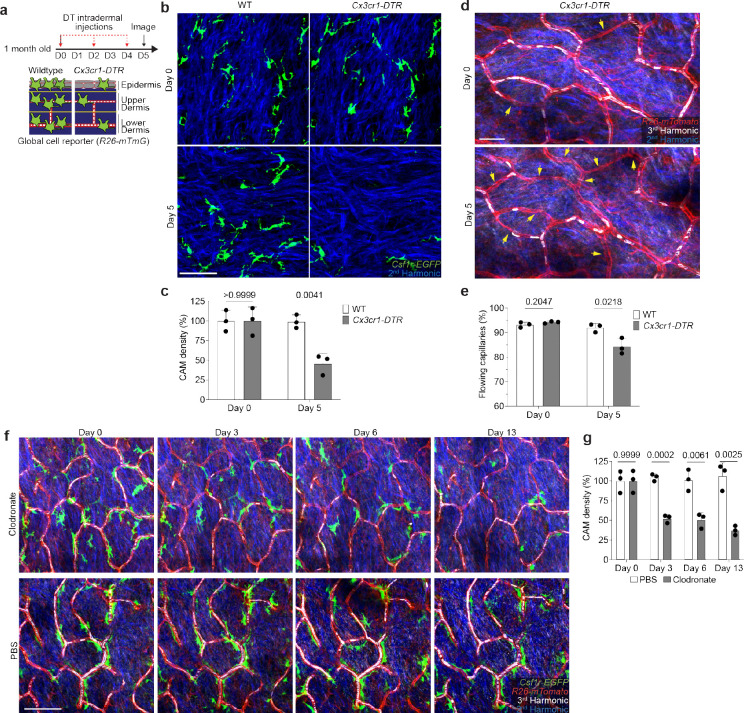
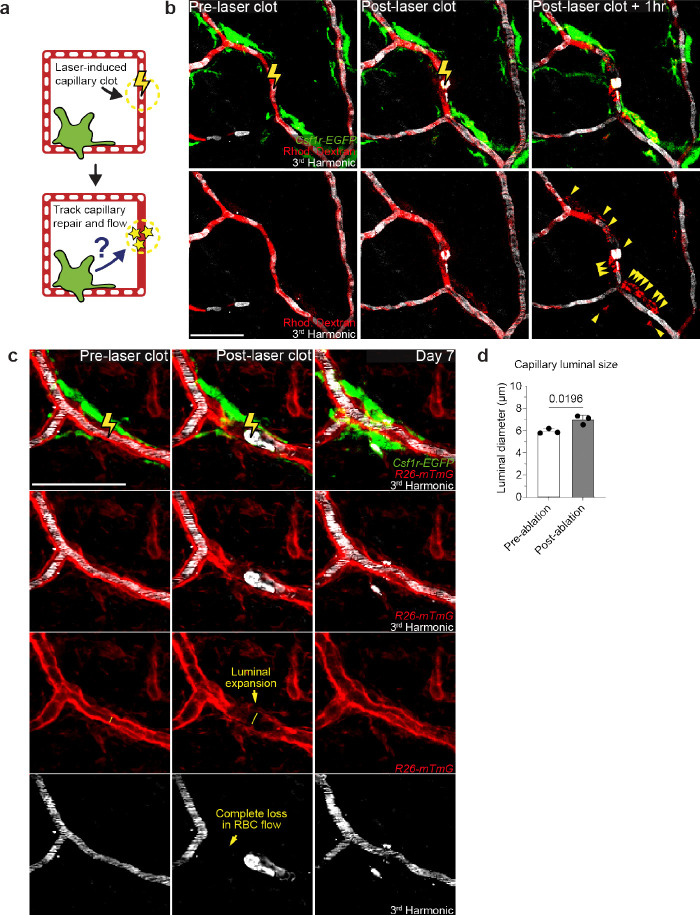
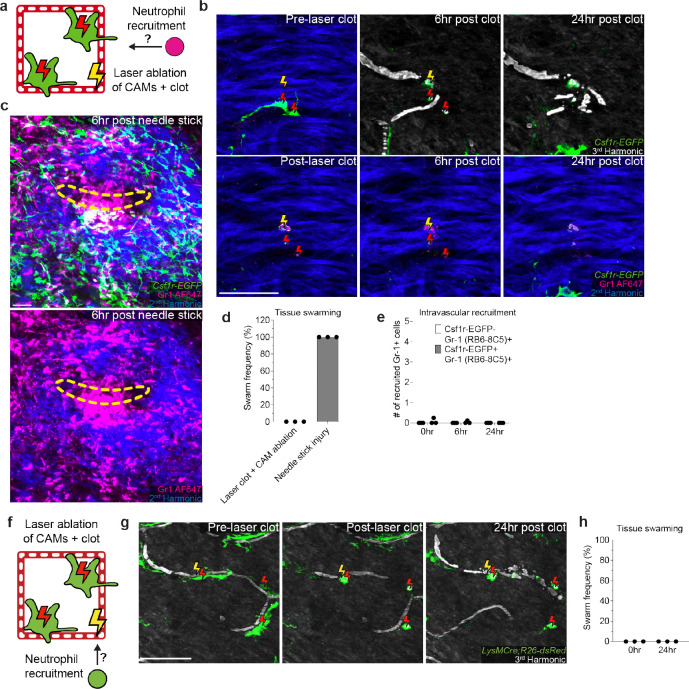
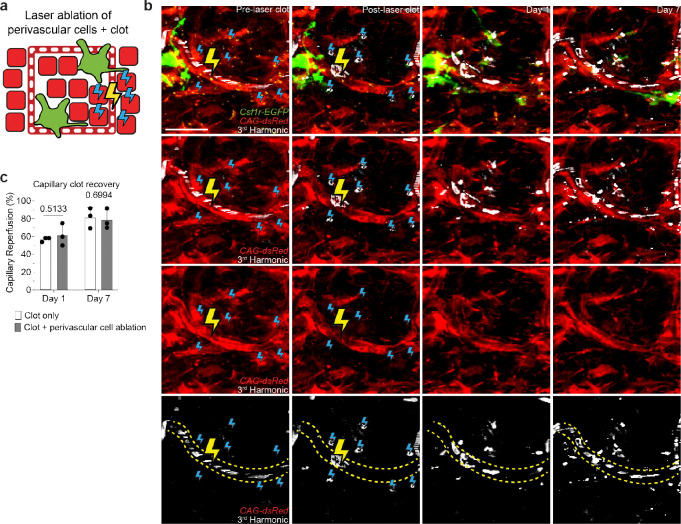
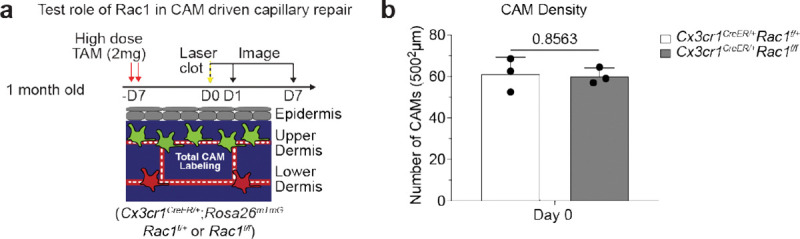
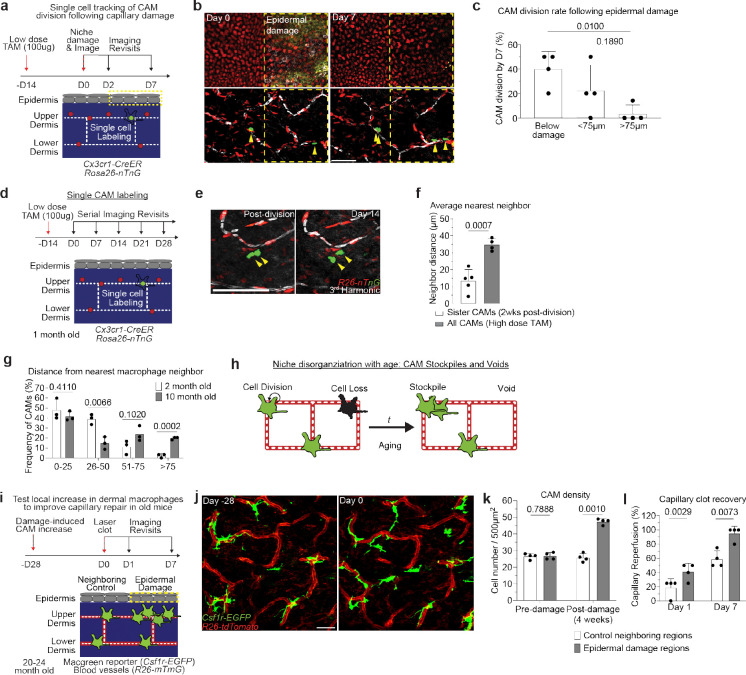
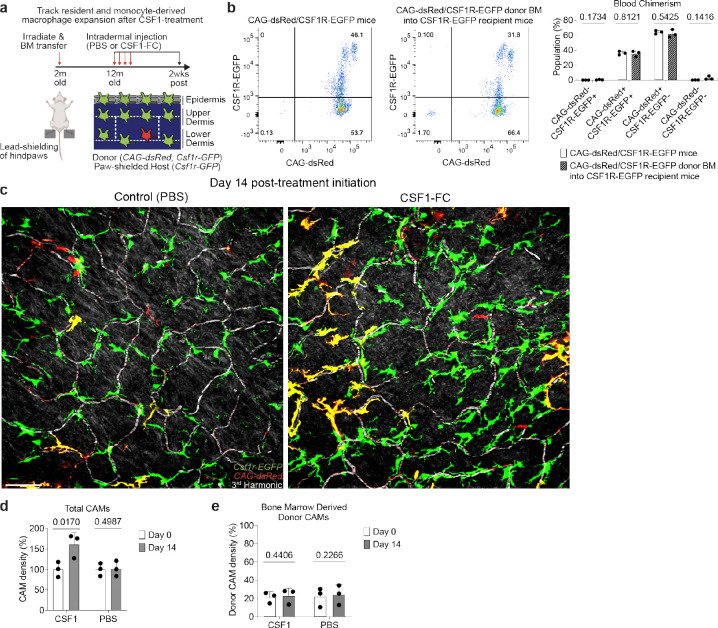
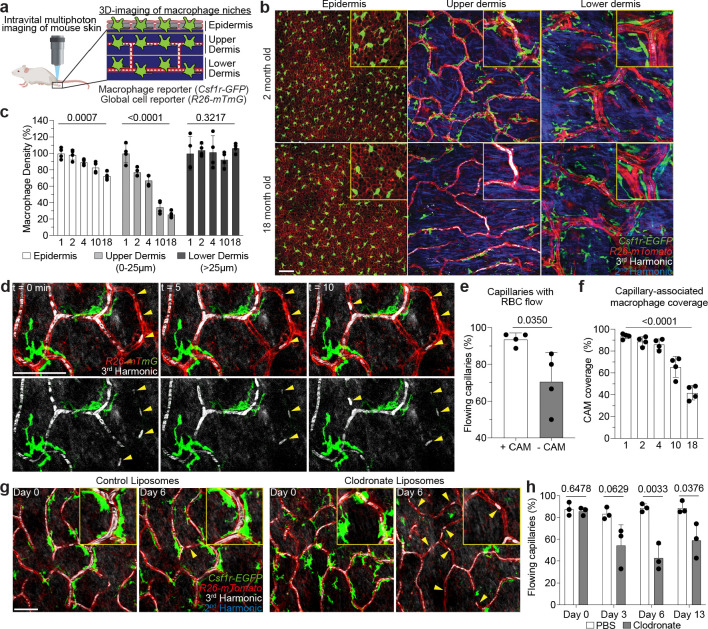
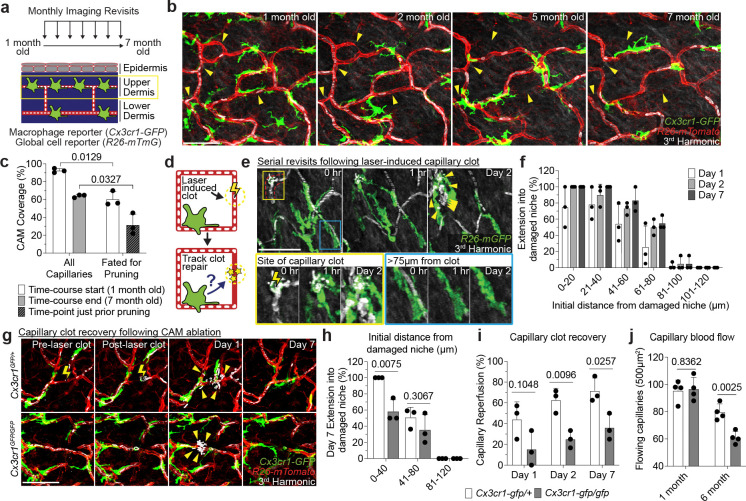
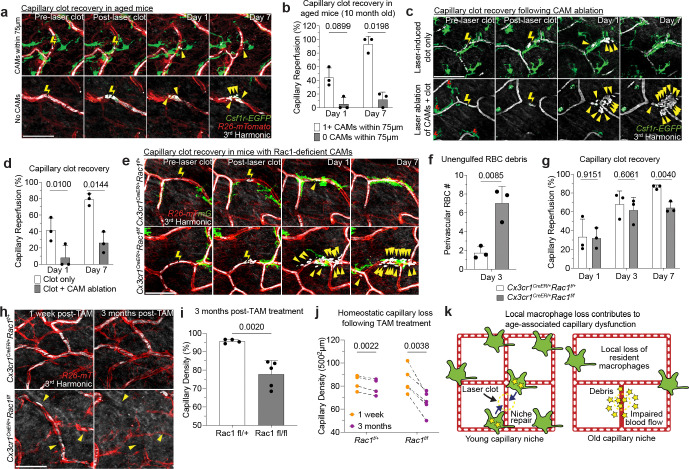
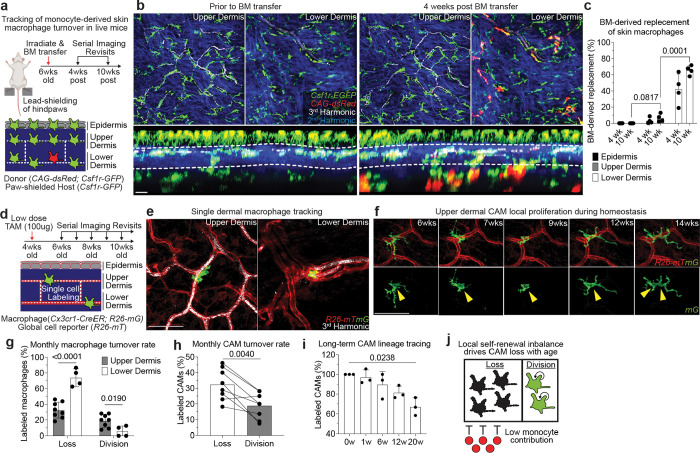
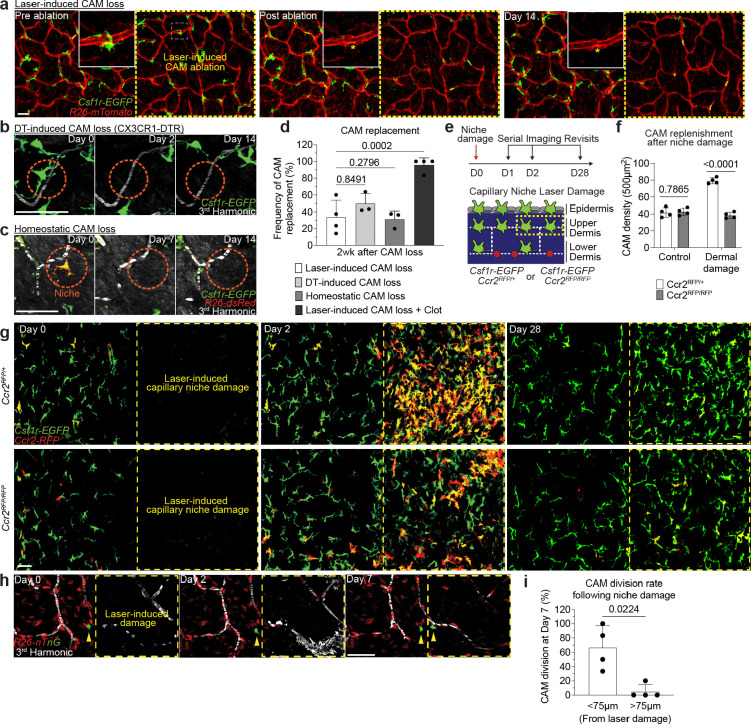
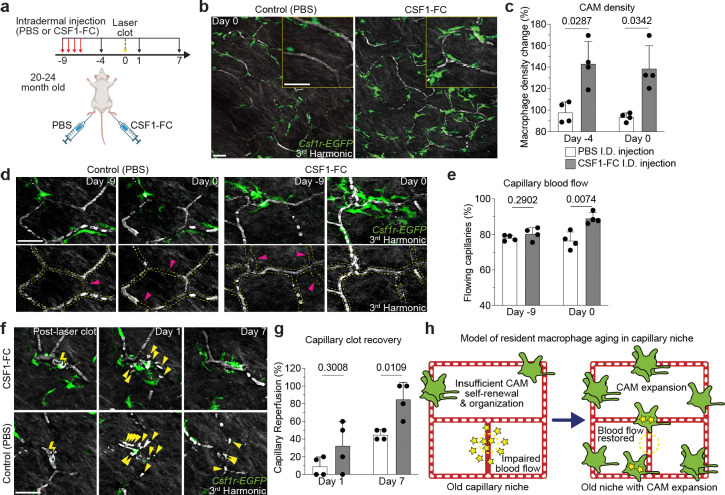
All mammalian organs depend upon resident macrophage populations to coordinate repair processes and facilitate tissue-specific functions1-3. Recent work has established that functionally distinct macrophage populations reside in discrete tissue niches and are replenished through some combination of local proliferation and monocyte recruitment4,5. Moreover, decline in macrophage abundance and function in tissues has been shown to contribute to many age-associated pathologies, such as atherosclerosis, cancer, and neurodegeneration6-8. Despite these advances, the cellular mechanisms that coordinate macrophage organization and replenishment within an aging tissue niche remain largely unknown. Here we show that capillary-associated macrophages (CAMs) are selectively lost over time, which contributes to impaired vascular repair and tissue perfusion in older mice. To investigate resident macrophage behavior in vivo, we have employed intravital two-photon microscopy to non-invasively image in live mice the skin capillary plexus, a spatially well-defined model of niche aging that undergoes rarefication and functional decline with age. We find that CAMs are lost with age at a rate that outpaces that of capillary loss, leading to the progressive accumulation of capillary niches without an associated macrophage in both mice and humans. Phagocytic activity of CAMs was locally required to repair obstructed capillary blood flow, leaving macrophage-less niches selectively vulnerable to both homeostatic and injury-induced loss in blood flow. Our work demonstrates that homeostatic renewal of resident macrophages is not as finely tuned as has been previously suggested9-11. Specifically, we found that neighboring macrophages do not proliferate or reorganize sufficiently to maintain an optimal population across the skin capillary niche in the absence of additional cues from acute tissue damage or increased abundance of growth factors, such as colony stimulating factor 1 (CSF1). Such limitations in homeostatic renewal and organization of various niche-resident cell types are potentially early contributors to tissue aging, which may provide novel opportunities for future therapeutic interventions.

Keywords: Aging; Blood Capillaries; Intravital Microscopy; Resident Macrophages; Tissue Repair.


Figures

Extended Data Figure 1.
Extended Data Figure 1.. Upper dermal macrophages are capillary-associated and decline in density with age.
a, Representative images of cells expressing Ccr2-RFP, Csf1r-EGFP, or Cx3cr1-GFP in the epidermis, upper dermis, and lower dermis of 1 month old mice. b, Quantifications of cells expressing Csf1r-EGFP, Cx3cr1-GFP, or Ccr2-RFP, in the upper dermis (n = 3 mice in each group; two 500μm2 regions per mouse; Cell number (Csf1r-EGFP vs Cx3cr1-GFP; Csf1r-EGFP vs Ccr2-RFP) was compared by unpaired Student’s t test; mean ± SD). c, Visualization of CX3CR1-expressing cells in all skin layers: epidermis, upper dermis, and lower dermis (Cx3cr1-GFP;R26-mTmG) was performed during homeostatic conditions. d, Representative image of labeled upper dermal macrophages in contact with capillary superficial plexus (red) in 1 month old mice. e, Quantifications reveal most upper dermal macrophages are capillary-associated macrophages (CAMs) (n = 3 mice in total; three 500μm2 regions per mouse; mean ± SD). f, Quantifications of cells expressing Cx3cr1-GFP in the upper dermis (n = 3 mice in each group; two 500μm2 regions per mouse; CAM density (1 vs 7-month-old) was compared by unpaired Student’s t test; mean ± SD). g, Representative optical sections of CAMs in young (1-month-old) and old (6-month-old) LysM-Cre;R26-mTmG mice. Quantifications of membrane-GFP+ cells in the upper dermis (n = 4 mice in each group; two 500μm2 regions per mouse; CAM density (1 vs 6-month-old) was compared by unpaired Student’s t test; mean ± SD). h, Representative upper dermal optical sections from whole mount skin samples of young (1-month-old) and old (18-month-old) Csf1r-EGFP mice stained with AF647 anti-mouse CD206 (clone C068C2) antibody. Quantifications for CD206 and CSF1R co-expression in the upper dermis (n = 3 mice in each group; two 500μm2 regions per mouse; CAM density (1 vs 18-month-old) was compared by unpaired Student’s t test; mean ± SD). Scale bar, 50 μm.
Extended Data Figure 2.
Extended Data Figure 2.. Label-free in vivo visualization of capillary blood flow via third harmonic effect generated by red blood cells.
a-b, Simultaneous visualization of blood flow through the superficial capillary plexus via third harmonic generation (white) from red blood cells (RBC) and intravenous rhodamine dextran (RhDex) (red). c, Quantifications of RBC and RhDex labeling of the upper dermal superficial capillary plexus (n = 3 mice in total; four 500μm2 regions per mouse; mean ± SD). d, Scheme of red blood cell (RBC) flow through a segment of the superficial skin capillary network. During three-dimensional image acquisition, flowing red blood cells are captured at different x,y positions for each z-section along the capillary segment. Pseudo coloring each z-step through a capillary segment distinguishes flowing RBCs as a multicolor patchwork or rainbow-effect and leaves obstructed/non-flowing RBCs as white (full overlap of all colors). e, Representative image of RBC visualization in the upper dermis in Csf1r-EGFP; R26-mTmG mice. f, Representative optical z-sections through upper dermal capillaries. Third harmonic signal is pseudo colored differently for each z-step to visualize RBC movement along the capillary segments during image acquisition. Scale 50μm.
Extended Data Figure 3.
Extended Data Figure 3.. Capillary flow and associated macrophage loss in mice and humans.
a, Representative images of capillary blood flow in WT mice before and after placement of a coverslip on top of hind paw skin of 6 month old mice. b, Quantification of capillary blood flow (n = 3 mice in total; two 500μm2 regions per mouse; capillary blood flow (Before Coverslip vs With Coverslip) was compared in the same imaging areas by paired Student’s t test; mean ± SD). c, Quantification of capillaries with blood flow as measured by stalled RBCs as described in Extended Data Figure 2 in 1, 2-, 4-, 10-, and 18-month-old mice (n = 878 CAM+ capillary segments, n = 215 CAM− capillary segments; n = 4 mice in each age group; capillary blood flow (CAM+ vs CAM−) was compared by paired Student’s t test; mean ± SD). d, Quantification of capillaries with blood flow in in bone marrow chimeras with Csf1r-GFP;CAG-dsRed bone marrow transferred into lethally irradiated Csf1r-GFP mice (n = 207 host-derived CAM+ capillary segments, n = 79 donor-derived CAM+ capillary segments; n = 3 mice in total; CAM+ capillary blood flow (Host-derived vs Donor-derived) was compared by paired Student’s t test; mean ± SD). e,f Quantification of capillary niche age-associated changes, (e) Capillary density and (f) CAM / Capillary segment ratio (n = 4 mice in each age group; two 500μm2 regions per mouse; comparison across age groups was by one-way ANOVA; mean ± SD). g, Representative immunohistochemistry of CD68+ macrophage and Erg+ capillary density in the upper dermis of both young (<40y) and old (>40y) human samples. h-j, Quantification of capillary niche age-associated changes: (h) CD68+ macrophage density, (i) Erg+ capillary density, (j) Upper dermal macrophage / Capillary endothelium ratio (n = 5 patient samples in each group; three imaging regions per sample; Comparison by unpaired Student’s t test; mean ± SD). Scale bar, 50μm.
Extended Data Figure 4.
Extended Data Figure 4.. Impaired skin capillary blood flow following acute macrophage depletion.
a, Scheme of capillary blood flow tracking following intraperitoneal injection every other day with diphtheria toxin (DT) (25ng/g body weight in PBS) in both Cx3cr1-DTR; R26-mTmG and WT control (R26-mTmG) mice. b, Representative revisits of the same upper dermal capillary niches to visualize CAMs (Csf1r-EGFP) and dermal collagen (Second Harmonic). c, Quantifications reveal a significant reduction in CAM density following DT-treatment (n = 3 mice in each group; two 500μm2 regions per mouse; CAM density (WT vs Cx3cr1-DTR) was compared for Day 0 and Day 5 time points by unpaired Student’s t test; mean ± SD). d, Representative revisits of the same capillary network to visualize capillaries (R26-mTmG) and RBC flow (Third Harmonic). e, Quantifications reveal a significant reduction in the percentage of capillaries with blood flow following DT-induced cell depletion (n = 3 mice in each group; two 500μm2 regions per mouse; obstructed capillary flow (WT vs Cx3cr1-DTR) was compared for Day 0 and Day 5 time points by unpaired Student’s t test; mean ± SD). f, Representative images demonstrate macrophage depletion following intradermal injections of clodronate-liposomes every 3 days. Repeated intravital imaging of the vascular niche was performed to visualize macrophages (Csf1r-GFP), capillaries (R26-mTmG) and RBC flow (Third Harmonic). g, Quantification of CAM density following macrophage depletion (n = 3 mice in each group; two 500μm regions per mouse; CAM density (clodronate vs PBS) was compared by unpaired Student’s t test; mean ± SD). Scale bar, 50 μm.
Extended Data Figure 5.
Extended Data Figure 5.. Laser-induced model of acute capillary clot formation and repair.
a, Scheme of laser-induced capillary clot experiment. b, Sequential revisits of damaged capillary niche after laser-induced clot formation in Csf1r-EGFP mice. Simultaneous visualization of blood flow before and after clot formation via third harmonic generation (white) from red blood cells (RBC) and intravenous rhodamine dextran (RhDex) (red). Yellow lightning bolt indicates site of laser-induced capillary clot. Yellow arrowheads indicate extra-luminal vascular debris. c, Sequential revisits of damaged capillary niche after laser-induced clot formation in Csf1r-EGFP;R26-mTmG mice. Capillary clot formation (yellow lightning bolt) was performed at 940nm for 1s in 4-month-old mice. d, Quantification of capillary lumen diameter before and immediately after laser-induced clotting (n = 24 capillary clots; 3 mice in total; capillary luminal diameter (pre-ablation vs post-ablation) was compared by paired Student’s t test; mean ± SD). Scale bar, 50 μm.
Extended Data Figure 6.
Extended Data Figure 6.. Laser-induced clots and CAM ablations do not recruit neutrophil swarms.
a, Scheme of tracking neutrophil recruitment and swarming after laser-induced capillary clot experiment. b-c, (b) Sequential revisits of damaged capillary niche after laser-induced CAM ablation and clot formation or (c) large non-sterile tissue damage (28-gauge needle stick) in Csf1r-EGFP mice with intravenous neutrophil antibody labeling (Gr-1, clone RB6–8C5). Macrophage laser ablation (red lightning bolt) and capillary clot formation (yellow lightning bolt) were both performed at 940nm for 1s. Needle injury (yellow dashed line) was performed through epidermis and dermis. d, Quantification of neutrophil swarming at 6 hours tissue damage (n = 16 capillary clots in CAM ablated regions, n = 9 needle injuries; 3 mice in each group; mean ± SD). e, Quantification of intravascular recruitment of neutrophil and monocyte populations at 0, 6, and 24 hours post laser-induced capillary clotting in CAM ablated regions (n = 16 capillary clots in CAM ablated regions, 3 mice in total; mean ± SD). f, Scheme of tracking neutrophil recruitment and swarming after laser-induced capillary clot experiment. g, Sequential revisits of damaged capillary niche after laser-induced CAM ablation and clot formation in LysMCre;R26-dsRed mice. Macrophage laser ablation (red lightning bolt) and capillary clot formation (yellow lightning bolt) were both performed at 940nm for 1s. h, Quantification of neutrophil swarming at 6 hours tissue damage (n = 32 capillary clots in CAM ablated regions; 3 mice in total; mean ± SD). Scale bar, 50 μm.
Extended Data Figure 7.
Extended Data Figure 7.. Laser ablation of non-macrophage perivascular dermal cells does not impair capillary clot repair and reperfusion.
a, Scheme of laser-induced capillary clot experiment. b, Sequential revisits of damaged capillary niche after laser-induced perivascular dermal cell ablation and clot formation in Csf1r-EGFP;CAG-dsRed mice. Perivascular dermal cell laser ablation (blue lightning bolt) and capillary clot formation (yellow lightning bolt) were both performed at 940nm for 1s. c, Quantification of capillary reperfusion at Day 1 and 7 after laser-induced clotting and perivascular cell ablation (n = 34 capillary clots in CAM ablated regions, n = 37 capillary clots in control regions; 3 mice in total; capillary reperfusion (perivascular dermal cell ablation vs control) was compared by paired Student’s t test; mean ± SD). Scale bar, 50 μm.
Extended Data Figure 8.
Extended Data Figure 8.. CAM density in mice with deficiencies in macrophage phagocytic machinery.
a, Scheme of laser-induced capillary clot in Cx3cr1CreER;Rac1fl/fl and Cx3cr1CreER;Rac1fl/+ mice. b, Quantification of CAM density at Day 7 after laser-induced clotting (n = 3 mice in each group; two 500μm2 regions per mouse; CAM density (Rac1fl/+ vs Rac1fl/fl) was compared at day 0 (same day of clot induction) by unpaired Student’s t test; mean ± SD).
Extended Data Figure 9.
Extended Data Figure 9.. CAM loss and disorganization is partially restored by local epidermal damage to improve capillary repair in old mice.
a, Scheme of tracking of CAM proliferation following laser-induced damage to nearby capillary or epidermal niches. b, Representative revisits of single macrophage lineage tracing in Cx3cr1-CreERT2; R26-nTnG mice following epidermal damage. c, Quantification of CAM proliferation based on proximity to epidermal damage (n = 25 CAMs tracked in capillary damage regions, n = 56 CAMs tracked in epidermal damage regions; 4 mice in each group; CAM proliferation (based on damage proximity) was compared at day 7 by paired Student’s t test; mean ± SD). d, Scheme of long-term tracking of CAM migration following cell division. e, Representative revisits of single macrophage lineage tracing in Cx3cr1-CreERT2; R26-nTnG mice. Weekly revisits were performed during homeostatic conditions for 5 weeks following a single low-dose intraperitoneal injection of tamoxifen (50μg). f, Quantification of neighboring CAM distance of recently divided sister CAMs was compared to total CAM neighboring distance from Cx3cr1-CreERT2; R26-nTnG mice given a single high-dose intraperitoneal injection of tamoxifen (4mg) (n = 26 sister CAM pairs, from 5 mice in low-dose group; n = 188 CAMs, from 4 mice in high-dose group; Average nearest neighbor distance (2 vs 10 month old) was compared at 0–25, 26–50, 51–75, and >75μm intervals by unpaired Student’s t test mean ± SD). g, Quantification of distance between nearest CAM neighbors in 2- and 10-month-old Csf1r-EGFP mice (n = 90 CAMs in 2-month-old mice, n = 101 CAMs in 10-month-old mice; 3 mice in each age group; Frequency of CAM distribution (2 vs 10 month old) was compared at 0–25, 26–50, 51–75, and >75μm intervals by unpaired Student’s t test; mean ± SD). h, Working model of macrophage renewal and organization in the skin aging capillary niche. i, Scheme of local damage-induced expansion of CAMs in the aged capillary niche. j, Representative images of CAM density in Csf1r-EGFP; R26-mTmG mice 28 days following overlaying epidermal laser damage. k, Quantification of CAM density following overlaying epidermal damage (n = 4 mice in total; two 500μm2 regions for both epidermal damage and control conditions per mouse; CAM density (Epidermal damage vs Control) was compared by paired Student’s t test; mean ± SD). l, Quantification of capillary reperfusion at day 1 and 7 after laser-induced clotting (n = 17 capillary clots in epidermal damage regions, n = 17 capillary clots in neighboring control regions; 4 mice in total; capillary reperfusion (with epidermal damage vs control) was compared at day 1 and day 7 by paired Student’s t test; mean ± SD). following laser-induced damage to overlaying epidermal niche. Scale bar, 50μm.
Extended Data Figure 10.
Extended Data Figure 10.. Intradermal CSF1 treatment locally expands CAM populations in old mice.
a, Scheme of serial imaging of skin resident macrophage repopulation in bone marrow chimeras with Csf1r-GFP;CAG-dsRed bone marrow transferred into lethally irradiated Csf1r-GFP mice following CSF1-treatment. Note hind paws of these mice were lead-shielded to prevent irradiation-induced loss of resident macrophage populations from our imaging area. b, Quantification of blood chimerism 10 months after Csf1r-GFP;CAG-dsRed bone marrow transfer into lethally irradiated Csf1r-GFP mice (n = 3 mice in each group; Percentage of cells from blood (Csf1r-GFP;CAG-dsRed mice vs bone marrow transferred mice) was compared for dsRed−/GFP+, dsRed+/GFP+, dsRed+/GFP−, dsRed−/GFP− populations by unpaired Student’s t test; mean ± SD). c, Representative images of CAM density 14 days following daily intradermal injections (4 days) of CSF1-Fc (porcine CSF1 and IgG1a Fc region fusion protein) and PBS in contralateral hind paws of 12-month-old mice. d, Quantification of capillary-associated macrophage density following CSF1-Fc or PBS treatment (n = 3 mice in total; two 500μm2 regions of each treatment condition per mouse; Percentage of CAM density change (Day 0 vs 14) was compared for CSF1-Fc and PBS regions by paired Student’s t test; mean ± SD). e, Quantification of donor bone marrow-derived (GFP+/dsRed+) CAM density following CSF1-Fc or PBS treatment (n = 3 mice in total; two 500μm2 regions of each treatment condition per mouse; Percentage of donor bone marrow-derived CAM density change (Day 0 vs 14) was compared for CSF1-Fc and PBS regions by paired Student’s t test; mean ± SD). Scale bar, 50μm.
Figure 1 –
Figure 1 –. Niche-specific macrophage loss with age correlates with impaired skin capillary blood flow.
a, Schematic of intravital imaging of resident macrophage populations in mouse skin, indicating epidermal and dermal populations, using the macrophage reporter, Csf1r-EGFP, in combination with an Actb-driven universal tdTomato reporter, R26-mTmG. b, Representative optical sections of distinct resident macrophage populations in young (2-month-old) and old (18-month-old) mice. c, Quantification of niche-specific macrophage density change in 1, 2, 4, 10, and 18 month old mice (n = 4 mice in each age group; two 500μm2 regions per mouse; macrophage density in each skin niche was compared across age groups by one-way ANOVA; mean ± SD). d, Skin resident macrophage labeling using Cx3cr1-CreERT2;R26-mTmG mice was performed following a single high-dose intraperitoneal injection of tamoxifen (2mg) in 1 month old mice. Single optical sections at successive time points 5 min apart showing red blood cell (RBC) flow (white) in capillaries (red) with or without nearby CAMs (green). Yellow arrowheads indicate obstructed RBC capillary flow. e, Quantification of capillaries with blood flow as measured by stalled RBCs as described in Extended Data Figure 2 (n = 226 CAM+ capillary segments, n = 27 CAM− capillary segments; n = 4 mice; capillary blood flow (CAM+ vs CAM−) was compared by paired Student’s t test; mean ± SD). f, Percentage of capillary segments with at least one associated macrophage (n = 4 mice in each age group; two 500μm2 regions per mouse; macrophage association with capillary segments was compared across age groups by one-way ANOVA; mean ± SD). g, Representative images demonstrate macrophage depletion following intradermal injections of clodronate-liposomes every 3 days. Repeated intravital imaging of the vascular niche was performed to visualize macrophages (Csf1r-GFP), capillaries (R26-mTmG) and RBC flow (Third Harmonic). h, Percentage of capillaries with blood flow following macrophage depletion (n = 194 capillary segments in clodronate group, n = 199 capillary segments in PBS group; 3 mice in each group; capillary flow (clodronate vs PBS) was compared by unpaired Student’s t test; mean ± SD). Scale bar, 50 μm.
Figure 2 –
Figure 2 –. Local recruitment of CAMs is required to restore capillary blood flow.
a, Scheme of long-term serial imaging of capillary niche in Cx3cr1-GFP;R26-mTmG mice. b, Sequential revisits reveal progressive pruning of capillary niche over a 6-month period. Yellow arrowheads indicate capillaries that will undergo pruning. c, Quantification of capillary-associated macrophage coverage at 1 and 7 months of age (n = 3 mice; three 500μm2 regions per mouse; Frequency of macrophage association with capillary segments was compared between capillaries fated for pruning and all capillaries at 1- and 7-month-old time-points by paired Student’s t test; mean ± SD). d, Scheme of laser-induced capillary clot experiment. e, Sequential revisits of damaged capillary segment (red dashed lines) after laser-induced clot formation in Cx3cr1-CreERT2;R26-mTmG mice. Yellow lightning bolt indicates site of laser-induced capillary clot. Yellow arrowheads indicate extra-luminal vascular debris. f, Quantification of capillary-associated macrophage extension toward damaged niche at Day 1, 2 and 7 after laser-induced clotting (n = 50 CAMs, in 3 mice; mean ± SD). g, Sequential revisits of damaged capillary niche after laser-induced clot formation (yellow lightning bolt) in Cx3crgfp/+ and Cx3crgfp/gfp mice. CAMs (green), capillaries (red), RBC (white). Yellow arrowheads indicate extra-luminal vascular debris. h, Quantification of capillary-associated macrophage extension toward damaged niche at Day 7 after laser-induced clotting (n = 99 CAMs in Cx3crgfp/+ group; n = 65 CAMs in Cx3crgfp/gfp group; n = 3 mice in each group; CAM extension (Cx3crgfp/+ vs Cx3crgfp/gfp) was compared by unpaired Student’s t test; mean ± SD). i, Quantification of capillary reperfusion at Day 1, 2 and 7 after laser-induced clotting (n = 20 clots in Cx3crgfp/+ group; n = 21 clots in Cx3crgfp/gfp group; n = 3 mice in each group; capillary reperfusion (Cx3crgfp/+ vs Cx3crgfp/gfp) was compared by unpaired Student’s t test; mean ± SD). j, Quantification of capillary blood flow (n = 4 mice in each group; two 500μm2 regions per mouse; capillary blood flow (Cx3crgfp/+ vs Cx3crgfp/gfp) was compared at 1 and 6 months of age by unpaired Student’s t test; mean ± SD). Scale bar, 50μm.
Figure 3 –
Figure 3 –. CAMs are required to clear vascular damage and preserve skin capillaries during aging.
a, Sequential revisits of damaged capillary niche after laser-induced clot formation in Csf1r-EGFP;R26-mTmG mice. Capillary clot formation (yellow lightning bolt) was performed at 940nm for 1s in 10-month-old mice. Yellow arrowheads indicate extra-luminal vascular debris. b, Quantification of capillary reperfusion at day 1 and 7 after laser-induced clotting (n = 16 capillary clots in regions with CAMs (<75μm from clot), n = 16 capillary clots in regions without CAMs (>75μm from clot; 3 mice in total; capillary reperfusion (with CAMs vs without CAMs) was compared at Day 1 and Day 7 by paired Student’s t test; mean ± SD). Scale bar, 50 μm. c, Sequential revisits of damaged capillary niche after laser-induced CAM ablation and clot formation in Csf1r-EGFP mice. Macrophage laser ablation (red lightning bolt) and capillary clot formation (yellow lightning bolt) were both performed at 940nm for 1s. d, Quantification of capillary reperfusion at Day 1 and 7 after laser-induced clotting and macrophage ablation (n = 19 capillary clots in CAM ablated regions, n = 16 capillary clots in control regions; 3 mice in total; capillary reperfusion (CAM ablated vs control) was compared by paired Student’s t test; mean ± SD). e, Sequential revisits of damaged capillary niche after laser-induced clot formation in Cx3cr1CreER;Rac1fl/fl and Cx3cr1CreER;Rac1fl/+ mice. CAMs (green), capillaries (red), RBC (white). f, Quantification of perivascular red blood cell debris at Day 3 after laser-induced clotting (n = 52 clots in Rac1fl/+ group; n = 48 clots in Rac1fl/fl group; n = 3 mice in each group; capillary reperfusion (Rac1fl/+ vs Rac1fl/fl) was compared by unpaired Student’s t test; mean ± SD). g, Quantification of capillary reperfusion at Day 1, 3 and 7 after laser-induced clotting (n = 67 clots in Rac1fl/+ group; n = 82 clots in Rac1fl/fl group; n = 3 mice in each group; capillary reperfusion (Rac1fl/+ vs Rac1fl/fl) was compared by unpaired Student’s t test; mean ± SD). h, Sequential revisits reveal pruning of capillaries over a 3-month period. Yellow arrowheads indicate capillaries that will undergo pruning. i, Quantification of capillary density (n = 4 mice in Rac1fl/ group and 5 mice in Rac1fl/fl group; two 500μm2 regions per mouse; capillary density (Rac1fl/+ vs Rac1fl/fl) was compared at 3 months post tamoxifen treatment by unpaired Student’s t test; mean ± SD). j, Quantification of capillary density (n = 4 mice in Rac1fl/ group and 5 mice in Rac1fl/fl group; two 500μm2 regions per mouse; capillary density (1 week vs 3 months) was compared in Rac1fl/+ and Rac1fl/fl mice by paired Student’s t test; mean ± SD). k, Scheme of age-associated decline of skin capillary niche. Capillary-associated macrophage density declines with age, which predisposes aged capillaries to impaired repair and sustained tissue perfusion. Scale bar, 50μm.
Figure 4 –
Figure 4 –. Dermal macrophages utilize niche-specific self-renewal strategies leading to selective CAM loss with age.
a, Scheme of serial imaging of skin resident macrophage repopulation in bone marrow chimeras with Csf1r-GFP;CAG-dsRed bone marrow transferred into lethally irradiated Csf1r-GFP mice. Note hind paws of these mice were lead-shielded to prevent irradiation-induced loss of resident macrophage populations from our imaging area. b, Representative optical sections of dermal macrophage populations in mice prior to BM transfer and 4 weeks post BM transfer. c, Quantification of macrophage repopulation at 4- and 10-weeks post bone marrow transplantation (n = 4 mice; two 500μm2 regions of each skin compartment per mouse; bone marrow-derived macrophage replacement (percentage of GFP+/dsRed+ macrophages) was compared between skin compartments at 10 weeks post BM transplantation by paired Student’s t test; mean ± SD). d, Scheme of long-term tracking of dermal macrophage self-renewal experiment. e, Representative images in upper and lower dermis of single macrophage tracing in Cx3cr1-CreERT2; R26-mTmG mice. Weekly revisits were performed during homeostatic conditions for 20 weeks following a single low-dose intraperitoneal injection of tamoxifen (50μg). f, Representative serial revisit images of single macrophage tracing in Cx3cr1-CreERT2; R26-mTmG mice. g, Quantification of monthly rate of dermal macrophage loss and division in upper (n = 262 macrophages; 8 mice in total) and lower (n = 42 macrophages; 4 mice in total) dermis; macrophage monthly division and loss rates (upper vs lower dermis) were compared by unpaired Student’s t test; mean ± SD. h,i, Quantification of (h) monthly rate of CAM loss and division (n = 262 CAMs; 8 mice in total; CAM turnover rates (CAM loss vs division) was compared by paired Student’s t test; mean ± SD) and of (i) maintenance of the labeled CAM population over 20wk lineage tracing (n = 59 CAMs; 3 mice in total; number of fluorescently-labeled CAMs was compared across each time point in the same mice by one-way repeated measures ANOVA with Geisser-Greenhouse correction; mean ± SD ). j, Scheme of local self-renewal imbalance drives CAM loss with age. In contrast to lower dermal macrophages, which are continuously replenished by monocytes, CAMs of the upper dermis largely rely of local proliferation. However, the rate of CAM division is insufficient to stably maintain this population with age. Scale bar, 50μm.
Figure 5 –
Figure 5 –. Macrophage loss without local tissue damage is not sufficient to promote CAM renewal.
a, Representative revisits of CAM replacement after laser-induced CAM ablation in Csf1r-EGFP;R26-mTmG mice. Macrophage laser ablations (yellow asterisk) were performed in a 500μm2 region (yellow dashed line square), b, Representative revisits of CAM replacement after a single intraperitoneal injection of diphtheria toxin (25ng/g body weight in PBS) in Cx3cr1-DTR mice. c, Representative revisits of single lineage-tracked macrophages in Cx3cr1-CreERT2; R26-dsRed; Csf1r-EGFP mice. Weekly revisits were performed during homeostatic conditions for 2 weeks following a single low-dose intraperitoneal injection of tamoxifen (50μg). d, Quantification of replenishment rate of empty CAM niche under laser-induced loss (n = 44 CAMs; 4 mice in total), DT-induced loss (n = 53 CAMs; 3 mice in total), homeostatic loss (n = 29 CAMs; 3 mice in total), or laser-induced CAM loss with capillary clot (n = 25 CAMs; 4 mice in total). Frequency of CAM replacement after forced and homeostatic CAM loss were compared by unpaired Student’s t test; mean ± SD. e, Scheme of CAM replacement after capillary niche damage in Csf1r-EGFP; Ccr2RFP/+ or Ccr2RFP/RFP mice. f, Quantification of replenishment rate (Csf1r-EGFP+ cells) of empty CAM niche after laser-induced CAM loss and niche damage (n = 4 mice per group; two 500μm2 regions per mouse; CAM density (Ccr2RFP/+ vs Ccr2RFP/RFP) was compared by unpaired Student’s t test; mean ± SD). g, Representative revisits of CAM replacement after a regional laser-induced damage to the capillary niche. h, Representative revisits of single macrophage lineage tracing in Cx3cr1-CreERT2; R26-nTnG mice following capillary damage. i, Quantification of CAM proliferation based on proximity to capillary damage (n = 25 CAMs tracked in capillary damage regions, 4 mice in each group; CAM proliferation (based on damage proximity) was compared at day 7 by paired Student’s t test; mean ± SD). Scale bar, 50μm.
Figure 6 –
Figure 6 –. Local CAM replenishment in old mice is sufficient to rejuvenate capillary repair and tissue reperfusion.
a, Scheme of CSF1-induced rejuvenation of aged capillary niche. b, Representative images of CAM density in Csf1r-EGFP mice nine days following daily intradermal injections (4 days) of CSF1-Fc (porcine CSF1 and IgG1a Fc region fusion protein) and PBS in contralateral hind paws of 20–24-month-old mice. c, Quantification of CAM density following CSF1-Fc or PBS treatment (n = 4 mice in total; two 500μm2 regions of each treatment condition per mouse; Percentage of CAM density change from Day −9 (CSF1-Fc vs PBS) was compared for Day −4 and Day 0 time points by paired Student’s t test; mean ± SD). d, Representative images of capillary (red dashed lines) blood flow in Csf1r-EGFP mice nine days following daily intradermal injections of CSF1-Fc and PBS in contralateral hind paws of 20–24-month-old mice. Magenta arrowheads indicate obstructed RBC capillary flow. e, Quantification of capillary blood flow following CSF1-Fc or PBS treatment (n = 214 capillary segments in CSF1-Fc treated regions (grey bar graph), n = 214 capillary segments in PBS treated regions (white bar graph); n = 4 mice in total; capillary blood flow (CSF1-Fc vs PBS) was compared for Day −9 and Day 0 time points by paired Student’s t test; mean ± SD). f, Sequential revisits of damaged capillary niche after laser-induced clot formation (yellow lightning bolt) in Csf1r-EGFP mice. Yellow arrowheads indicate extra-luminal vascular debris. g, Quantification of capillary reperfusion at Day 1 and 7 after laser-induced clotting (n = 18 clots in CSF1-Fc group (grey bar graph); n = 20 clots in PBS group (white bar graph); n = 4 mice in total; capillary reperfusion (CSF1-Fc vs PBS) was compared by paired Student’s t test; mean ± SD). h, Working model of resident macrophage aging in the skin capillary niche. Age-associated impairment in capillary repair can be rejuvenated following local expansion of resident macrophage population. Scale bar, 50μm.

References

    1. Nobs S. P. & Kopf M. Tissue-resident macrophages: guardians of organ homeostasis. Trends Immunol 42, 495–507 (2021). - PubMed
    1. Minutti C. M., Knipper J. A., Allen J. E. & Zaiss D. Tissue-specific contribution of macrophages to wound healing. Semin Cell Dev Biol 61, 3–11 (2017). - PubMed
    1. Vannella K. M. & Wynn T. A. Mechanisms of Organ Injury and Repair by Macrophages. Annual Review of Physiology 79, (2016). - PubMed
    1. Chakarov S. et al. Two distinct interstitial macrophage populations coexist across tissues in specific subtissular niches. Science 363, eaau0964 (2019). - PubMed
    1. Wu Y. & Hirschi K. K. Tissue-Resident Macrophage Development and Function. Frontiers Cell Dev Biology 8, 617879 (2021). - PMC - PubMed

Publication types