

This is a preprint.
Higher-Order Dynamics Beyond Repolarization Alternans in Ex-Vivo Human Ventricles are Independent of the Restitution Properties
- PMID: 37662394
- PMCID: PMC10473769
- DOI: 10.1101/2023.08.16.23293853
Higher-Order Dynamics Beyond Repolarization Alternans in Ex-Vivo Human Ventricles are Independent of the Restitution Properties
Update in
-
Complex repolarization dynamics in ex vivo human ventricles are independent of the restitution properties.Europace. 2023 Dec 6;25(12):euad350. doi: 10.1093/europace/euad350. Europace. 2023. PMID: 38006390 Free PMC article.
Abstract
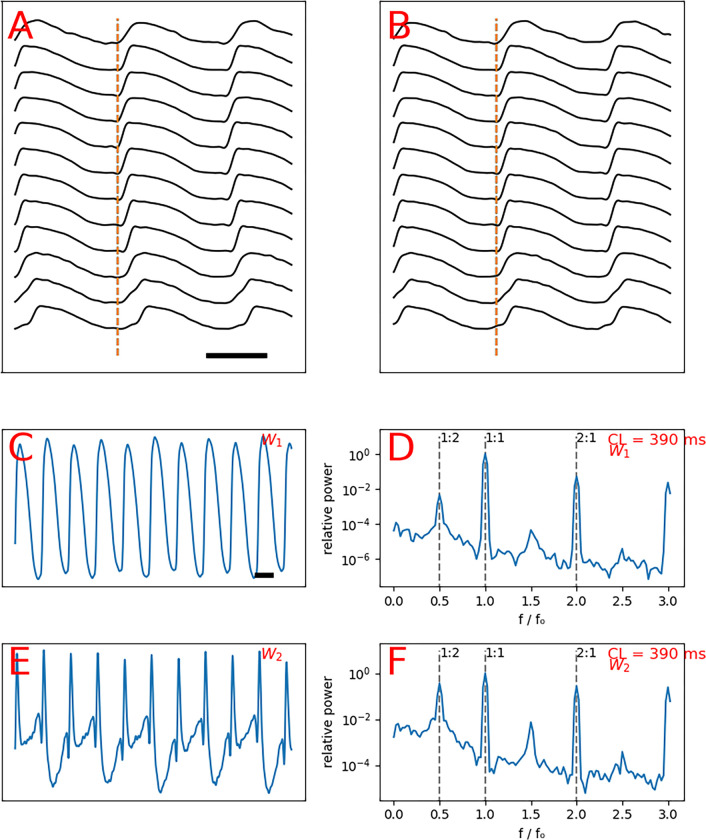
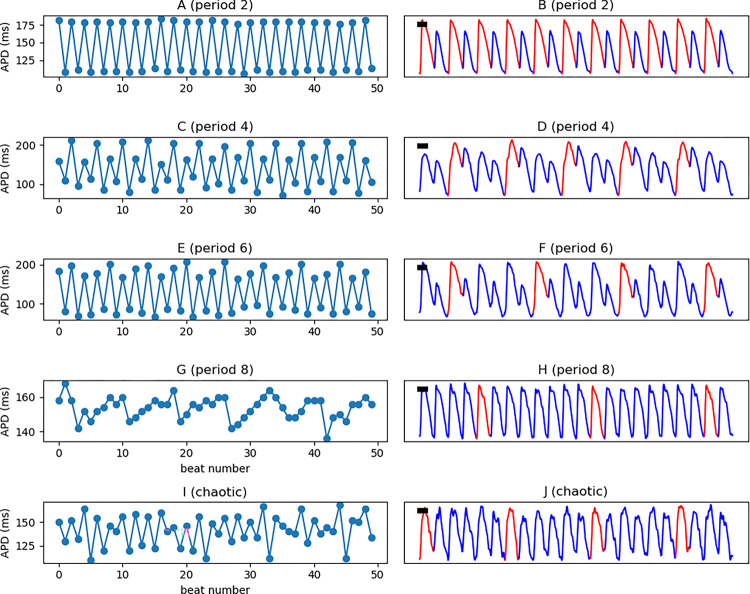
Background: Repolarization alternans, defined as period-2 oscillation in the repolarization phase of the action potentials, provides a mechanistic link between cellular dynamics and ventricular fibrillation (VF). Theoretically, higher-order periodicities (e.g., periods 4, 6, 8,...) are expected but have minimal experimental evidence.
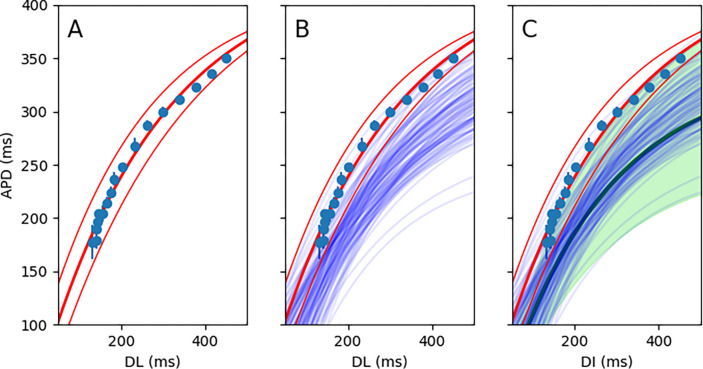
Methods: We studied explanted human hearts obtained from recipients of heart transplantation at the time of surgery. Optical mapping of the transmembrane potential was performed after staining the hearts with voltage-sensitive fluorescent dyes. Hearts were stimulated at an increasing rate until VF was induced. Signals recorded from the right ventricle endocardial surface prior to induction of VF and in the presence of 1:1 conduction were processed using the Principal Component Analysis and a combinatorial algorithm to detect and quantify higher-order dynamics. Results were correlated to the underlying electrophysiological characteristics as quantified by restitution curves and conduction velocity.
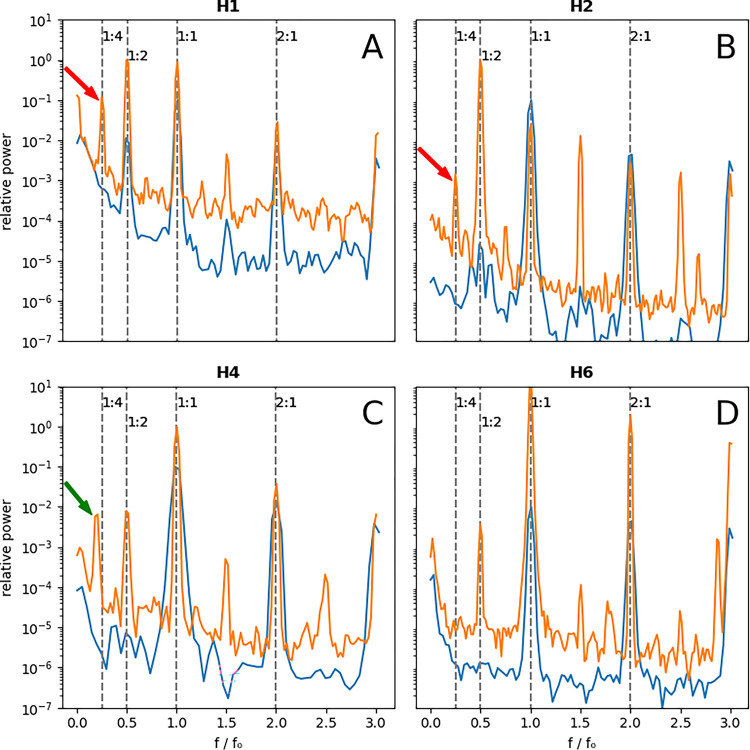
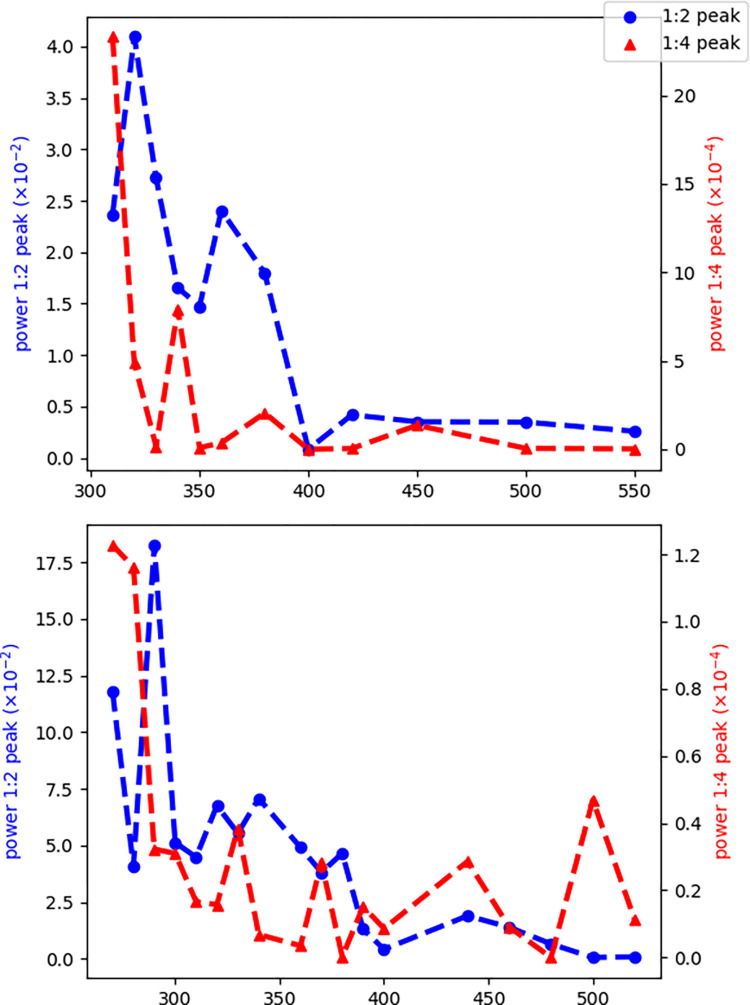
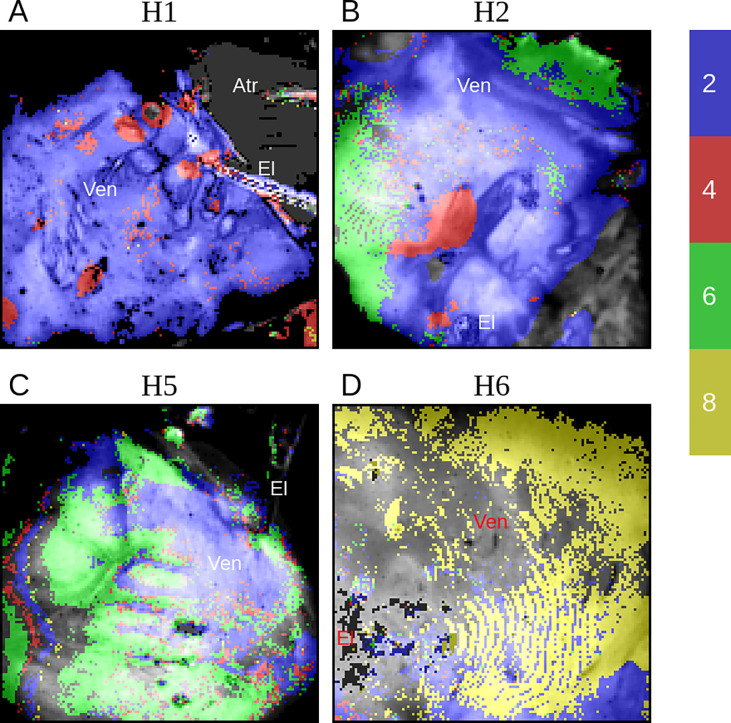
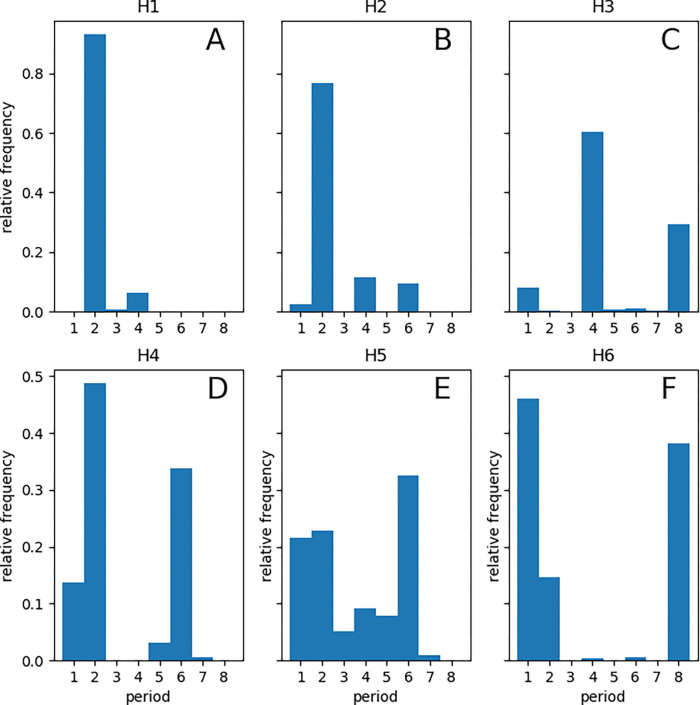
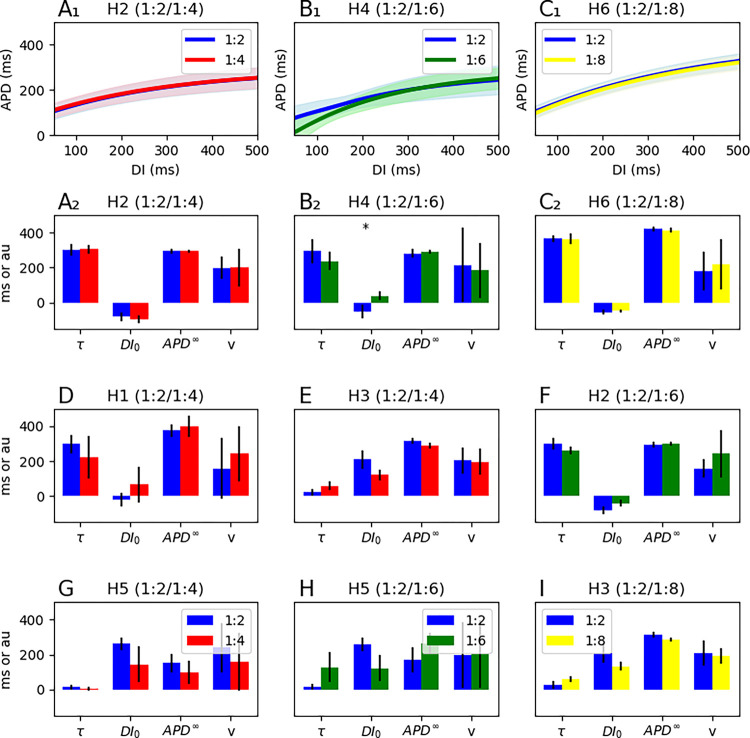
Results: A prominent and statistically significant global 1:4 peak (corresponding to period-4 dynamics) was seen in three of the six studied hearts. Local (pixel-wise) analysis revealed the spatially heterogeneous distribution of periods 4, 6, and 8, with the regional presence of periods greater than two in all the hearts. There was no significant correlation between the underlying restitution properties and the period of each pixel.
Discussion: We present evidence of higher-order periodicities and the co-existence of such regions with stable non-chaotic areas in ex-vivo human hearts. We infer from the independence of the period to the underlying restitution properties that the oscillation of the excitation-contraction coupling and calcium cycling mechanisms is the primary mechanism of higher-order dynamics. These higher-order regions may act as niduses of instability that can degenerate into chaotic fibrillation and may provide targets for substrate-based ablation of VF.
Figures
References
-
- Weiss JN, Qu Z, Chen P-S, Lin S-F, Karagueuzian HS, Hayashi H, Garfinkel A, Karma A. The dynamics of cardiac fibrillation. Circulation. 2005;112:1232–1240. - PubMed
-
- Fenton FH, Cherry EM, Hastings HM, Evans SJ. Multiple mechanisms of spiral wave breakup in a model of cardiac electrical activity. Chaos Woodbury N. 2002;12:852–892. - PubMed
-
- Jalife J. Ventricular Fibrillation: Mechanisms of Initiation and Maintenance. Annu. Rev. Physiol. 2000;62:25–50. - PubMed
-
- Al-Khatib SM, Stevenson WG, Ackerman MJ, Bryant WJ, Callans DJ, Curtis AB, Deal BJ, Dickfeld T, Field ME, Fonarow GC, et al. 2017 AHA/ACC/HRS Guideline for Management of Patients With Ventricular Arrhythmias and the Prevention of Sudden Cardiac Death. Circulation. 2018;138:e272–e391. - PubMed
-
- Di BL, Burkhardt JD, Lakkireddy D, Carbucicchio C, Mohanty S, Mohanty P, Trivedi C, Santangeli P, Bai R, Forleo G, et al. Ablation of Stable VTs Versus Substrate Ablation in Ischemic Cardiomyopathy. J. Am. Coll. Cardiol. 2015;66:2872–2882. - PubMed
Publication types
Grants and funding
LinkOut - more resources
Full Text Sources