. 2023 Aug 18:14:1218661.
doi: 10.3389/fimmu.2023.1218661. eCollection 2023.

Identification of molecular subtypes based on PANoptosis-related genes and construction of a signature for predicting the prognosis and response to immunotherapy response in hepatocellular carcinoma

Affiliations

Identification of molecular subtypes based on PANoptosis-related genes and construction of a signature for predicting the prognosis and response to immunotherapy response in hepatocellular carcinoma

Jinfeng Zhu et al. Front Immunol. .

Abstract

Background: Previous studies have demonstrated that PANoptosis is strongly correlated with cancer immunity and progression. This study aimed to develop a PANoptosis-related signature (PANRS) to explore its potential value in predicting the prognosis and immunotherapy response of hepatocellular carcinoma (HCC).

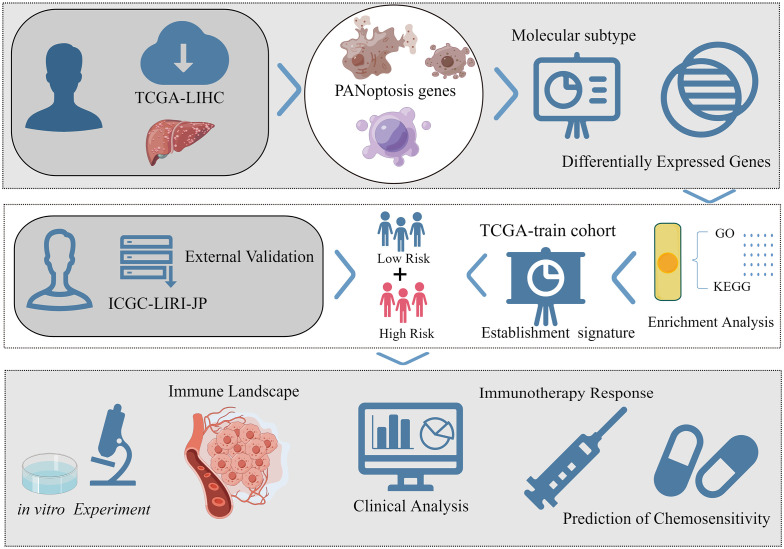
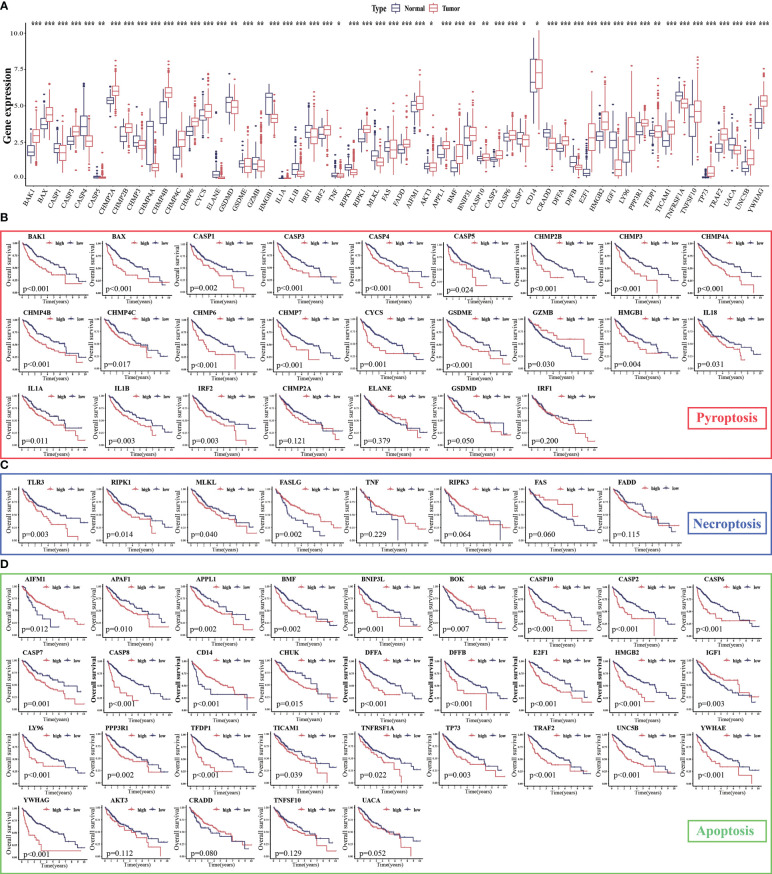
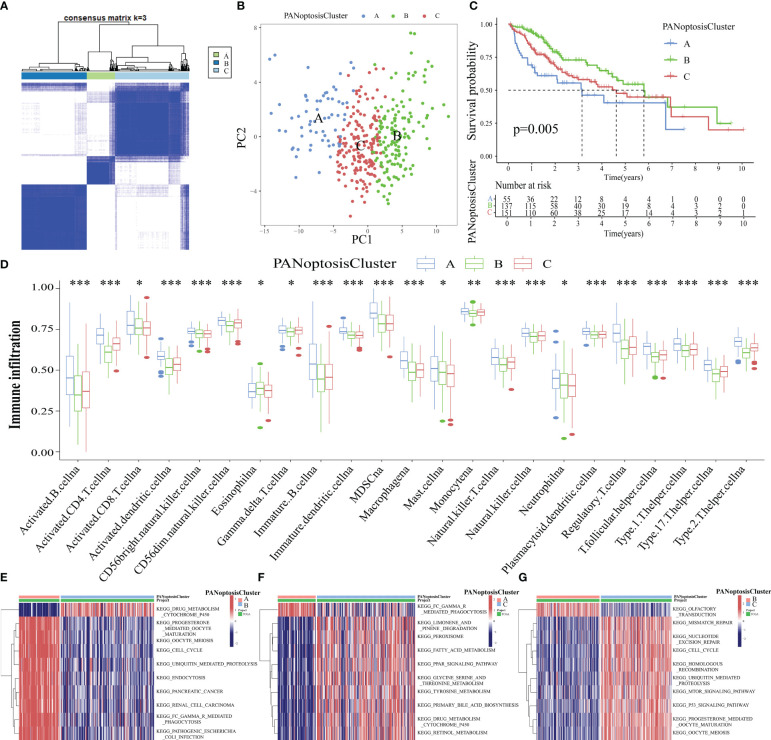
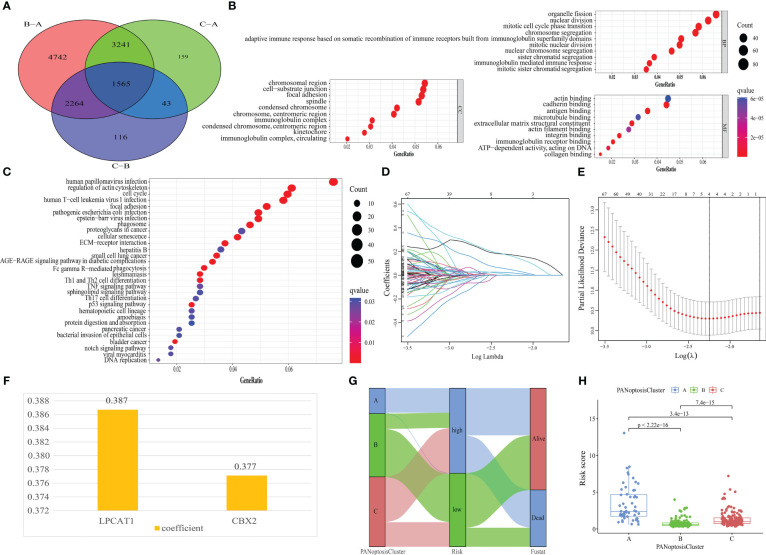
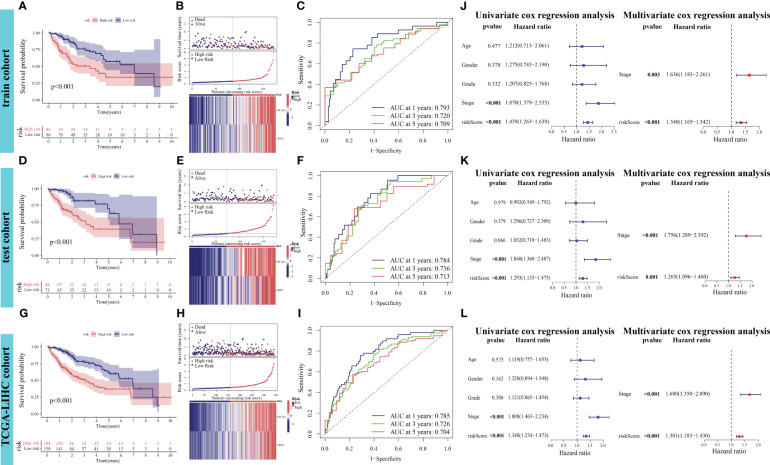
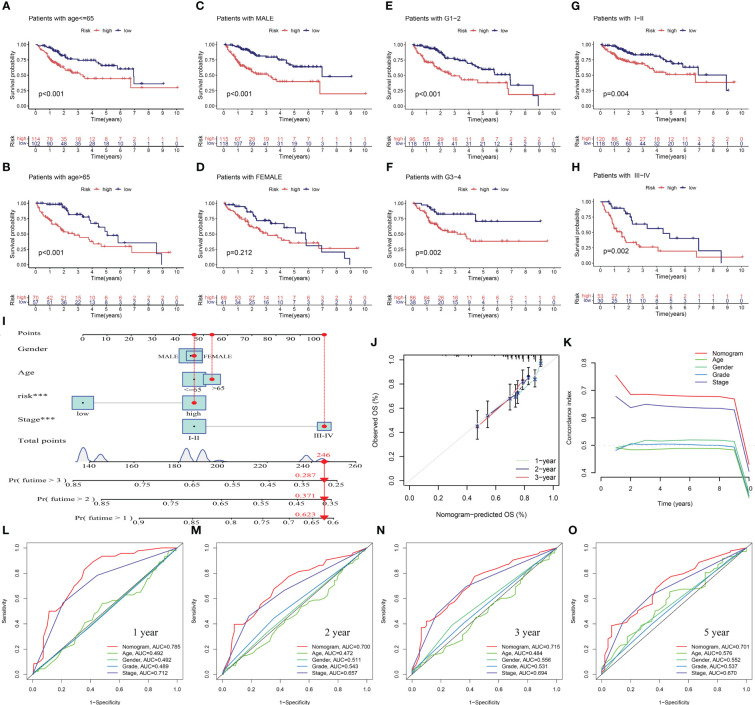
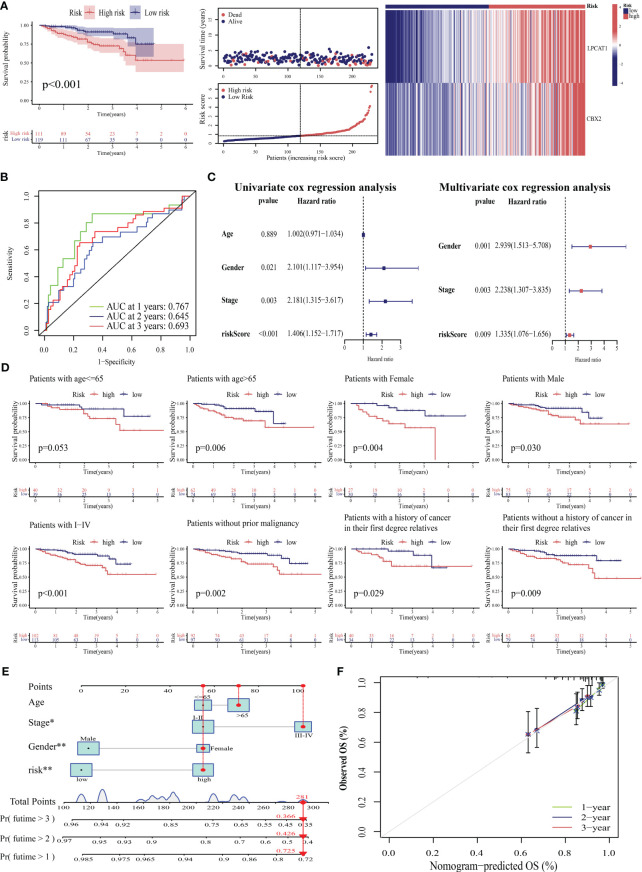
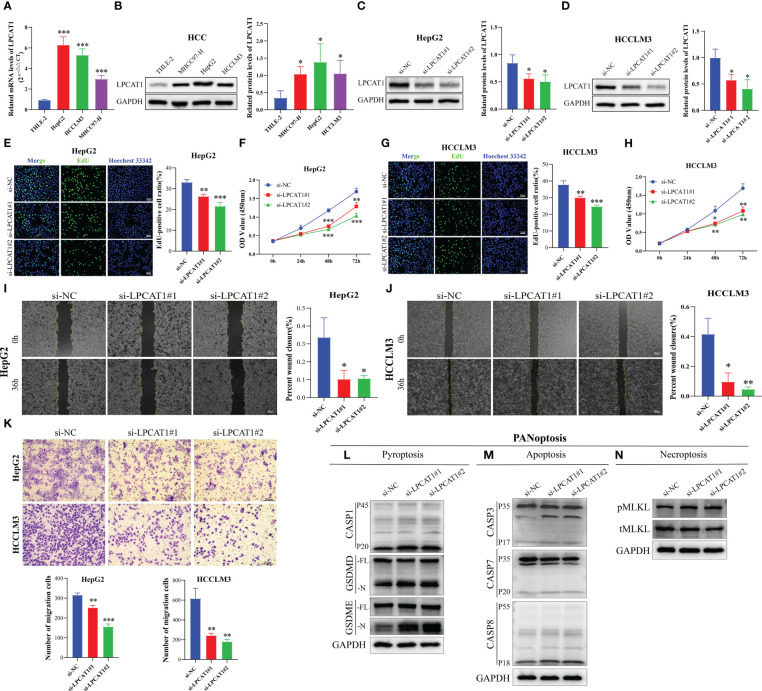
Methods: Based on the expression of PANoptosis-related genes, three molecular subtypes were identified. To construct a signature, the differentially expressed genes between different molecular subtypes were subjected to multivariate least absolute shrinkage and selection operator Cox regression analyses. The risk scores of patients in the training set were calculated using the signature. The patients were classified into high-risk and low-risk groups based on the median risk scores. The predictive performance of the signature was evaluated using Kaplan-Meier plotter, receiving operating characteristic curves, nomogram, and calibration curve. The results were validated using external datasets. Additionally, the correlation of the signature with the immune landscape and drug sensitivity was examined. Furthermore, the effect of LPCAT1 knockdown on HCC cell behavior was verified using in vitro experiments.

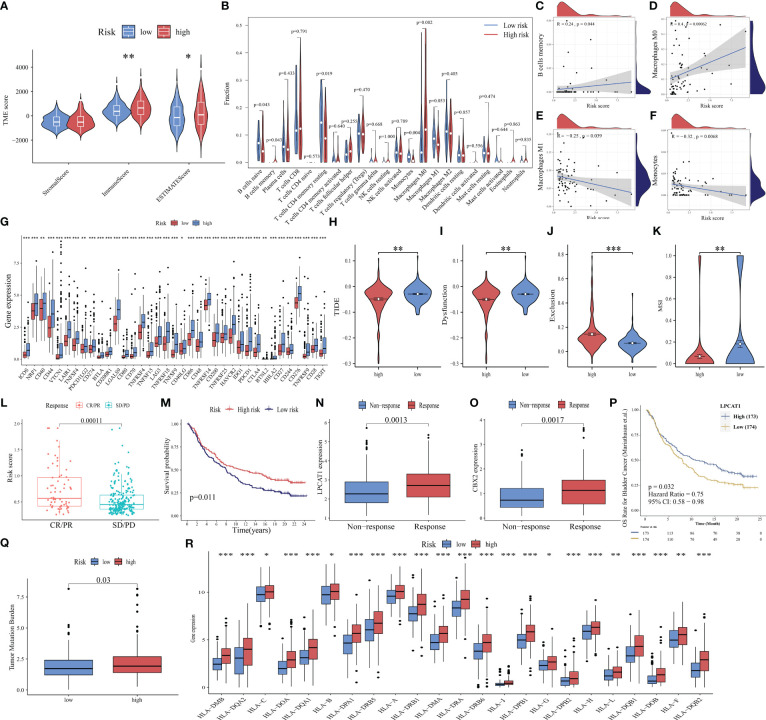
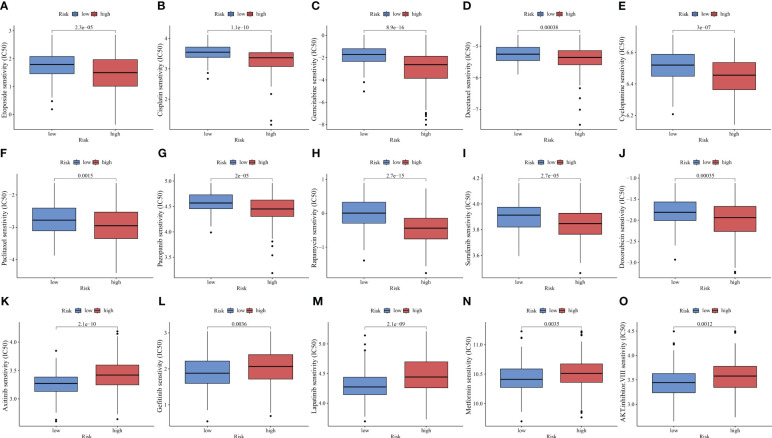
Results: This study developed a PANRS. The risk score obtained by using the PANRS was an independent risk factor for the prognosis of patients with HCC and exhibited good prognostic predictive performance. The nomogram constructed based on the risk score and clinical information can accurately predicted the survival probability of patients with HCC. Patients with HCC in the high-risk groups have high immune scores and tend to generate an immunosuppressive microenvironment. They also exhibited a favorable response to immunotherapy, as evidenced by high tumor mutational burden, high immune checkpoint gene expression, high human leukocyte antigen gene expression, low tumor immune dysfunction and low exclusion scores. Additionally, the PANRS enabled the identification of 15 chemotherapeutic agents, including sorafenib, for patients with HCC with different risk levels, guiding clinical treatment. The signature gene LPCAT1 was upregulated in HCC cell lines. LPCAT1 knockdown markedly decreased HCC cell proliferation and migration.

Conclusion: PANRS can accurately predict the prognosis and immunotherapy response of patients with HCC and consequently guide individualized treatment.

Keywords: PANoptosis; hepatocellular carcinoma; immunotherapy response; molecular subtypes; prognosis; signature.


Conflict of interest statement

The authors declare that the research was conducted in the absence of any commercial or financial relationships that could be construed as a potential conflict of interest.

Figures

Figure 1
Figure 1
The brief flow chart of the study (By Figdraw, ID: AUYWT8d80f).
Figure 2
Figure 2
Expression levels of PANoptosis-related genes in hepatocellular carcinoma (HCC) and their correlation with survival. (A) The mRNA expression levels of PANoptosis-related genes in HCC and non-cancerous/para-cancerous samples were analyzed in The Cancer Genome Atlas (TCGA) and Genotype-Tissue Expression (GTEx) datasets; (B–D) Differential survival of patients in the high-expression and low-expression groups. * p < 0.05, ** p < 0.01, and *** p < 0.001.
Figure 3
Figure 3
Identification of three molecular subtypes of PANoptosis. (A) Three PANoptosisClusters were identified using consensus clustering based on the expression levels of PANoptosis-related genes in The Cancer Genome Atlas-Liver Hepatocellular Carcinoma (TCGA-LIHC) cohort; (B) The three PANoptosisClusters were visually distinguished using principal component analysis (PCA); (C) Comparison of overall survival (OS) between the three PANoptosisClusters; (D) Differential immune cell infiltration status among the three PANoptosisClusters; (E–G) The differential biological function between the following pairs was examined using gene set variation analysis (GSVA): PANoptosisClusters A and B (E), PANoptosisClusters A and C (F), PANoptosisClusters B and C (G). * p < 0.05, ** p < 0.01, and *** p < 0.001.
Figure 4
Figure 4
Establishment of PANoptosis-related signature (PANRS). (A) Screening of differentially expressed genes (DEGs) between the three PANoptosisClusters; (B, C) Gene Ontology (GO) (B) and Kyoto Encyclopedia of Genes and Genomes (KEGG) enrichment analyses (C) were performed to examine the biological function and related pathways in which the DEGs were enriched; (D) The trajectories of the coefficients of prognosis-related DEGs; (E) The smallest parameter graph to determine the number of included genes based on the cross-validation error; (F) Names of genes in PANRS and their corresponding risk coefficients; (G) The Sankey diagram shows how the molecular subtype of PANoptosis is quantified into a prognostic PANRS; (H) Distribution of risk scores among the PANoptosisClusters.
Figure 5
Figure 5
Verification of the prognostic performance of PANoptosis-related signature (PANRS) in The Cancer Genome Atlas-Liver Hepatocellular Carcinoma (TCGA-LIHC) cohort. (A, B) Differential overall survival (OS) and risk curve between the high-risk and low-risk groups in the training cohort; (C) In the training cohort, PANRS predicted the area under the curve (AUC) values for 1-year, 3-year, and 5-year OS of patients with hepatocellular carcinoma (HCC); (D, E, G, H) Differential OS (D, G) and risk curve (E, H) between the high-risk and low-risk groups in the test and TCGA-LIHC cohorts; (F, I) In the test (F) and TCGA-LIHC cohorts (I), PANRS predicted the AUC values for 1-year, 3-year, and 5-year OS of patients with HCC; (J–L) Validation of the independent prognostic performance of PANRS in the training (J), test (K), and TCGA-LIHC cohorts (L).
Figure 6
Figure 6
Evaluation of the potential clinical application value of PANoptosis-related signature (PANRS). (A–H) The clinical applicability of PANRS was evaluated by comparing the overall survival (OS) of the high-risk and low-risk groups according to age (A, B), gender (C, D), and tumor grades (E, F) and stages (G, H); (I) A nomogram was constructed by combining the risk scores with age, sex, and tumor stage; (J, K) Calibration curve (J) and C-index (K) confirmed the high accuracy of the nomogram; (L–O) The ability of nomogram to predict 1-year (L), 2-year (M), 3-year (N), and 5-year (O) OS in HCC was compared with other common clinical indicators through receiving operating characteristic (ROC) mapping.
Figure 7
Figure 7
Verification of the prognostic predictive performance of PANoptosis-related signature (PANRS) in an external hepatocellular carcinoma (HCC) cohort. (A) Differential overall survival (OS) and risk curve between the high-risk and low-risk groups in the International Cancer Genome Consortium-Liver cancer-Riken-Japan (ICGC-LIRI-JP) cohort; (B) PANRS predicted the area under the curve (AUC) values for 1-year, 2-year, and 3-year OS in patients with HCC in the ICGC-LIRI-JP cohort; (C) Verification of the independent prognostic value of PANRS in the ICGC-LIRI-JP cohort; (D) Assessment of the clinical applicability of PANRS in the ICGC-LIRI-JP cohort; (E, F) The nomogram (E) and its prediction accuracy (F) in the ICGC-LIRI-JP cohort.
Figure 8
Figure 8
Ability of PANoptosis-related signature (PANRS) to predict immune landscape and immunotherapy response in hepatocellular carcinoma (HCC). (A) Differential tumor microenvironment (TME) between the high-risk and low-risk groups; (B) Comparative analysis of immune cell infiltration status between the high-risk and low-risk groups; (C–F) The correlation of risk scores with memory B cells (C), M0 macrophages (D), M1 macrophages (E), and monocytes (F); (G) Differential expression of immune checkpoint molecules between the high-risk and low-risk groups; (H–K) Comparative analysis of tumor immune dysfunction and exclusion (TIDE) (H), dysfunction (I), exclusion (J), and microsatellite instability (MSI) scores (K) between the high-risk and low-risk groups; (L) Analysis of the correlation of risk scores with complete response (CR)/partial response (PR) and stable disease (SD)/progressive disease (PD) in the IMvigor210 cohort; (M) Comparison of overall survival (OS) between the high-risk and low-risk group in the IMvigor210 cohort; (N, O) The predictive value of the expression of the signature genes LPCAT1 (N) and CBX2 (O) for immunotherapy response; (P) Effect of LPCAT1 expression levels on the OS of patients with bladder cancer; (Q) Distribution of tumor mutational burden (TMB) in different risk groups; (R) Differential expression of human leukocyte antigen (HLA) molecules in different risk groups. * p < 0.05, ** p < 0.01, and *** p < 0.001.
Figure 9
Figure 9
PANoptosis-related signature (PANRS) predicts the sensitivity of hepatocellular carcinoma to common chemotherapy drugs. (A–J) Chemotherapy drugs to which the high-risk group is sensitive relative to the low-risk group; (K–O) Chemotherapy drugs to which the low-risk group is sensitive relative to the high-risk group.
Figure 10
Figure 10
LPCAT1 knockdown inhibits hepatocellular carcinoma (HCC) cell proliferation and migration and promotes PANoptosis. (A) Quantitative real-time polymerase chain reaction analysis of LPCAT1 mRNA expression in healthy liver cell lines (THLE-2) and HCC cell lines (HCCLM3, MHCC97-H, and HepG2); (B) Western blotting analysis of LPCAT1 protein expression levels in healthy liver cell lines (THLE-2) and HCC cell lines (HCCLM3, MHCC97-H, and HepG2); GAPDH was used as an internal control; (C, D) The knockdown efficiency of different siRNA-LPCAT1 constructs in HepG2 and HCCLM3 cells was evaluated using western blotting; (E–H) Effects of transfection with siRNA–LPCAT1#1, siRNA–LPCAT1#2 or negative control (si-NC) on cell proliferation were assessed using ethynyl-deoxyuridine (EdU) and cell counting kit (CCK)-8 assays; (E, G) Representative images of the changes in the number of proliferating HepG2 and HCCLM3 cells in different groups after transfection and quantitative analysis of EdU-positive rate (original magnification, ×200; scale bar, 50 μm); (F, H) The line graphs show the changes in the viability of HepG2 and HCCLM3 cells in different groups at 0, 24, 48, and 72 h post-transfection; (I, J) Cell migration was examined using the wound-healing assay. Representative images and quantitative analysis of wound closure area in different groups at 0 and 36 h post-scratching are presented (original magnification, ×40; scale bar, 200 μm); (K) Transwell assay was used to evaluate the migration ability of transfected HCC cells. The upper panel shows representative images (original magnification, ×200; scale bar, 200 μm), while the lower panel (histogram) shows the number of migrated cells in different groups; (L-N) Immunoblotting analysis of (L) pro-CASP1 (P45) and activated (P20) CASP1, pro-GSDMD (-FL), and activated GSDMD (-N); and pro-GSDME (-FL) and activated (-N) GSDME; (M) pro-CASP3 (P35) and cleaved (P17) CASP3, pro-CASP7 (P35) and cleaved (P20) CASP7, and pro-CASP8 (P55) and cleaved (P18) CASP8; and (N) phosphorylated MLKL (pMLKL), and total MLKL (tMLKL) in HCCLM3 cells transfected with si-NC, si-LPCAT1#1, and si-LPCAT1#2. GAPDH was used as the internal control. Data are representative of at least three independent experiments.* p < 0.05, ** p < 0.01, and *** p < 0.001.

Similar articles

Cited by

References

    1. Sung H, Ferlay J, Siegel RL, Laversanne M, Soerjomataram I, Jemal A, et al. . Global cancer statistics 2020: globocan estimates of incidence and mortality worldwide for 36 cancers in 185 countries. CA Cancer J Clin (2021) 71(3):209–49. doi: 10.3322/caac.21660 - DOI - PubMed
    1. Sia D, Villanueva A, Friedman SL, Llovet JM. Liver cancer cell of origin, molecular class, and effects on patient prognosis. Gastroenterology (2017) 152(4):745–61. doi: 10.1053/j.gastro.2016.11.048 - DOI - PubMed
    1. Jiang L, Li L, Liu Y, Lu L, Zhan M, Yuan S, et al. . Drug resistance mechanism of kinase inhibitors in the treatment of hepatocellular carcinoma. Front Pharmacol (2023) 14:1097277. doi: 10.3389/fphar.2023.1097277 - DOI - PMC - PubMed
    1. Llovet JM, Montal R, Sia D, Finn RS. Molecular therapies and precision medicine for hepatocellular carcinoma. Nat Rev Clin Oncol (2018) 15(10):599–616. doi: 10.1038/s41571-018-0073-4 - DOI - PubMed
    1. Stratton MR, Darling J, Lantos PL, Cooper CS, Reeves BR. Cytogenetic abnorMalities in human ependymomas. Int J Cancer (1989) 44(4):579–81. doi: 10.1002/ijc.2910440403 - DOI - PubMed

Publication types

Substances