

Identification of molecular subtypes and immune infiltration in endometriosis: a novel bioinformatics analysis and In vitro validation
- PMID: 37662927
- PMCID: PMC10471803
- DOI: 10.3389/fimmu.2023.1130738
Identification of molecular subtypes and immune infiltration in endometriosis: a novel bioinformatics analysis and In vitro validation
Abstract
Introduction: Endometriosis is a worldwide gynacological diseases, affecting in 6-10% of women of reproductive age. The aim of this study was to investigate the gene network and potential signatures of immune infiltration in endometriosis.
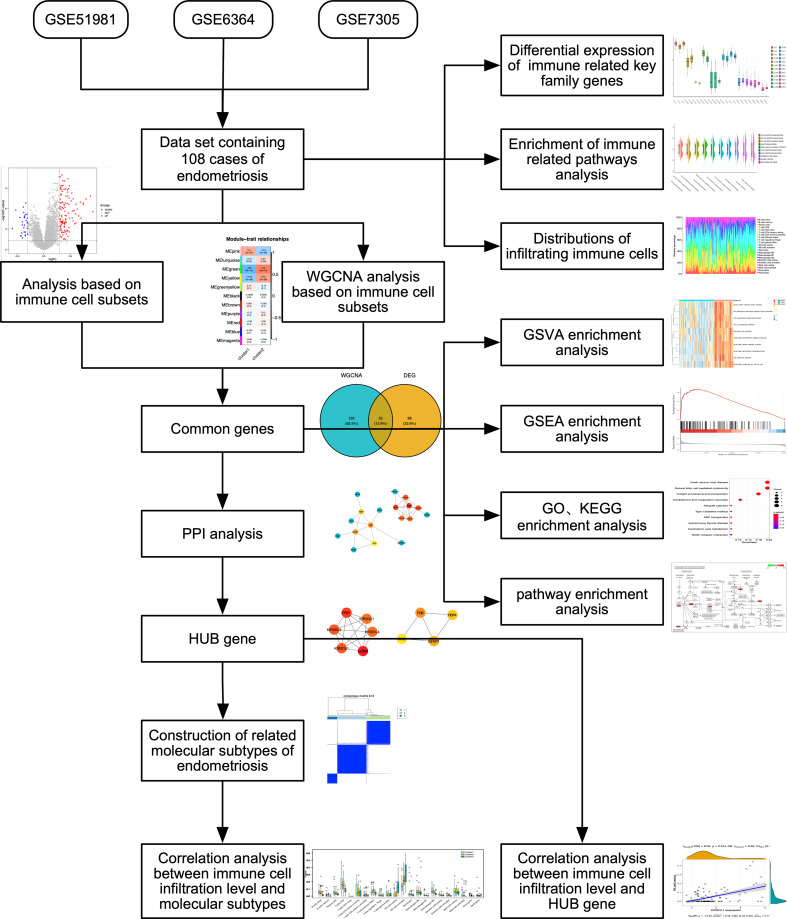
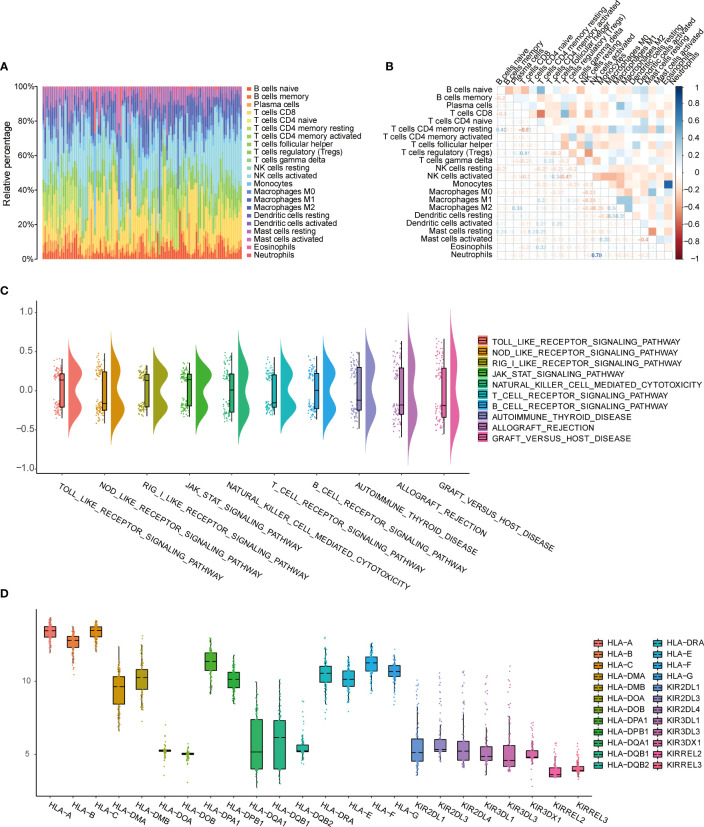
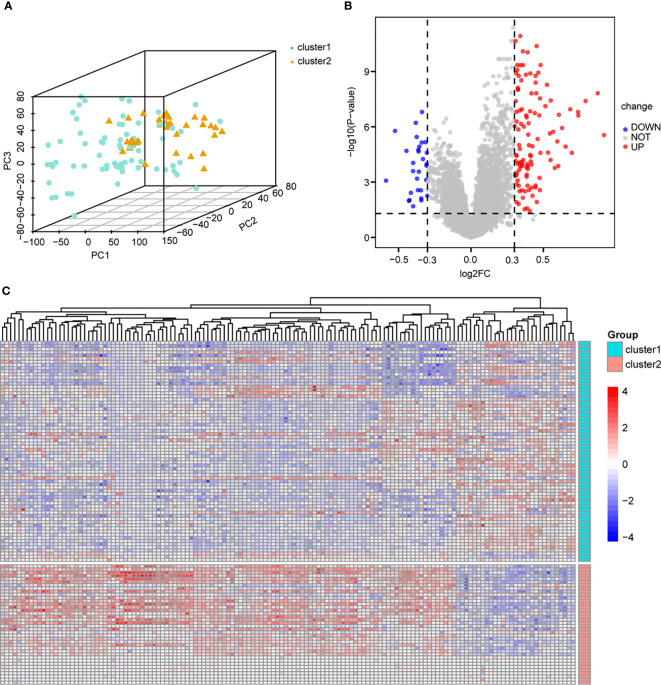
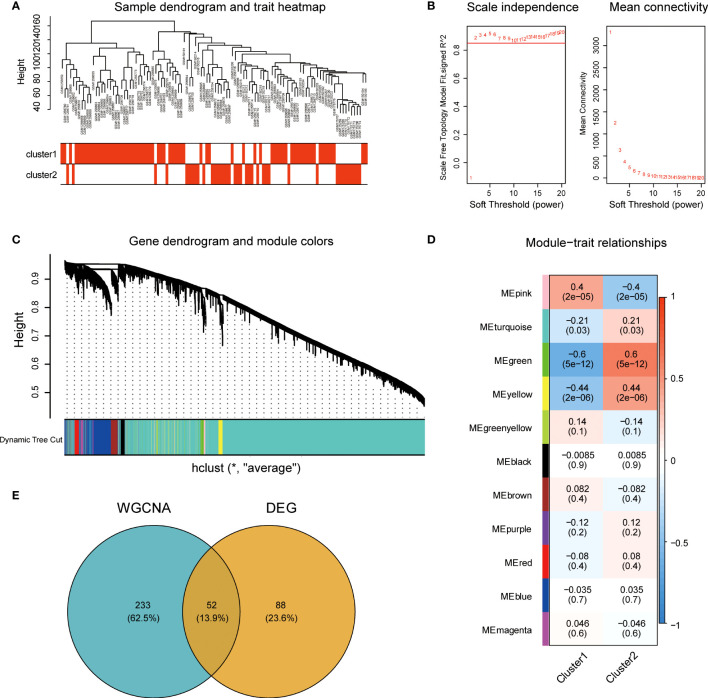
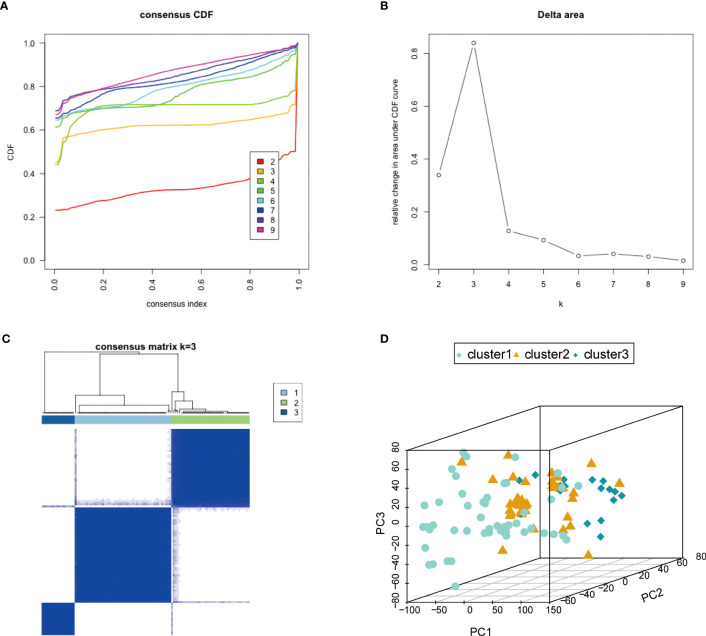
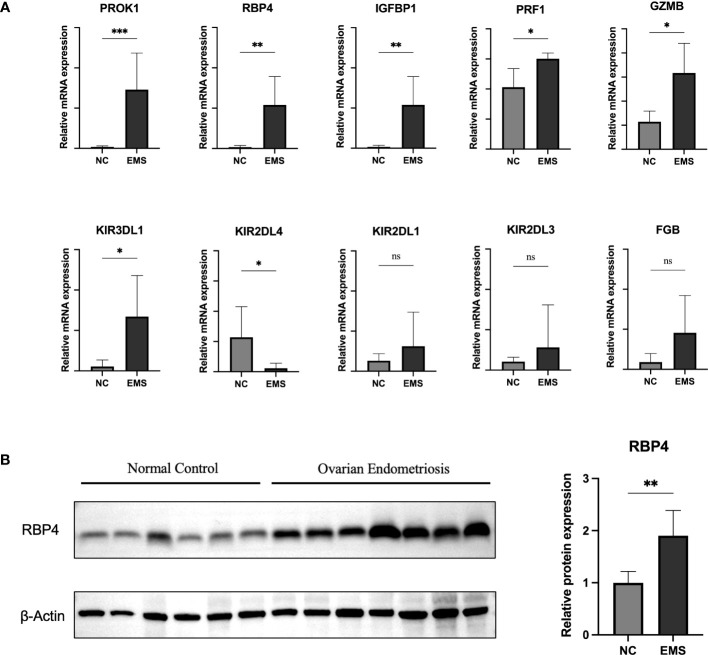
Methods: The expression profiles of GSE51981, GSE6364, and GSE7305 were obtained from the Gene Expression Omnibus (GEO) database. Core modules and central genes related to immune characteristics were identified using a weighted gene coexpression network analysis. Bioinformatics analysis was performed to identify central genes in immune infiltration. Protein-protein interaction (PPI) network was used to identify the hub genes. We then constructed subtypes of endometriosis samples and calculated their correlation with hub genes. qRTPCR and Western blotting were used to verify our findings.
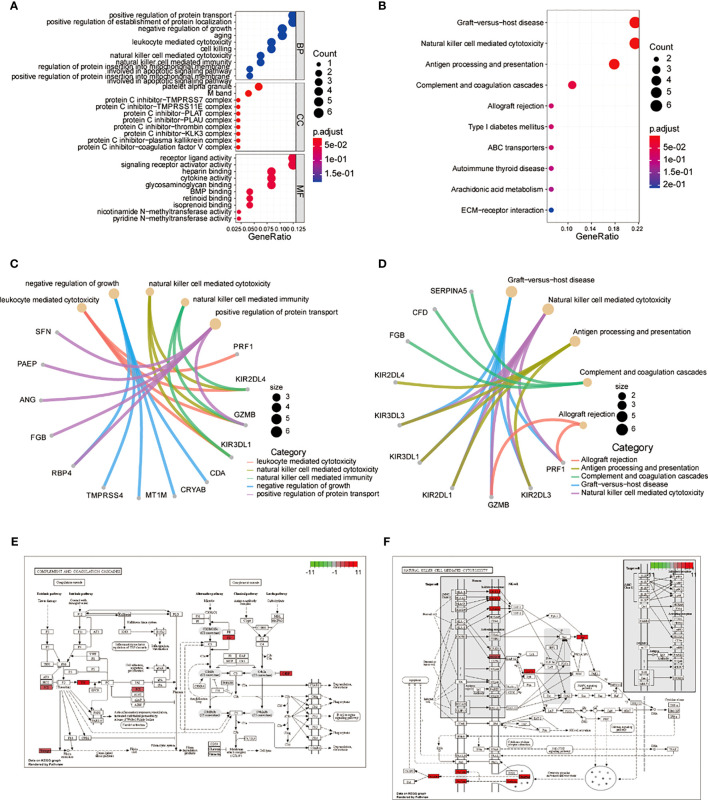
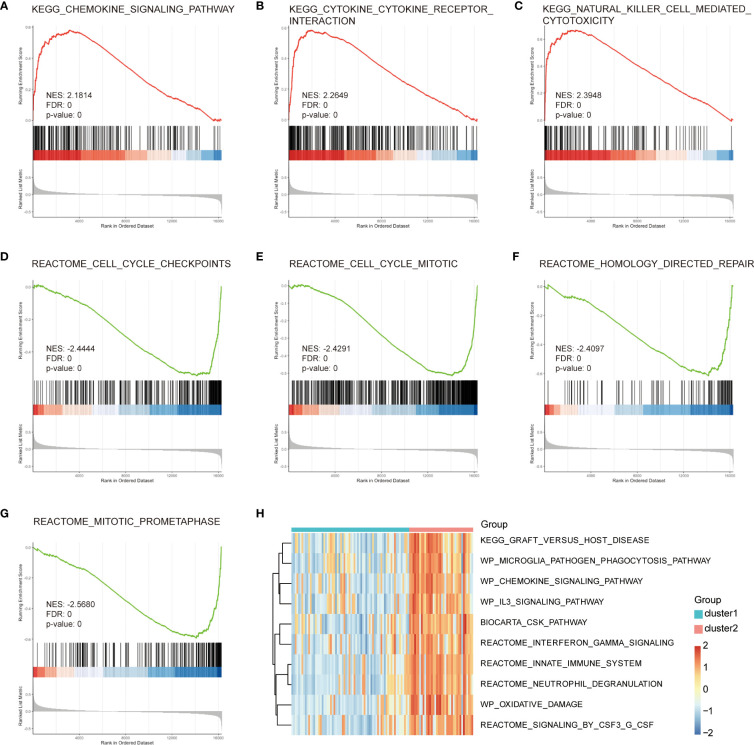
Results: We identified 10 candidate hub genes (GZMB, PRF1, KIR2DL1, KIR2DL3, KIR3DL1, KIR2DL4, FGB, IGFBP1, RBP4, and PROK1) that were significantly correlated with immune infiltration. Our study established a detailed immune network and systematically elucidated the molecular mechanism underlying endometriosis from the aspect of immune infiltration.
Discussion: Our study provides comprehensive insights into the immunology involved in endometriosis and might contribute to the development of immunotherapy for endometriosis. Furthermore, our study sheds light on the underlying molecular mechanism of endometriosis and might help improve the diagnosis and treatment of this condition.
Keywords: WGCNA; endometriosis; immune cell subset; immune infiltration; molecular subtype; signature.
Copyright © 2023 Lv, Sun, Gan and Sun.
Conflict of interest statement
The authors declare that the research was conducted in the absence of any commercial or financial relationships that could be construed as a potential conflict of interest.
Figures
Similar articles
-
Identification of Key Genes and Pathways associated with Endometriosis by Weighted Gene Co-expression Network Analysis.Int J Med Sci. 2021 Aug 3;18(15):3425-3436. doi: 10.7150/ijms.63541. eCollection 2021. Int J Med Sci. 2021. PMID: 34522169 Free PMC article.
-
Screening and identification of potential hub genes and immune cell infiltration in the synovial tissue of rheumatoid arthritis by bioinformatic approach.Heliyon. 2023 Jan 10;9(1):e12799. doi: 10.1016/j.heliyon.2023.e12799. eCollection 2023 Jan. Heliyon. 2023. PMID: 36699262 Free PMC article.
-
Exploring hub pyroptosis-related genes, molecular subtypes, and potential drugs in ankylosing spondylitis by comprehensive bioinformatics analysis and molecular docking.BMC Musculoskelet Disord. 2023 Jun 29;24(1):532. doi: 10.1186/s12891-023-06664-8. BMC Musculoskelet Disord. 2023. PMID: 37386410 Free PMC article.
-
Bioinformatical analysis of the key differentially expressed genes and associations with immune cell infiltration in development of endometriosis.BMC Genom Data. 2022 Mar 18;23(1):20. doi: 10.1186/s12863-022-01036-y. BMC Genom Data. 2022. PMID: 35303800 Free PMC article.
-
Identification and Analysis of Potential Immune-Related Biomarkers in Endometriosis.J Immunol Res. 2023 Jan 10;2023:2975581. doi: 10.1155/2023/2975581. eCollection 2023. J Immunol Res. 2023. PMID: 36660246 Free PMC article.
Cited by
-
Proteomics approach to discovering non-invasive diagnostic biomarkers and understanding the pathogenesis of endometriosis: a systematic review and meta-analysis.J Transl Med. 2024 Jul 26;22(1):685. doi: 10.1186/s12967-024-05474-3. J Transl Med. 2024. PMID: 39061077 Free PMC article.
-
Identification of diagnostic markers related to inflammatory response and cellular senescence in endometriosis using machine learning and in vitro experiment.Inflamm Res. 2024 Jul;73(7):1107-1122. doi: 10.1007/s00011-024-01886-5. Epub 2024 May 4. Inflamm Res. 2024. PMID: 38704432
-
Emerging roles of KIR2DL4 in cancer immunotherapy.Breast Cancer. 2025 Jun 23. doi: 10.1007/s12282-025-01738-y. Online ahead of print. Breast Cancer. 2025. PMID: 40549069 Review.
-
Endometriosis is not the endometrium: Reviewing the over-representation of eutopic endometrium in endometriosis research.Elife. 2025 May 20;14:e103825. doi: 10.7554/eLife.103825. Elife. 2025. PMID: 40392231 Free PMC article. Review.
-
Endometriosis: An Immunologist's Perspective.Int J Mol Sci. 2025 May 28;26(11):5193. doi: 10.3390/ijms26115193. Int J Mol Sci. 2025. PMID: 40508002 Free PMC article. Review.
References
Publication types
MeSH terms
Substances
LinkOut - more resources
Full Text Sources
Medical
Miscellaneous