. 2023 Aug 15:14:1245876.
doi: 10.3389/fimmu.2023.1245876. eCollection 2023.

DNA methylation patterns in CD4+ T-cells separate psoriasis patients from healthy controls, and skin psoriasis from psoriatic arthritis

Affiliations

DNA methylation patterns in CD4+ T-cells separate psoriasis patients from healthy controls, and skin psoriasis from psoriatic arthritis

Valentina Natoli et al. Front Immunol. .

Abstract

Background: Psoriasis is an autoimmune/inflammatory disorder primarily affecting the skin. Chronic joint inflammation triggers the diagnosis of psoriatic arthritis (PsA) in approximately one-third of psoriasis patients. Although joint disease typically follows the onset of skin psoriasis, in around 15% of cases it is the initial presentation, which can result in diagnostic delays. The pathophysiological mechanisms underlying psoriasis and PsA are not yet fully understood, but there is evidence pointing towards epigenetic dysregulation involving CD4+ and CD8+ T-cells.

Objectives: The aim of this study was to investigate disease-associated DNA methylation patterns in CD4+ T-cells from psoriasis and PsA patients that may represent potential diagnostic and/or prognostic biomarkers.

Methods: PBMCs were collected from 12 patients with chronic plaque psoriasis and 8 PsA patients, and 8 healthy controls. CD4+ T-cells were separated through FACS sorting, and DNA methylation profiling was performed (Illumina EPIC850K arrays). Bioinformatic analyses, including gene ontology (GO) and KEGG pathway analysis, were performed using R. To identify genes under the control of interferon (IFN), the Interferome database was consulted, and DNA Methylation Scores were calculated.

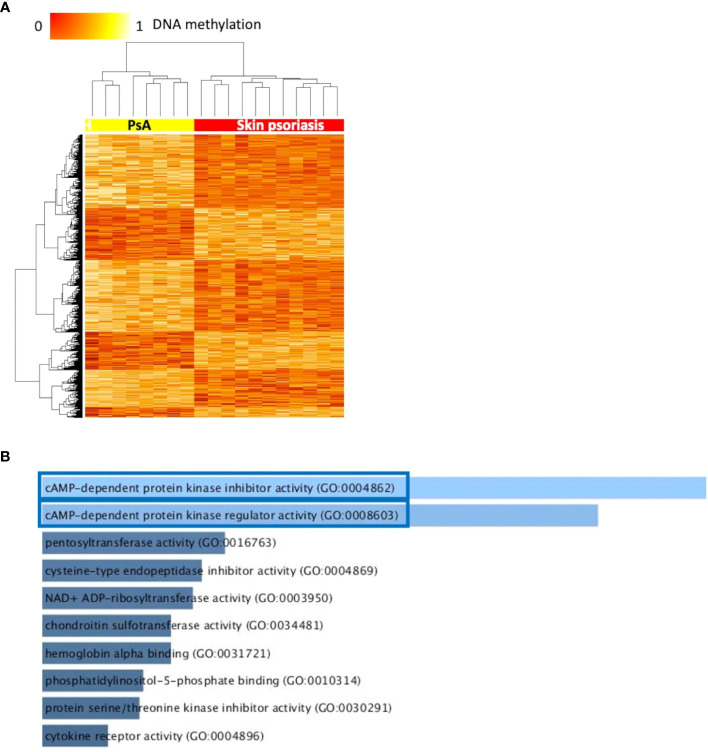
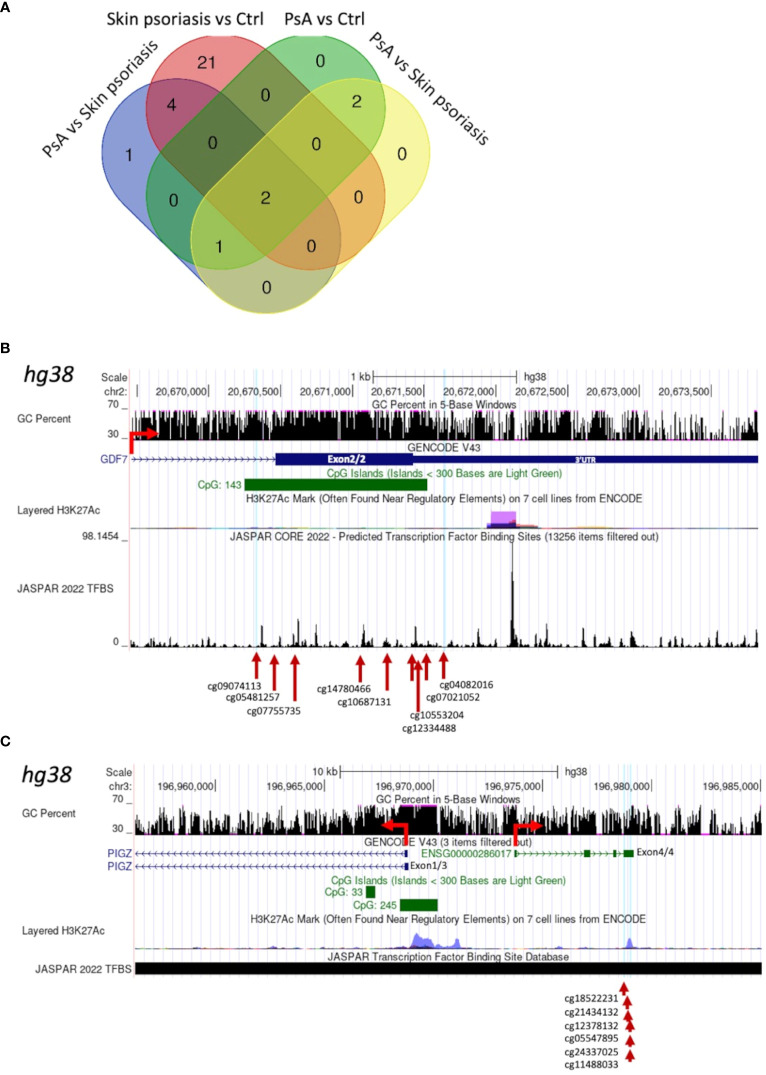
Results: Numbers and proportions of CD4+ T-cell subsets (naïve, central memory, effector memory, CD45RA re-expressing effector memory cells) did not vary between controls, skin psoriasis and PsA patients. 883 differentially methylated positions (DMPs) affecting 548 genes were identified between controls and "all" psoriasis patients. Principal component and partial least-squares discriminant analysis separated controls from skin psoriasis and PsA patients. GO analysis considering promoter DMPs delivered hypermethylation of genes involved in "regulation of wound healing, spreading of epidermal cells", "negative regulation of cell-substrate junction organization" and "negative regulation of focal adhesion assembly". Comparing controls and "all" psoriasis, a majority of DMPs mapped to IFN-related genes (69.2%). Notably, DNA methylation profiles also distinguished skin psoriasis from PsA patients (2,949 DMPs/1,084 genes) through genes affecting "cAMP-dependent protein kinase inhibitor activity" and "cAMP-dependent protein kinase regulator activity". Treatment with cytokine inhibitors (IL-17/TNF) corrected DNA methylation patterns of IL-17/TNF-associated genes, and methylation scores correlated with skin disease activity scores (PASI).

Conclusion: DNA methylation profiles in CD4+ T-cells discriminate between skin psoriasis and PsA. DNA methylation signatures may be applied for quantification of disease activity and patient stratification towards individualized treatment.

Keywords: CD4+ T-cell; biomarker; epigenetics; interferon; methylation; psoriasis; psoriatic arthritis.


Conflict of interest statement

The authors declare that the research was conducted in the absence of any commercial or financial relationships that could be construed as a potential conflict of interest.

Figures

Figure 1
Figure 1
Differentially methylated CpGs in CD4+ T cells distinguish psoriasis patients from healthy controls. (A) Heat map displaying differentially methylated positions (DMPs) between “all” psoriasis patients (skin psoriasis and PsA) and healthy controls (FDR < 0.05, |Δβ| > 0.1). Normalized DNA methylation levels are depicted on the top left, with red representing lower methylation and yellow indicating higher methylation levels. (B) Unsupervised Principal Component Analysis (PCA) of 883 DMPs identified between “all” psoriasis patients and healthy controls (FDR < 0.05, |Δβ| > 0.1). Principal Component (PC)1 and PC2 are displayed, explaining 51% and 6.1% of variance. (C) PLS-DA of 883 DMPs between “all” psoriasis patients and healthy controls (FDR < 0.05, |Δβ| > 0.1). (D) Correlation circle plot considering the “top” 20 CpGs with a correlation coefficient above|0.9| that primarily contribute to the definition of PLS-DA component 1 discriminating “all” psoriasis patients from healthy controls. (E) Bar diagram depicting results of Gene Ontology (GO) analysis considering hypermethylated genes containing at least one DMP in their promoter. Top 10 GO terms are represented, statistically significant pathways are framed in red.
Figure 2
Figure 2
Differentially methylated CpGs differentiate skin psoriasis from PsA. (A) Heat map displaying differentially methylated positions (DMPs) between skin psoriasis and PsA (FDR < 0.05, |Δβ| > 0.1). Normalized DNA methylation levels are displayed on the top left with red indicating reduced methylation and yellow indicating increased methylation levels. (B) Bar diagrams depict the results of Gene Ontology (GO) analysis of hypomethylated genes which presented at least one DMP in their promoter. Top 10 GO terms are represented, and the statistically significant pathways are framed in blue.
Figure 3
Figure 3
DNA methylation of IFN-associated genes differs between psoriasis patients and healthy controls. (A) Pie chart representing the proportion of genes (with a minimum of 1 DMP between “all” psoriasis patients and healthy controls (FDR < 0.05, |Δβ| > 0.1) under the control of type I interferons (IFNs), type II IFNs, their combination, and not-IFN-related pathways. (B) Type I IFN methylation scores calculated in “all” psoriasis patients and healthy control according to the method reported by Björk et al. (30). The median is reported in red, skin psoriasis patients are reported by a black square and PsA patients by a white square, results from Mann-Whitney tests are displayed (**p < 0.01). (C) Heat map displaying differentially methylated positions (DMPs) of genes under the control of type I IFNs between “all” psoriasis patients and healthy controls (FDR < 0.05, |Δβ| > 0.1). Normalized DNA methylation levels are displayed on the top left with red indicating reduced methylation and yellow indicating increased methylation levels. (D) Type I and II IFN methylation scores calculated in “all” psoriasis patients and healthy controls. The median is reported in red, skin psoriasis patients are reported by a black square and PsA patients by a white square, results from Mann-Whitney tests are displayed (*p < 0.05). (E) Heat map displaying DMPs of genes under the control of type I and II IFN between “all” psoriasis patients and healthy controls (FDR < 0.05, |Δβ| > 0.1). Normalized DNA methylation levels are displayed on the top left with red indicating reduced methylation and yellow indicating increased methylation levels.
Figure 4
Figure 4
Shared Differentially Methylated Regions (DMRs) in CD4+ T-cells from psoriasis patients and healthy control. (A) Venn diagram displaying overlapping and differentially methylated regions (DMRs) with ≥5 CpGs per region, in “all” psoriasis patients versus controls (ctrl), controls versus skin psoriasis, controls versus psoriatic arthritis (PsA), and skin psoriasis versus PsA. Map of a DMR within the 3’UTR of GDF7 (B) and a DMR upstream of the Transcription Start Site (TSS) of PIGZ (C) using the UCSC genome browser database (https://genome.ucsc.edu). The GC content of this locus, the presence of CpG islands (green square), its H3K27ac active marker coverage and its TFBS (Transcription Factor Binding Site) coverage (from the JASPAR database) are shown. The red arrow indicates the sense of transcription. At the bottom of the image, the different CGs within DMRs are indicated.
Figure 5
Figure 5
DNA methylation signatures “normalize” in response to treatment. (A) Heat map displaying differentially methylated positions (DMPs) in CD4+ T-cells from “all” psoriasis patients (N = 4 psoriasis and N = 1 psoriatic arthritis) before and after treatment (N = 5 psoriasis and N = 4 psoriatic arthritis) (FDR < 0.05, |Δβ| > 0.1) with TNF or IL-17A inhibitors. Light purple and dark purple indicate the first and (where available) the second time-point after-treatment. Normalized DNA methylation levels are shown on the right with red indicating reduced methylation and yellow indicating increased methylation levels. (B) Bar diagrams depict results of the KEGG pathway enrichment analysis of hypermethylated genes which presented at least one DMP in their promoter. Top 10 pathways are represented, and the statistically significant ones are framed in blue. (C) IL17A/TNF methylation scores were calculated in patients before and after treatment and. in healthy control. ****p ≤ 0.0001, Anova and Tukey’s multiple comparisons. Medians are reported in red. (D) Correlation analysis between DNA methylation and PASI scores in the patient cohort before and after treatment. After assessing the Gaussian distribution, Pearson was used to measure the correlation.

Similar articles

Cited by

References

    1. Armstrong AW, Read C. Pathophysiology, clinical presentation, and treatment of psoriasis: A review. JAMA (2020) 323(19):1945–60. doi: 10.1001/jama.2020.4006 - DOI - PubMed
    1. FitzGerald O, Ogdie A, Chandran V, Coates LC, Kavanaugh A, Tillett W, et al. . Psoriatic arthritis. Nat Rev Dis Primers (2021) 7(1):59. doi: 10.1038/s41572-021-00293-y - DOI - PubMed
    1. Ritchlin CT, Colbert RA, Gladman DD. Psoriatic arthritis. N Engl J Med (2017) 376(10):957–70. doi: 10.1056/NEJMra1505557 - DOI - PubMed
    1. Haroon M, Gallagher P, FitzGerald O. Diagnostic delay of more than 6 months contributes to poor radiographic and functional outcome in psoriatic arthritis. Ann Rheumatic Dis (2015) 74(6):1045–50. doi: 10.1136/annrheumdis-2013-204858 - DOI - PubMed
    1. Carvalho AL, Hedrich CM. The molecular pathophysiology of psoriatic arthritis—The complex interplay between genetic predisposition, epigenetics factors, and the microbiome. Front Mol Biosci (2021) 8:662047. doi: 10.3389/fmolb.2021.662047 - DOI - PMC - PubMed

Publication types

Substances