. 2023 Aug 17:14:1239779.
doi: 10.3389/fimmu.2023.1239779. eCollection 2023.

Impaired tissue homing by the Ikzf3N159S variant is mediated by interfering with Ikaros function

Affiliations

Impaired tissue homing by the Ikzf3N159S variant is mediated by interfering with Ikaros function

Jingjie Chang et al. Front Immunol. .

Abstract

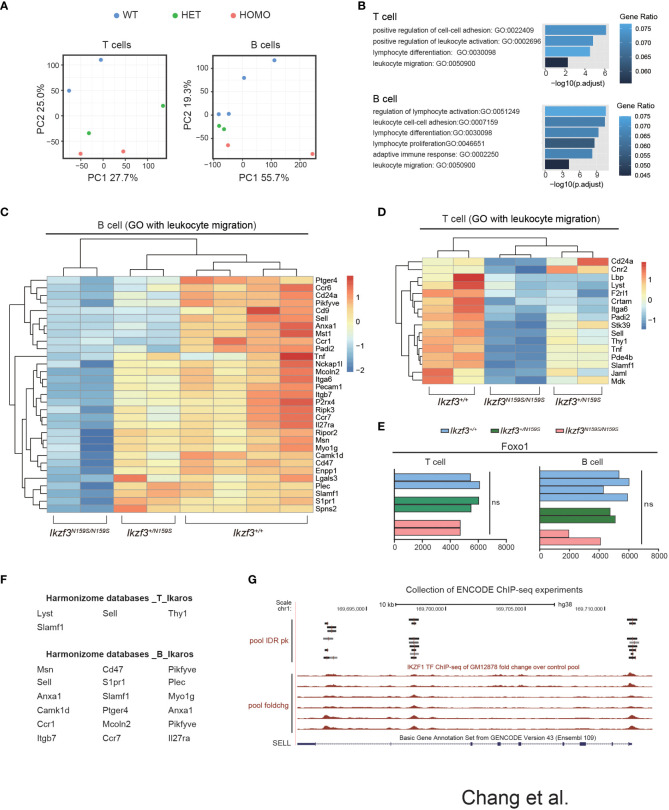
AIOLOS, encoded by IKZF3, is a member of the IKZF family of proteins that plays an important role in regulating late B-cell differentiation. Human individuals heterozygous for the AIOLOS p.N160S variant displayed impaired humoral immune responses as well as impaired B and T cell development. We have previously reported that a mouse strain harboring an Ikzf3N159S allele that corresponds to human IKZF3N160S recapitulated immune-deficient phenotypes, such as impaired B cell development and loss of CD23 expression. In this study, we investigated the effect of the Ikzf3N159S variant and found that B1a cell development was impaired in Ikzf3N159S/N159S mice. In addition, CD62L expression was severely decreased in both B and T lymphocytes by the Ikzf3N159S mutation, in a dose-dependent manner. Mixed bone marrow chimera experiments have revealed that most immunodeficient phenotypes, including low CD62L expression, occur in intrinsic cells. Interestingly, while Ikzf3N159S/N159S lymphocytes were still present in the spleen, they were completely outcompeted by control cells in the lymph nodes, suggesting that the capacity for homing or retention in the lymph nodes was lost due to the Ikzf3N159S mutation. The homing assay confirmed severely decreased homing abilities to lymph nodes of Ikzf3N159S/N159S B and T lymphocytes but selective enrichment of CD62L expressing Ikzf3N159S/N159S lymphocytes in lymph nodes. This finding suggests that impaired CD62L expression is the major reason for the impaired homing capacity caused by the Ikzf3N159S mutation. Interestingly, an excess amount of Ikaros, but not Aiolos, restored CD62L expression in Ikzf3N159S/N159S B cells. Together with the loss of CD62L expression due to Ikaros deficiency, the AiolosN159S mutant protein likely interferes with Ikaros function through heterodimerization, at least in activating the Sell gene encoding CD62L expression. Thus, our results revealed that AiolosN159S causes some immunodeficient phenotypes via the pathogenesis referred to as the heterodimeric interference as observed for AiolosG158R variant.

Keywords: CD62L; IKZF family proteins; heterodimeric interference; immune deficiency; lymphocyte homing.


Conflict of interest statement

The authors declare that the research was conducted in the absence of any commercial or financial relationships that could be construed as a potential conflict of interest.

Figures

Figure 1
Figure 1
Impaired B1a cell development in Ikzf3N159S/N159S mice. (A) Flow cytometric analysis of bone marrow cells from 6-12 weeks age mice with indicated genotypes. CD11bB220+ cells can be resolved into Fr.A-C (B220+CD43+) and Fr.D-E (B220+CD43) subsets. Fr.A-C and Fr.D-F subsets are divided into six subsets: Fr.A, Bp1CD24; Fr.B, Bp-1CD24+; Fr.C, Bp-1+CD24+; Fr.D, AA4.1+IgM; Fr.E&F, AA4.1+IgM+; Recirc.B, AA4.1IgM+. Numerical values in the plots indicate percentages of each subpopulation. (B) Graphs show the frequencies of B cell subsets in the bone marrow (n=3). The horizontal lines indicate the mean values from at least three different mice per group. (C) Flow cytometric analyzes of B1 (CD19hiB220lo) and B2 (CD19loB220hi) cell population in the peritoneal cavity, using the indicated markers. CD19hiB220loCD5+ (B1a) and CD19hiB220loCD5 (B1b) of the peritoneal cavity were stained. FACS analysis of B1 cell population from the peritoneal cavity stained for IgM and IgD. Numerical values in the plots indicate percentages of each subpopulation. (D) Frequencies of B1, B2 population (top-left) and the ratio of B2/B1 (top-right) in the peritoneal cavity from Ikzf3+/+ , Ikzf3+/N159S , Ikzf3N159S/N159S mice are shown (n=3). Additionally, the graph below shows the frequencies of IgM+IgD+, B1a and B1b subpopulations from total B1 cells (n=3). Statistically significant differences (Student’s unpaired, two-tailed t test) between the groups are shown. *, P < 0.05; **, P < 0.01; ***, P < 0.001; ****, P < 0.0001.
Figure 2
Figure 2
Low CD62L expression on T and B cells by AiolosN159S variant. (A) Flow cytometric analyses of thymocytes from Ikzf3+/+ , Ikzf3+/N159S , Ikzf3N159S/N159S mice, at age of 6-12 weeks. CD4 and CD8a were used to stain DN (CD4CD8), DP (CD4+CD8+), CD4 SP (CD4+CD8), CD8 SP (CD4CD8+) thymocyte subsets. CD62L expression levels on each thymocyte subsets are adjacently shown as histograms. (B) Graphs show cell numbers of CD4CD8, CD4+CD8+, CD4+CD8 and CD4CD8+ thymocytes (top) and the percentage of CD62L+ cells within each subset (bottom) (n=3). The horizontal lines indicate the mean values of at least three different mice per group. (C) Flow cytometric analyzes of CD62L expression on splenic B (B220+CD19+) cells. (D) Graphs show the frequency (top) and cell number (bottom) of CD62L+ cells from splenic B cell population from Ikzf3+/+ , Ikzf3+/N159S , Ikzf3N159S/N159S mice (n=3). Statistically significant differences (Student’s unpaired, two-tailed t test) between the groups are shown. *, P < 0.05; **, P < 0.01; ***, P < 0.001.
Figure 3
Figure 3
Cell intrinsic phenotypes by the AiolosN159S variant assessed by mixed bone marrow chimera experiment. (A) Flow cytometric analyses show the percentages of CD45.1+ (WT) versus CD45.2+ (Ikzf3+/+ or Ikzf3N159S/N159S ) donor cells in total bone marrow and in B cell population (B220+CD19+) from spleen, pLN, mLN and peritoneal cavity, after >8 weeks post-transplantation. (B) Ratios of CD45.2+/CD45.1+ cells in total bone marrow and B cell populations (B220+CD19+) from spleen, pLN and mLN, after >8 weeks post-transplantation (n=3). Each dot represents data from one recipient mouse. Data are presented as the mean ± SD, n = 3 per group. (C) Flow cytometric analyzes show the percentages of CD45.2 and CD45.1 donor cells in total cells of thymus and T cells (TCRβ+) from spleen, pLN and mLN, after >8 weeks post-transplantation. (D) Ratios of CD45.2+/CD45.1+ cells in total thymus and in T cells (TCRβ+) from spleen, pLN, mLN and peritoneal cavity, after >8 weeks post-transplantation. (E) Flow cytometric analyzes show percentage of CD45.2+ and CD45.1+ donor cells in splenic CD11b+CD11c cell, dendritic cell (DC), natural killer cell (NK), neutrophil (Neu.), eosinophil (Eos.), Monocyte (Mono.), Macrophage (MΦ) and Inflammatory monocyte (Inf. Mono.) subsets, after >8 weeks post-transplantation. (F) Ratios of CD45.2+/CD45.1+ cells in each splenic myeloid cell subset (CD11b+CD11c, DC, NK, Neu., Eos., Mono. & MΦ and Inf. Mono.) after >8 weeks post-transplantation (n=3). Statistically significant differences (Student’s unpaired, two-tailed t test) between the groups are shown. *, P < 0.05; **, P < 0.01; ****, P < 0.0001.
Figure 4
Figure 4
Cell intrinsic defect of CD62L and CD23 expression by the AiolosN159S variant. (A) Flow cytometric analyses show IgM, IgD, CD21 and CD23 expression level on B220+CD19+ splenic B cells from CD45.1+ (WT) versus CD45.2+ (Ikzf3+/+ or Ikzf3N159S/N159S ) donor cells, after >8 weeks post-transplantation. (B) Frequencies of splenic follicular B cell (CD21intCD23hi, FO), marginal zone B cell (CD21hiCD23lo/−, MZ), IgMIgD, IgM+IgD, IgM+IgD+ and IgMIgD+ subsets from CD45.2+ donor cells are shown (n=3). Each dot represents data from one recipient. Data are presented as the mean ± SD, n = 3 per group. (C) Flow cytometric analyses of CD4 and CD8a subsets of CD45.1+ or CD45.2+ donor cells from WT and Homo group, after >8 weeks post-transplantation. CD62L expression levels on each subset (CD4CD8, CD4+CD8+, CD4+CD8, CD4CD8+) are adjacently shown as histograms. (D) Graph shows the frequencies of CD62L+ of each thymocyte subset from CD45.2+ donor cells (n=3). (E) Flow cytometric analyses of CD44 and CD62L expression of CD45.2+ T cells in spleen and pLN (TCRβ+CD4+, TCRβ+CD8+), after >8 weeks post-transplantation. (F) Frequencies of CD62L+ cells from CD45.2+ T cell subsets in spleen and pLN are shown. Statistically significant differences (Student’s unpaired, two-tailed t test) between the groups are shown. *, P < 0.05; **, P < 0.01; ***, P < 0.001; ****, P < 0.0001.
Figure 5
Figure 5
Impaired Homing ability of Ikzf3N159S/N159S lymphocytes. (A) Ly5.2 (CD45.2+) Ikzf3+/+ (WT group) or Ikzf3N159S/N159S (Homo group) splenic cells were mixed with Ly5.1 (CD45.1+) wild type (WT) splenic cells and injected into sub-lethally irradiated CD45.1+CD45.2+ recipient mice. Flow cytometry was used to assess the input ratio (Ri) of CD45.2+CD45.1 and CD45.2CD45.1+ in B220+CD19+ or TCRβ+CD3+ population before injection. After 24h post-injection, flow cytometric analyzes shows ratios of CD45.2+CD45.1 and CD45.2CD45.1+ donor cells in B or T cell populations from various organs (Ro). The ratio of Ro and Ri is analyzed as the homing index. (B) Flow cytometric analyzes shows ratios of CD45.2+ and CD45.1+ cells in B220+CD19+ B cells, from input and 24h post-transplanted organs (PBL, spleen, and pLN), alongside CD62L expression levels on CD45.2+ B cells. (C) B cell homing indexes of PBL, spleen, pLN, and mLN, from WT and Homo groups, are shown on the left. The horizontal lines indicate the mean values of at least three mice per group. The frequencies of CD62L+ cells in CD45.2+ B cell population from input and 24h post-transplanted organs (PBL, spleen, pLN, and mLN) are shown on the right (n=4). Each dot represents data from one recipient mouse. Data are presented as the mean ± SD, n = 4 per group (right). (D) Flow cytometry analyses show ratios of CD45.2+ and CD45.1+ cells in TCRβ+CD3+ T cells, from input and 24h post-transplanted organs (PBL, spleen, and pLN), alongside CD62L expression levels on CD45.2+ T cells. (E) T cell homing indexes of PBL, spleen, pLN, and mLN, from WT and Homo groups, are shown on the left. The frequencies of CD62L+ cells from CD45.2+ T cell population from input and 24h post-transplanted organs (PBL, spleen, pLN, and mLN) are shown on the right (n=4). *, P < 0.05; **, P < 0.01; ***, P < 0.001; ****, P < 0.0001.
Figure 6
Figure 6
Dysregulated genes by AiolosN159S revealed by transcriptome analyses. (A) Principal component analysis (PCA) of the T and B cells transcriptomes from Ikzf3+/+ , Ikzf3+/N159S and Ikzf3N159S/N159S mice (n = 2 or 4 per genotype). (B) GO analysis of downregulated genes in Ikzf3+/N159S and Ikzf3N159S/N159S T and B cells, compared to Ikzf3+/+ controls, with FDR <0.05. Adjusted p values are presented for each GO term. Colors indicate ratio of number of downregulated genes within total number of genes included for each GO term. (C, D) Z-score heat maps of downregulated genes in Ikzf3N159S/N159S B cells (C) and T cells (D), with the GO term of leukocyte migration included. (E) Read counts of Foxo1 in RNA-seq are shown. (F) Putative IKZF1 target genes, abstracted by Harmonizome database among the downregulated genes in Ikzf3N159S/N159S B and T cells. (G) UCSC Genome Browser track view of IKAROS ChIP-seq performed in GM12878 cell line (B-lymphocyte) in the ENCODE project, showing the binding by IKAROS around the SELL gene. Pool IDR pk is IKZF1 ChIP-seq of GM12878 irreproducible discovery rate (IDR) thresholded peaks pool. Pool foldchg is IKZF1 ChIP-seq of GM12878 fold change over control pool.
Figure 7
Figure 7
Overexpression of Ikaros restored CD62L expression in Ikzf3N159S/N159S B cells. (A) Immunoblot showing expression of Ikaros and Aiolos protein in packaging Plate E cell line transfected with empty vector (EV), pMigR1-Ikaros or pMigR1-Aiolos vector. (B) Zebra plots showing CD62L expression of retrovirally transduced Ikzf3+/+ and Ikzf3N159S/N159S B cells. DsRED and GFP fluorescent marker expression indicate Ikaros and Aiolos expression, respectively. Lower histograms showing CD62L expression on DsRED+ or GFP+ transduced cells. Numerical values in each histogram indicate percentages of each region. (C) Graphs show the percentage of CD62L+ in DsRED+ or GFP+ subset. Each circle represents data from one experiment. Data are presented as the mean ± SD, n = 3 per group. Student’ s unpaired, two-tailed t test). * P < 0.05.

Similar articles

Cited by

References

    1. Tangye SG, Al-Herz W, Bousfiha A, Cunningham-Rundles C, Franco JL, Holland SM, et al. Human inborn errors of immunity: 2022 update on the classification from the international union of immunological societies expert committee. J Clin Immunol (2022) 42(7):1473–507. doi: 10.1007/s10875-022-01289-3 - DOI - PMC - PubMed
    1. Tiri A, Masetti R, Conti F, Tignanelli A, Turrini E, Bertolini P, et al. Inborn Errors Immun Cancer Biol (Basel) (2021) 10(4). doi: 10.3390/biology10040313 - DOI - PMC - PubMed
    1. Liu L, Okada S, Kong XF, Kreins AY, Cypowyj S, Abhyankar A, et al. Gain-of-function human STAT1 mutations impair IL-17 immunity and underlie chronic mucocutaneous candidiasis. J Exp Med (2011) 208(8):1635–48. doi: 10.1084/jem.20110958 - DOI - PMC - PubMed
    1. Smits BM, Hartley T, Dünnebach E, Bartels M, Boycott KM, Kernohan KD, et al. Heterozygous variants in the DNA-binding domain of c-Myb may affect normal B/T cell development. Hemasphere (2022) 6(10):e774. doi: 10.1097/HS9.0000000000000774 - DOI - PMC - PubMed
    1. Punwani D, Zhang Y, Yu J, Cowan MJ, Rana S, Kwan A, et al. Multisystem AnoMalies in severe combined immunodeficiency with mutant BCL11B. N Engl J Med (2016) 375(22):2165–76. doi: 10.1056/NEJMoa1509164 - DOI - PMC - PubMed

Publication types

Substances