. 2023 Aug 17:14:1240678.
doi: 10.3389/fimmu.2023.1240678. eCollection 2023.

Therapeutic cancer vaccination against mutant calreticulin in myeloproliferative neoplasms induces expansion of specific T cells in the periphery but specific T cells fail to enrich in the bone marrow

Affiliations

Therapeutic cancer vaccination against mutant calreticulin in myeloproliferative neoplasms induces expansion of specific T cells in the periphery but specific T cells fail to enrich in the bone marrow

Morten Orebo Holmström et al. Front Immunol. .

Abstract

Background: Therapeutic cancer vaccination against mutant calreticulin (CALR) in patients with CALR-mutant (CALRmut) myeloproliferative neoplasms (MPN) induces strong T-cell responses against mutant CALR yet fails to demonstrate clinical activity. Infiltration of tumor specific T cells into the tumor microenvironment is needed to attain a clinical response to therapeutic cancer vaccination.

Aim: Determine if CALRmut specific T cells isolated from vaccinated patients enrich in the bone marrow upon completion of vaccination and explore possible explanations for the lack of enrichment.

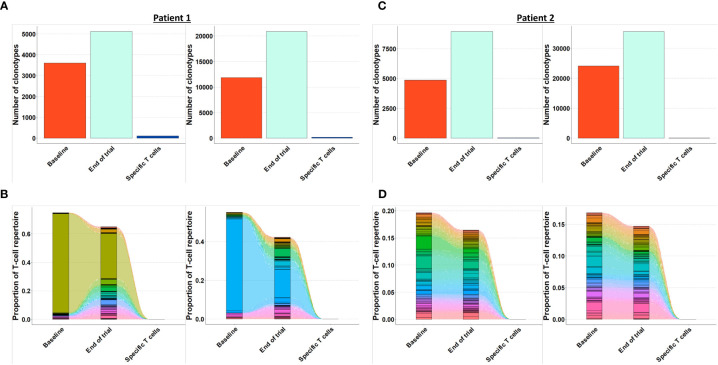
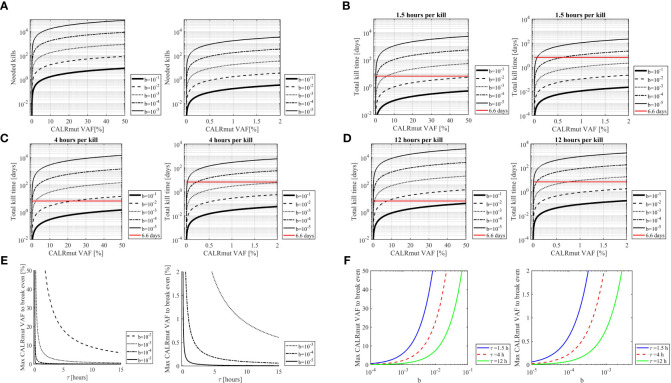
Methods: CALRmut specific T cells from four of ten vaccinated patients were expanded, enriched, and analyzed by T-cell receptor sequencing (TCRSeq). The TCRs identified were used as fingerprints of CALRmut specific T cells. Bone marrow aspirations from the four patients were acquired at baseline and at the end of trial. T cells were enriched from the bone marrow aspirations and analyzed by TCRSeq to identify the presence and fraction of CALRmut specific T cells at the two different time points. In silico calculations were performed to calculate the ratio between transformed cells and effector cells in patients with CALRmut MPN.

Results: The fraction of CALRmut specific T cells in the bone marrow did not increase upon completion of the vaccination trial. In general, the T cell repertoire in the bone marrow remains relatively constant through the vaccination trial. The enriched and expanded CALRmut specific T cells recognize peripheral blood autologous CALRmut cells. In silico analyses demonstrate a high imbalance in the fraction of CALRmut cells and CALRmut specific effector T-cells in peripheral blood.

Conclusion: CALRmut specific T cells do not enrich in the bone marrow after therapeutic cancer peptide vaccination against mutant CALR. The specific T cells recognize autologous peripheral blood derived CALRmut cells. In silico analyses demonstrate a high imbalance between the number of transformed cells and CALRmut specific effector T-cells in the periphery. We suggest that the high burden of transformed cells in the periphery compared to the number of effector cells could impact the ability of specific T cells to enrich in the bone marrow.

Keywords: adaptive immunity; calreticulin; cancer vaccines; immune escape; myeloproliferative neoplasms.


Conflict of interest statement

The authors declare that the research was conducted in the absence of any commercial or financial relationships that could be construed as a potential conflict of interest.

Figures

Figure 1
Figure 1
Visual abstract of the methods employed for the T cell receptor sequencing in this study. Four patients with a strong vaccine induced immune response to the CALRLong36 epitope were chosen as donors for expansion of CALRmut specific T cells. Firstly, patient peripheral blood mononuclear cells were stimulated in vitro with CALRLong36 peptide. Next CALRLong36 specific T cells were enriched using magnetically activated cells sorting of cytokine secreting cells, and the enriched cells were expanded using our rapid expansion protocol. Expanded cells were then restimulated with CALRLong36 peptide and enriched using fluorescense activated cells sorting (FACS) by gating on CD137+/CD107a+ double positive cells. Enriched cells were subjected to T-cell receptor sequencing (TCRSeq) which allowed us to identify sequence of the TCR in CALRmut specific T cells (Top, left to right). Bone marrow aspirations from the four patients were isolated at trial baseline and at end of trial. Bone marrow derived T cells from the aspirations were enriched using FACS by gating on live CD3+ events. The enriched cells were analyzed by TCRSeq and through our analyses of the TCR of CALRmut specific T cells above we ascertained the presence and fraction of CALRmut specific T cells (red TCR) in the bone marrow at baseline and at the end of the trial (Middle and below, left to right). Created with BioRender.com.
Figure 2
Figure 2
Enrichment of CALRLong36 specific T cells and bone marrow derived T cells using fluorescence activated cell sorting (FACS). (A) Four vaccinated CALRmut MPN-patients with a strong immune response to CALRLong36 at the end of trial were chosen for generation of CALRLong36 specific T-cell cultures. Patient peripheral blood mononuclear cells were enriched for CALRmut specific T cells as described in the methods section. The specific T cells were restimulated with peptide and labelled with fluorescence tagged antibodies. Specific cells were enriched as live CD3+, CD4+, CD107a+/CD137+ double positive events (patient 1 and 9) or as live CD3+, CD8+, CD107a+/CD137+ double positive events (patient 2 and 7) (top). Unstimulated cells were used to set sorting gate (middle). All enriched cells were subjected to purity analysis after enrichment (bottom). (B) Cryopreserved bone marrow mononuclear cells from the four patients were thawed and stained with dead cell marker and CD3-APC-H7 for enrichment of T cells derived from bone marrows acquired at baseline and at end-of-trial (top). Purity of the enriched fraction was analyzed post-enrichment (bottom).
Figure 3
Figure 3
Quantification and clonotype tracking of T cells in patient 1 and 2. (A) Quantification of the number of different clonotypes in patient 2 baseline sample, end-of-trial sample and specific T cell sample with α-chain shown to the left and β-chain shown to the right. (B) Clonotype tracking of the 100 most prevalent clonotypes in the end-of-trial sample from patient 2 showing tracking trajectories to baseline sample and specific T cells with α-chain shown to the left and β-chain shown to the right. (C) Same as A for patient 2. (D) Same as B for patient 2.
Figure 4
Figure 4
Quantification and clonotype tracking of T cells in patient 7 and 9. (A) Quantification of the number of different clonotypes in patient 7 baseline sample, end-of-trial sample and specific T cell sample with α-chain shown to the left and β-chain shown to the right. (B) Clonotype tracking of the 100 most prevalent clonotypes in the end-of-trial sample from patient 7 showing tracking trajectories to baseline sample and specific T cells with α-chain shown to the left and β-chain shown to the right. (C) Same as A for patient 9. (D) Same as B for patient 9.
Figure 5
Figure 5
Tracking of clonotypes in CALRmut specific T cells to baseline and end-of-trial samples. (A) Patient 1 clonotype tracking with α-chain to the left and β-chain to the right. (B) Patient 2 clonotype tracking with α-chain to the left and β-chain to the right. (C) Patient 7 clonotype tracking with α-chain to the left and β-chain to the right. (D) Patient 9 clonotype tracking with α-chain to the left and β-chain to the right.
Figure 6
Figure 6
Responses by CALRmut specific T cells to autologous monocytes and peripheral blood lymphocytes. (A) Purity analysis of enriched fractions of peripheral blood lymphocytes (PBL) and monocytes with the depiction of the CALR mutant variant allele frequency in each enrichment determined by digital droplet PCR. (B) Responses by 105 specific T cells stimulated with either 104 autologous PBL or 104 autologous monocytes in an overnight IFN-γ ELISPOT assay. Normalized spot count shown for each patient (top) with representative ELISPOT wells for PBL and monocyte stimulated T cells below. (C) Expression of HLA-I by patient 2 and 7 monocytes and PBL was assessed by fluorescent activated cell sorting (FACS). (D) Expression of HLA-II by patient 1 and 9 monocytes and PBL was assessed by FACS. Mean fluorescence intensities (MFIs) were calculated by subtracting the MFI of the isotype control from the real staining MFI. Error bars depict standard error of the mean. ** denotes p<0.05 according to the conservative distribution free resampling method (DFR2x) (18).
Figure 7
Figure 7
Ex vivo IFN-γ ELISPOT responses in patient 2 and 7 against CALRLong36. (A) Spot formation in patient 2 and 7 PBMC upon stimulation with the CALRLong36 peptide with unstimulated cells as negative controls. (B) Images of ex vivo responses in patient 2 and 7 PBMC. Error bars depict standard error of the mean. ** denotes p<0.05 according to the conservative distribution free resampling method (DFR2x) (18).
Figure 8
Figure 8
In silico analysis of the burden of transformed cells compared to the amount of CALRmut specific T cells. (A) The amount of needed kills required by each CALRmut specific T cell to curtail the CALRmut monocytes and neutrophils as a function of the CALRmut variant allele frequency (VAF). The higher the CALRmut VAF, the more kills are required by each T cell. Left panel shows CALRmut VAF interval of 0-50% with the right panel displaying 0-2% interval for at better resolution of the kills required for a low CALRmut VAF. The value b denotes the frequency of CALRmut specific T cells of the entire T cell repertoire and shows that the lower the values of b, the higher number of kills are required per specific T cell. (B) The time required for CALRmut specific T cells to kill the CALRmut monocytes and neutrophils as a function of the CALRmut VAF provided a T cell needs 1,5 hours to kill one transformed cell. The value b denotes the frequency of CALRmut specific T cells of the entire T-cell repertoire. The horizontal line (red) denotes the lifetime of neutrophils i.e., the dominant self-renewal time of transformed cells. Hence, the total kill time must be below this line to allow for eradication of all transformed cells. (C) Same as B but with a killing time of 4 hours. (D) Same as B and C but with a killing time of 12 hours. (E) The maximum allowed CALRmut VAF allowed for the cellular immune system to break even with the amount of CALRmut monocytes and neutrophils as a function of the time required for each specific T cell to kill a transformed cell. The value b denotes the frequency of CALRmut specific T cells of the entire T-cell repertoire. Left panel shows a CALRmut VAF interval of 0-50% with the right panel displaying 0-2% interval for a better resolution of low CALRmut VAF. (F) The maximum allowed CALRmut VAF for the cellular immune system to break even with the amount of CALRmut monocytes and neutrophils as a function of the fraction of CALRmut specific T cells in the entire T-cell repertoire. The colored lines depict different values of the time (τ) required for each T cell to kill one transformed cell. Left panel shows a CALRmut VAF interval of 0-50% with the right panel displaying 0-2% interval for a better resolution of low CALRmut VAF.

Similar articles

Cited by

References

    1. Campbell PJ, Green AR. The myeloproliferative disorders. N Engl J Med (2006) 355:2452–66. doi: 10.1056/NEJMra063728 - DOI - PubMed
    1. Kralovics R, Passamonti F, Buser AS, Teo S-S, Tiedt R, Passweg JR, et al. . A gain-of-function mutation of JAK2 in myeloproliferative disorders. N Engl J Med (2005) 352:1779–90. doi: 10.1056/NEJMoa051113 - DOI - PubMed
    1. Nangalia J, Massie CE, Baxter EJ, Nice FL, Gundem G, Wedge DC, et al. . Somatic CALR mutations in myeloproliferative neoplasms with nonmutated JAK2. N Engl J Med (2013) 369:2391–405. doi: 10.1056/NEJMoa1312542 - DOI - PMC - PubMed
    1. Klampfl T, Gisslinger H, Harutyunyan AS, Nivarthi H, Rumi E, Milosevic JD, et al. . Somatic mutations of calreticulin in myeloproliferative neoplasms. N Engl J Med (2013) 369:2379–90. doi: 10.1056/NEJMoa1311347 - DOI - PubMed
    1. Pietra D, Rumi E, Ferretti VV, Buduo CAD, Milanesi C, Cavalloni C, et al. . Differential clinical effects of different mutation subtypes in CALR-mutant myeloproliferative neoplasms. Leukemia (2016) 30:431–8. doi: 10.1038/leu.2015.277 - DOI - PMC - PubMed

Publication types