

Comorbidity network analysis using graphical models for electronic health records
- PMID: 37663273
- PMCID: PMC10470017
- DOI: 10.3389/fdata.2023.846202
Comorbidity network analysis using graphical models for electronic health records
Abstract
Importance: The comorbidity network represents multiple diseases and their relationships in a graph. Understanding comorbidity networks among critical care unit (CCU) patients can help doctors diagnose patients faster, minimize missed diagnoses, and potentially decrease morbidity and mortality.
Objective: The main objective of this study was to identify the comorbidity network among CCU patients using a novel application of a machine learning method (graphical modeling method). The second objective was to compare the machine learning method with a traditional pairwise method in simulation.
Method: This cross-sectional study used CCU patients' data from Medical Information Mart for the Intensive Care-3 (MIMIC-3) dataset, an electronic health record (EHR) of patients with CCU hospitalizations within Beth Israel Deaconess Hospital from 2001 to 2012. A machine learning method (graphical modeling method) was applied to identify the comorbidity network of 654 diagnosis categories among 46,511 patients.
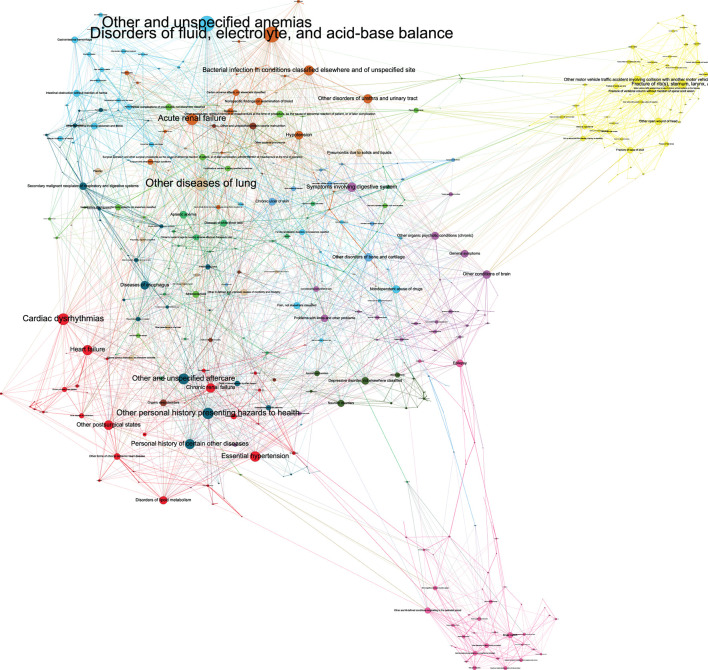
Results: Out of the 654 diagnosis categories, the graphical modeling method identified a comorbidity network of 2,806 associations in 510 diagnosis categories. Two medical professionals reviewed the comorbidity network and confirmed that the associations were consistent with current medical understanding. Moreover, the strongest association in our network was between "poisoning by psychotropic agents" and "accidental poisoning by tranquilizers" (logOR 8.16), and the most connected diagnosis was "disorders of fluid, electrolyte, and acid-base balance" (63 associated diagnosis categories). Our method outperformed traditional pairwise comorbidity network methods in simulation studies. Some strongest associations between diagnosis categories were also identified, for example, "diagnoses of mitral and aortic valve" and "other rheumatic heart disease" (logOR: 5.15). Furthermore, our method identified diagnosis categories that were connected with most other diagnosis categories, for example, "disorders of fluid, electrolyte, and acid-base balance" was associated with 63 other diagnosis categories. Additionally, using a data-driven approach, our method partitioned the diagnosis categories into 14 modularity classes.
Conclusion and relevance: Our graphical modeling method inferred a logical comorbidity network whose associations were consistent with current medical understanding and outperformed traditional network methods in simulation. Our comorbidity network method can potentially assist CCU doctors in diagnosing patients faster and minimizing missed diagnoses.
Keywords: comorbidity network analysis; critical care unit; electronic health records; graphic modeling method; machine learning.
Copyright © 2023 Zhao, Huepenbecker, Zhu, Rajan, Fujimoto and Luo.
Conflict of interest statement
The authors declare that the research was conducted in the absence of any commercial or financial relationships that could be construed as a potential conflict of interest.
Figures


Similar articles
-
Prediction of mortality events of patients with acute heart failure in intensive care unit based on deep neural network.Comput Methods Programs Biomed. 2024 Nov;256:108403. doi: 10.1016/j.cmpb.2024.108403. Epub 2024 Aug 30. Comput Methods Programs Biomed. 2024. PMID: 39236563
-
Comparison of Machine Learning Methods With Traditional Models for Use of Administrative Claims With Electronic Medical Records to Predict Heart Failure Outcomes.JAMA Netw Open. 2020 Jan 3;3(1):e1918962. doi: 10.1001/jamanetworkopen.2019.18962. JAMA Netw Open. 2020. PMID: 31922560 Free PMC article.
-
Comorbidity network for chronic disease: A novel approach to understand type 2 diabetes progression.Int J Med Inform. 2018 Jul;115:1-9. doi: 10.1016/j.ijmedinf.2018.04.001. Epub 2018 Apr 9. Int J Med Inform. 2018. PMID: 29779710
-
Biomechanisms of Comorbidity: Reviewing Integrative Analyses of Multi-omics Datasets and Electronic Health Records.Yearb Med Inform. 2016 Nov 10;(1):194-206. doi: 10.15265/IY-2016-040. Yearb Med Inform. 2016. PMID: 27830251 Free PMC article. Review.
-
State of the Art of Machine Learning-Enabled Clinical Decision Support in Intensive Care Units: Literature Review.JMIR Med Inform. 2022 Mar 3;10(3):e28781. doi: 10.2196/28781. JMIR Med Inform. 2022. PMID: 35238790 Free PMC article. Review.
Cited by
-
Trends and methods in intensive care unit (ICU) research using machine learning: latent dirichlet allocation (LDA)-based thematic literature review.BMC Med Inform Decis Mak. 2025 Jul 29;25(1):282. doi: 10.1186/s12911-025-03132-2. BMC Med Inform Decis Mak. 2025. PMID: 40731277 Free PMC article.
-
Applying precision medicine principles to the management of multimorbidity: the utility of comorbidity networks, graph machine learning, and knowledge graphs.Front Med (Lausanne). 2024 Jan 24;10:1302844. doi: 10.3389/fmed.2023.1302844. eCollection 2023. Front Med (Lausanne). 2024. PMID: 38404463 Free PMC article. Review.
-
Clinically validated graphical approaches identify hepatosplenic multimorbidity in individuals at risk of schistosomiasis.R Soc Open Sci. 2025 Jul 16;12(7):242256. doi: 10.1098/rsos.242256. eCollection 2025 Jul. R Soc Open Sci. 2025. PMID: 40894104 Free PMC article.
-
The first comorbidity networks in companion dogs in the Dog Aging Project.bioRxiv [Preprint]. 2024 Dec 20:2024.12.18.629088. doi: 10.1101/2024.12.18.629088. bioRxiv. 2024. Update in: PLoS Comput Biol. 2025 Aug 14;21(8):e1012728. doi: 10.1371/journal.pcbi.1012728. PMID: 39763936 Free PMC article. Updated. Preprint.
-
Constructing the first comorbidity networks in companion dogs in the Dog Aging Project.PLoS Comput Biol. 2025 Aug 14;21(8):e1012728. doi: 10.1371/journal.pcbi.1012728. eCollection 2025 Aug. PLoS Comput Biol. 2025. PMID: 40811246 Free PMC article.
References
-
- Bastian M., Heymann S., Jacomy M. (2009). “Gephi: an open source software for exploring and manipulating networks,” in Proceedings of the International AAAI Conference on Web and Social Media, 3, 361–362. 10.1609/icwsm.v3i1.13937 - DOI
Grants and funding
LinkOut - more resources
Full Text Sources