. 2023 Aug 30:11:e15647.
doi: 10.7717/peerj.15647. eCollection 2023.

Adrenal SGLT1 or SGLT2 as predictors of atherosclerosis under chronic stress based on a computer algorithm

Affiliations

Adrenal SGLT1 or SGLT2 as predictors of atherosclerosis under chronic stress based on a computer algorithm

Jianyi Li et al. PeerJ. .

Abstract

Background: Chronic stress promotes the development of atherosclerosis, causing disruptions in the body's hormone levels and changes in the structural function of organs.

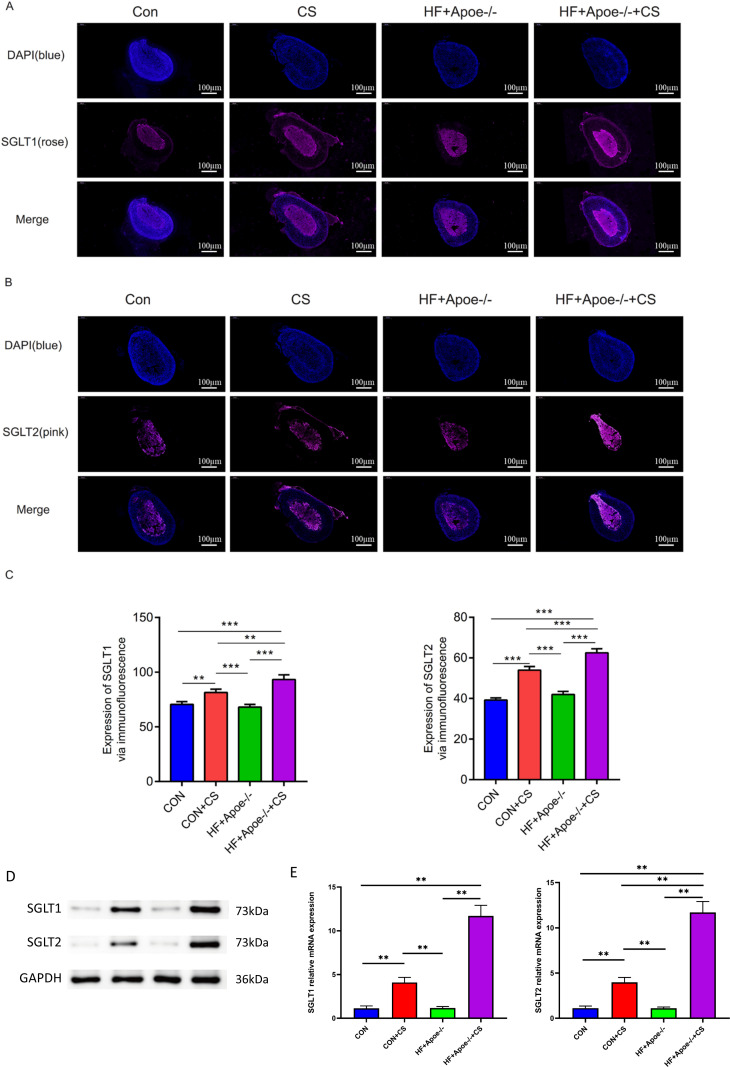
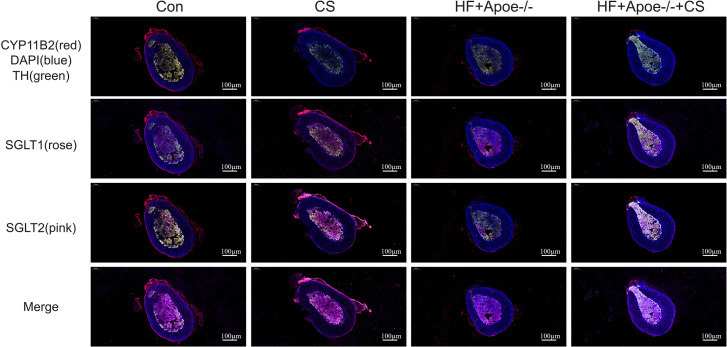
Objective: The purpose of this study was to investigate the pathological changes in the adrenal gland in a model of atherosclerosis under chronic stress and to verify the expression levels of Sodium-glucose cotransporter (SGLT) 1 and SGLT2 in the adrenal gland and their significance in the changes of adrenal gland.

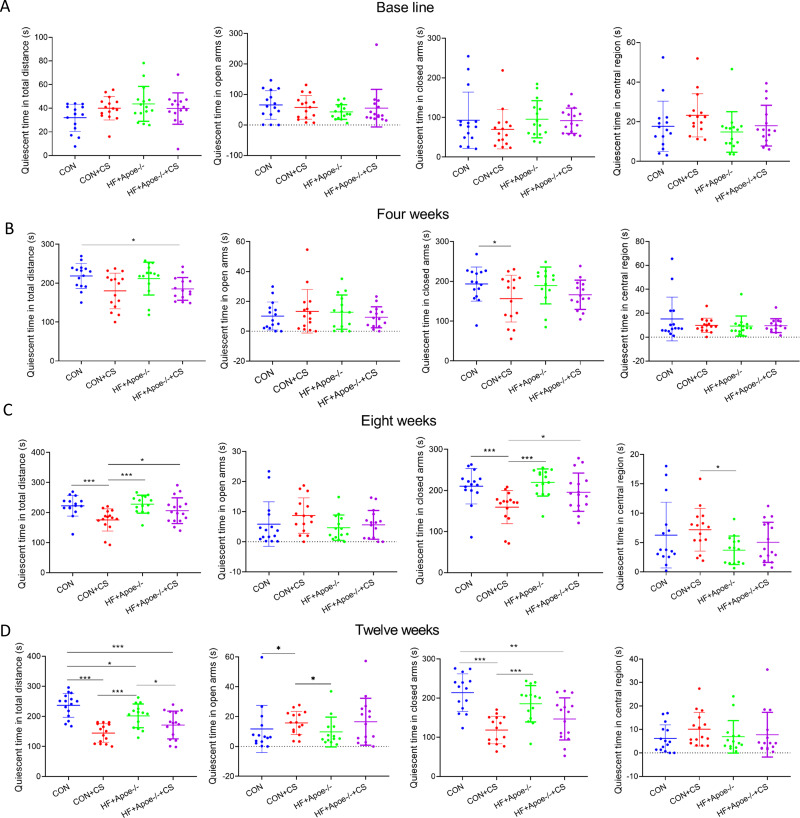
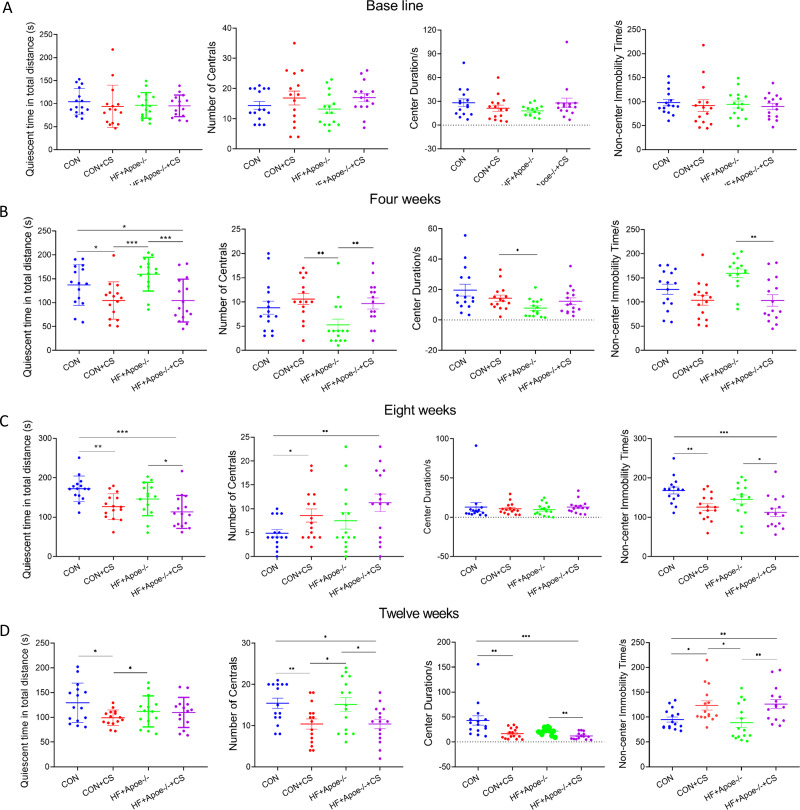
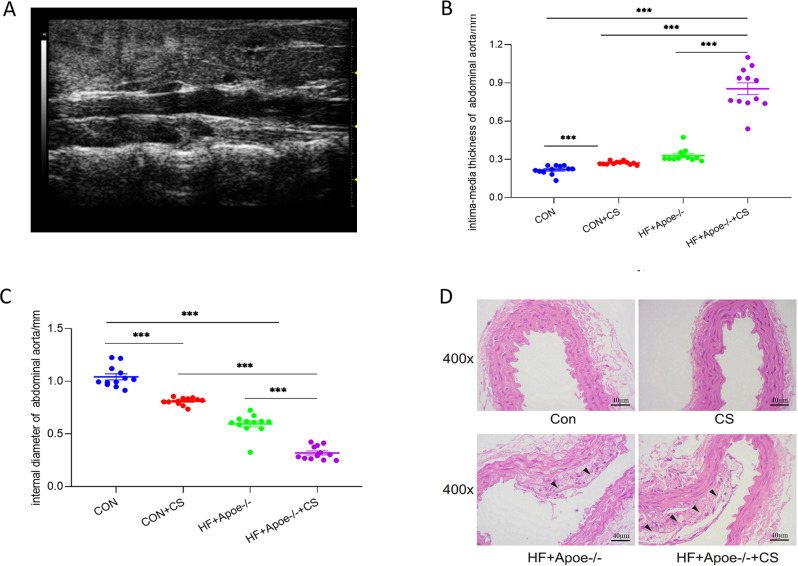
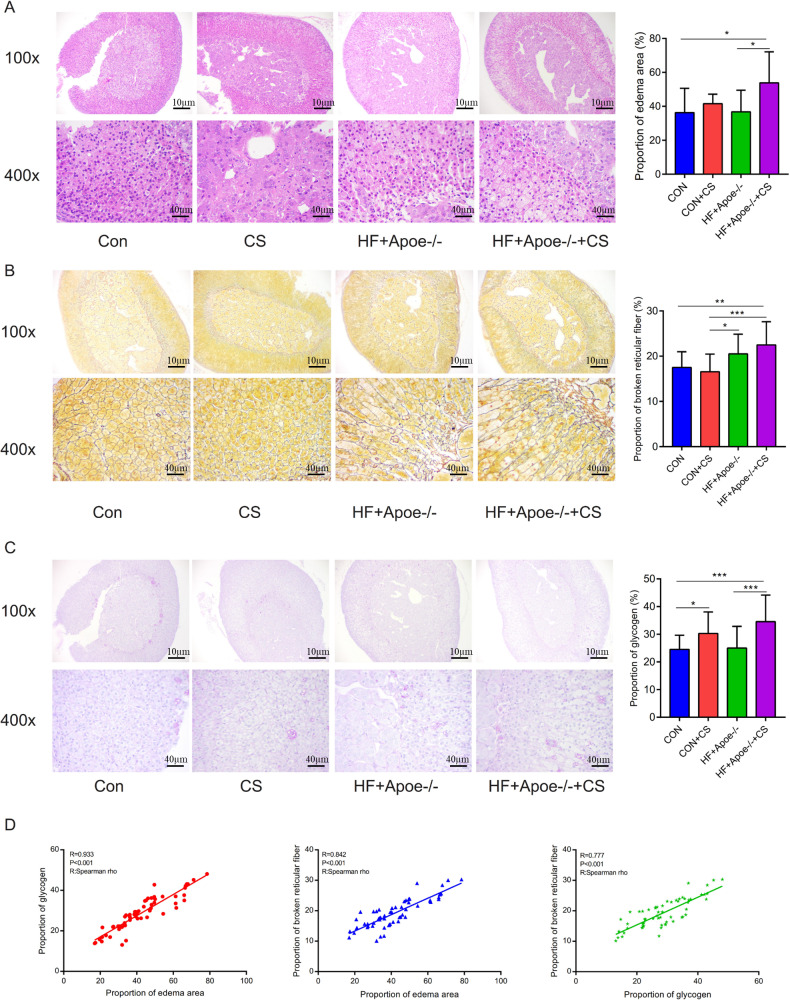
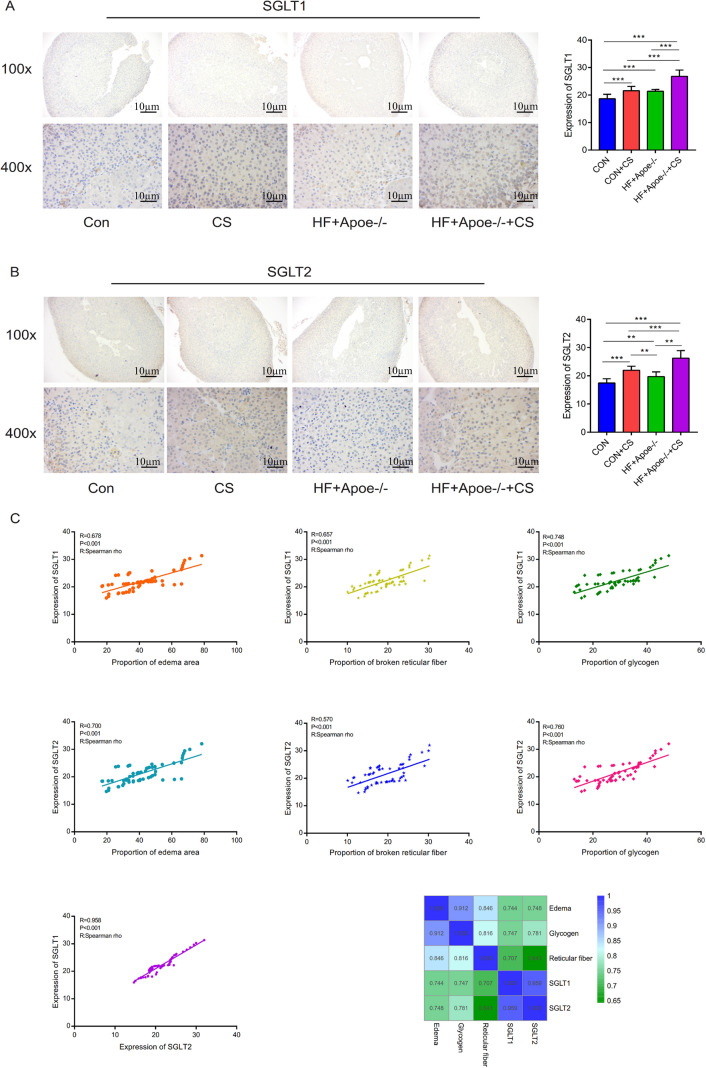
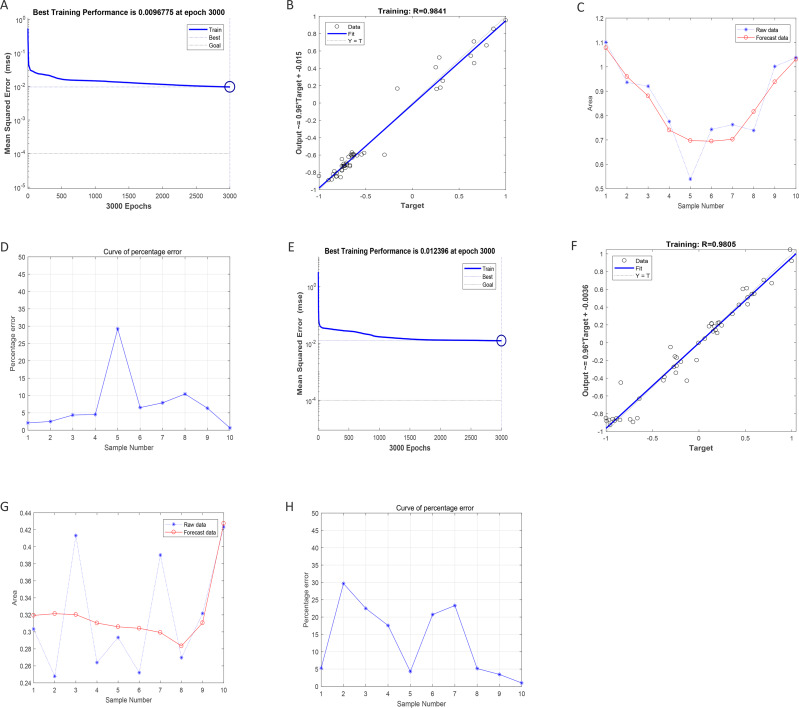
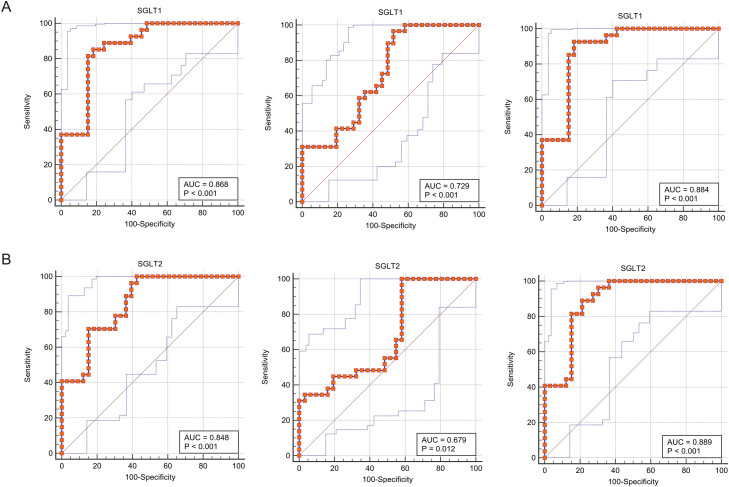
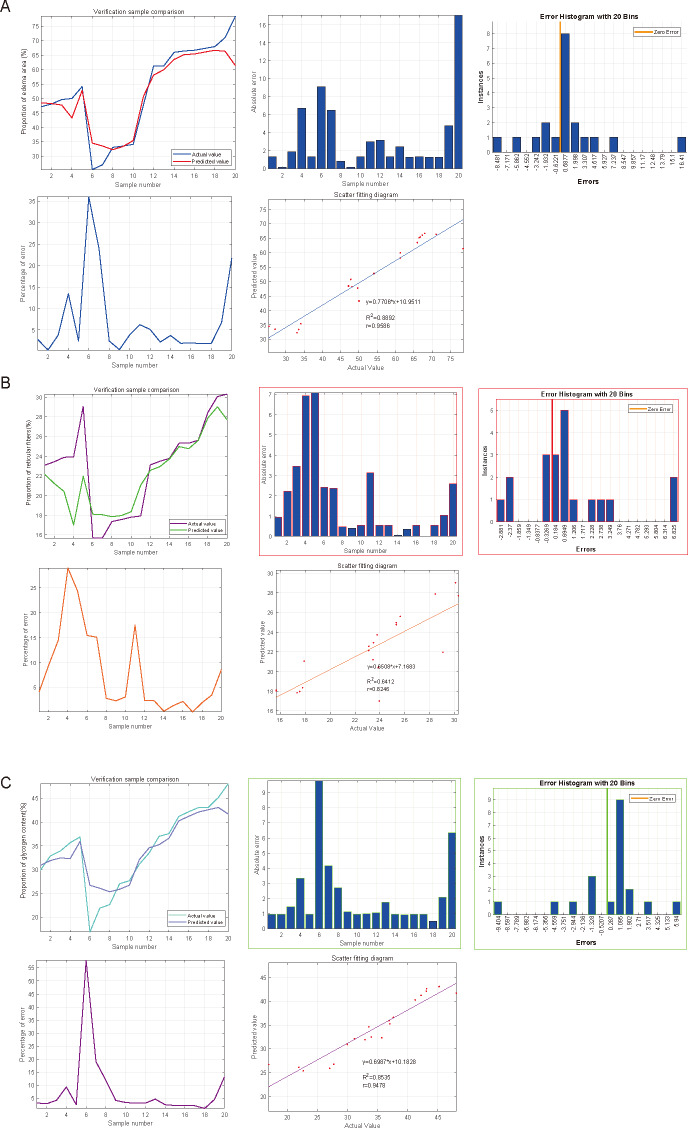
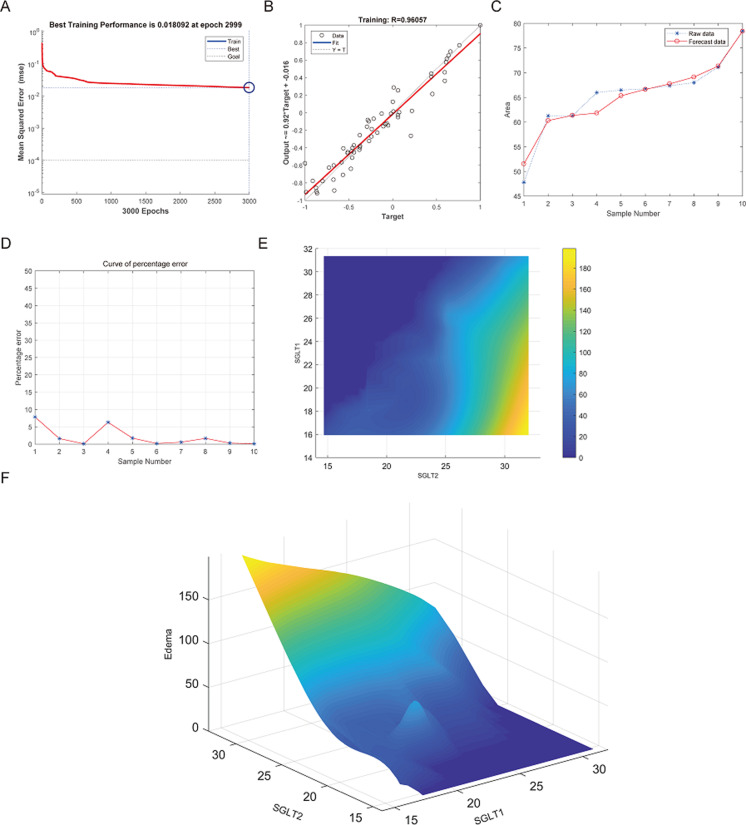
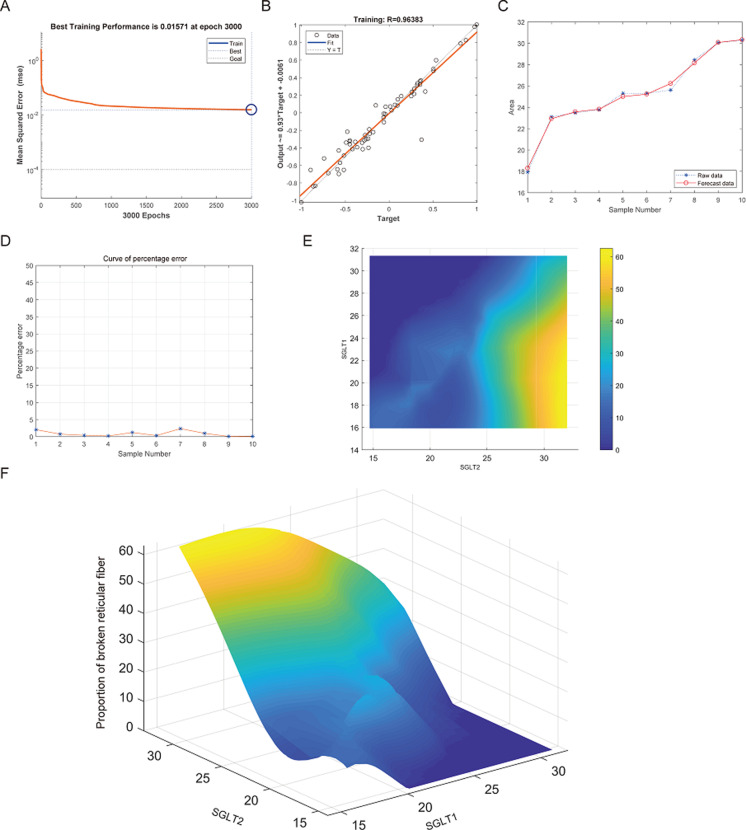
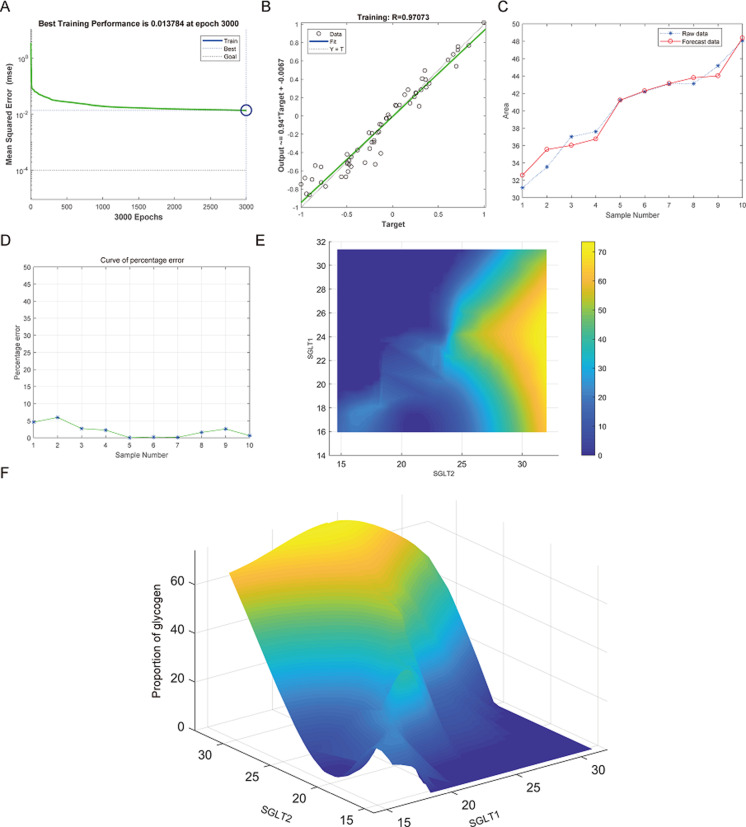
Methods: The model mice were constructed by chronic unpredictable stress, high-fat diet, and Apoe-/- knockout, and they were tested behaviorally at 0, 4, 8 and 12 weeks. The state of the abdominal artery was examined by ultrasound, and the pathological changes of the aorta and adrenal glands were observed by histological methods, and the expression levels and distribution of SGLT1 and SGLT2 in the adrenal gland were observed and analyzed by immunofluorescence and immunohistochemistry. The predictive value of SGLT1 and SGLT2 expression levels on intima-media thickness, internal diameter and adrenal abnormalities were verified by receiver operating characteristic (ROC) curves, support vector machine (SVM) and back-propagation (BP) neural network.

Results: The results showed that chronic stress mice had elevated expression levels of SGLT1 and SGLT2. The model mice developed thickening intima-media and smaller internal diameter in the aorta, and edema, reticular fiber rupture, increased adrenal glycogen content in the adrenal glands. More importantly, analysis of ROC, SVM and BP showed that SGLT1 and SGLT2 expression levels in the adrenal glands could predict the above changes in the aorta and were also sensitive and specific predictors of adrenal abnormalities.

Conclusion: SGLT1 and SGLT2 could be potential biomarkers of adrenal injury in atherosclerosis under chronic stress.

Keywords: Adrenal gland; Atherosclerosis; Chronic stress; Predictors; SGLT1; SGLT2.


Conflict of interest statement

The authors declare there are no competing interests.

Figures

Figure 1
Figure 1. Behavioral results of elevated plus maze.
(A) At baseline, there were no significant differences in the quiescent time in the distance, open arm, closed arm, and the central region among the four groups of mice. (B–D) Changes in the quiescent time in the above four regions between the four groups after 4, 8 and 12 weeks of CUMS intervention, respectively, reflecting the degree of excitation in mice. * P < 0.05, ** P < 0.01, *** P < 0.001; ns =no significance.
Figure 2
Figure 2. Behavioral results of the open-field test.
(A–D) Changes in the quiescent time in distance, number of times entering the centrals, duration in the center and non-center immobility time in four groups at baseline, and after 4, 8 and 12 weeks of CUMS intervention. * P < 0.05, ** P < 0.01, *** P < 0.001; ns =no significance.
Figure 3
Figure 3. Atherosclerosis model evaluation.
(A) Typical irregular plaque formation and luminal stenosis with disrupted continuity in the abdominal aorta of HF+Apoe-/-+CS mice. (B) The intima-media thickness of the abdominal aorta in different groups of mice. (C) Intra-aortic diameter in different groups of mice. (D) HE staining of the aorta of different groups of mice showing plaque formation in HF+Apoe-/- and HF+Apoe-/-+CS groups.
Figure 4
Figure 4. Atherosclerosis under chronic stress leaded to adrenal injury.
(A) HE staining showed different degrees of adrenal edema in the four groups. (B) Silver staining demonstrated that black-stained reticular fibers were broken significantly in the HF+Apoe-/- and HF+Apoe-/-+CS groups. (C) Glycogen staining revealed higher glycogen content in the CON+CS group and HF+Apoe-/-+CS group than that in the CON group and the HF+Apoe-/- group. (D) There was a positive correlation between glycogen ratio, reticular fiber breaks, and adrenal edema area. * P < 0.05, ** P < 0.01, *** P < 0.001; ns =no significance.
Figure 5
Figure 5. SGLT1 and SGLT2 expression levels in the adrenal gland.
(A–B) Rose-colored SGLT1 fluorescence and pink-colored SGLT2 fluorescence could be seen in the adrenal cross sections of the four groups. (C) Semi-quantitative analysis of SGLT1 and SGLT2 expression in the adrenal glands of four groups showed that SGLT1 and SGLT2 expression levels were higher in mice after stress than in the corresponding non-stressed mice. (D) Expression of SGLT1 and SGLT2 was determined by Western blot analysis. (E) mRNA expression of SGLT1 and SGLT2 was detected by qPCR.
Figure 6
Figure 6. Distribution of SGLT1 and SGLT2 in the adrenal gland.
CYP11B2 labeled in red showed the adrenal cortex region, while tyrosine hydroxylase (TH) labeled in green showed the adrenal medulla. The nucleus was stained blue by DAPI. SGLT1 was detected by a rose and SGLT2 by a pink. The distribution of SGLT1 and SGLT2 in the adrenal glands of mice in the CON, CON+CS, HF+Apoe-/-, and HF+Apoe-/-+CS groups was observed to be altered by chronic stress.
Figure 7
Figure 7. Distribution and significance of SGLT1 and SGLT2 in the adrenal gland based on immunohistochemistry.
(A) The distribution of SGLT1 was observed under low and high magnification, and the differences in SGLT1 expression level in the adrenal gland of mice in the four groups were analyzed by semi-quantitative methods. (B) The distribution of SGLT2 was observed under high and low magnification in the adrenal gland, and the differences in expression between the four groups were analyzed. (C) Edema, glycogen content, and reticulocyte fiber breakage were positively correlated with the expression levels of SGLT1 and SGLT2 in the adrenal gland, respectively.* P < 0.05, ** P < 0.01, *** P < 0.001; ns =no significance.
Figure 8
Figure 8. Neural network models prediction of the intima-media thickness and internal diameter of the abdominal aorta.
(A) Best training score of 0.0096775 with an epoch of 3000 after BP-neural network training for predicting intima-media thickness of abdominal aorta from SGLT1 and SGLT2 expression levels. (B) Relativity of 0.9841 with good correlation between input and output quantities. (C–D) Validation of the predicted data and the original values, with only small differences. (E) Best training score of 0.012396 with an epoch of 3000 after training the BP-neural network for predicting the internal diameter of abdominal aorta from SGLT1 and SGLT2 expression levels. (F) Relativity of 0.9805, with a good correlation between input and output volumes. (G–H) Validation of predicted data and original values.
Figure 9
Figure 9. ROC curves validated the predictive value of SGLT1 and SGLT2 for the degree of adrenal injury.
(A) The ROC curves showed that the expression level of SGLT1 in the adrenal gland sensitively and specifically predicted adrenal edema, broken reticular fibers, and glycogen content. (B) The ROC curves showed that the expression level of SGLT2 in the adrenal gland sensitively and specifically predicted adrenal edema, broken reticular fibers, and glycogen content.
Figure 10
Figure 10. Predicted significances of SGLT1 and SGLT2 expression levels on adrenal edema, reticulocytes, and glycogen.
(A) The predicted value of SGLT1 and SGLT2 expression levels on adrenal edema was 0.9596 with a mean error of 3.31% by the SVM method. (B) The predicted value of SGLT1/2 expression levels for broken reticular fibers was 0.8246 with a mean error of 1.81%. (C) The predicted value of SGLT1/2 expression levels for glycogen content was 0.9478 with a mean error of 2.15%.
Figure 11
Figure 11. Prediction and high-risk warning range of adrenal edema based by SGLT1 and SGLT2 expression levels.
(A–B) Best training score of 0.018092 at epoch 2999 and relativity of 0.96057 of BP-neural network for predicting adrenal edema from SGLT1 and SGLT2 expression levels after training. (C–D) Validation of the predicted values with the original values revealed only small differences. (E–F) A high-risk warning indicator for adrenal edema derived from SGLT1 and SGLT2 expression levels was found by an interpolation algorithm and presented with a three-dimensional (3D) stereogram of the warning range.
Figure 12
Figure 12. Prediction and high-risk warning range of adrenal reticular fiber breakage based by SGLT1 and SGLT2 expression levels.
(A–B) The optimal training score for SGLT1 and SGLT2 to predict adrenal reticular fiber breakage was 0.01571 at epoch 3000 with relativity of 0.96383. (C–D) The predicted data were verified against the original values and a significant difference was found between the two. (E–F) High-risk warning indicators for adrenal reticular fiber breakage were determined from SGLT1 and SGLT2 expression levels, and the warning range was presented with a 3D stereogram.
Figure 13
Figure 13. Prediction and high-risk warning range of adrenal glycogen content based by SGLT1 and SGLT2 expression levels.
(A–B) The best training score was 0.013784 at epoch 3000 with a relativity of 0.97073. (C–D) Validation revealed only small differences between the predicted values and the original values. (E–F) High-risk warning indicators for adrenal gland glycogen content were determined from SGLT1 and SGLT2 expression levels, and the warning range was presented with a 3D stereogram.

Similar articles

Cited by

References

    1. Bangasser DA, Sanchez EO. Modulating chronic stress. ELife. 2020;9:e63996. doi: 10.7554/eLife.63996. - DOI - PMC - PubMed
    1. Bhatt DL, Szarek M, Steg PG, Cannon CP, Leiter LA, McGuire DK, Lewis JB, Riddle MC, Voors AA, Metra M, Lund LH, Komajda M, Testani JM, Wilcox CS, Ponikowski P, Lopes RD, Verma S, Lapuerta P, Pitt B. Sotagliflozin in patients with diabetes and recent worsening heart failure. New England Journal of Medicine. 2021;384:117–128. doi: 10.1056/NEJMoa2030183. - DOI - PubMed
    1. Cavieres FA. Inflammation as a common pathogenic factor in coronary artery disease and depression. Revista Medica de Chile. 2020;148:224–232. doi: 10.4067/s0034-98872020000200224. - DOI - PubMed
    1. Childs BG, Baker DJ, Wijshake T, Conover CA, Campisi J, Van Deursen JM. Senescent intimal foam cells are deleterious at all stages of atherosclerosis. Science. 2016;354:472–477. doi: 10.1126/science.aaf6659. - DOI - PMC - PubMed
    1. Cohen BE, Edmondson D, Kronish IM. State of the art review: depression, stress, anxiety, and cardiovascular disease. American Journal of Hypertension. 2015;28:1295–1302. doi: 10.1093/ajh/hpv047. - DOI - PMC - PubMed

Publication types

Substances