. 2023 Aug 29:16:3763-3781.
doi: 10.2147/JIR.S420164. eCollection 2023.

Characteristics of Autophagy-Related Genes, Diagnostic Models, and Their Correlation with Immune Infiltration in Keratoconus

Affiliations

Characteristics of Autophagy-Related Genes, Diagnostic Models, and Their Correlation with Immune Infiltration in Keratoconus

Yi Liu et al. J Inflamm Res. .

Abstract

Purpose: Keratoconus (KTCN) is one of the most common degenerative keratopathies, significantly affecting vision and even leading to blindness. This study identifies potential biomarkers of KTCN based on the characterization of autophagy-related genes (ARGs) and the construction of a diagnostic model; and explores their relevance to immune infiltrating cells in KTCN.

Methods: Gene Expression Omnibus (GEO) data were downloaded and ARGs were acquired from GeneCards and Molecular Signatures Database (MSigDB). Autophagy-related differential expression genes (ARDEGs) were discovered through the integration of differentially expressed genes (DEGs) with ARGs, while hub genes of KTCN were discovered by protein-protein interaction (PPI) network analysis. The probable biological roles of these hub ARDEGs were examined using functional enrichment analysis, and a KTCN diagnostic model was generated using the least absolute shrinkage and selection operator (LASSO) regression analysis. We also employed the CIBERSORTx and ssGSEA algorithms to identify potential regulatory pathways to compare the abundance of immune cell infiltrates and their association with hub genes. Finally, the hub gene expression levels were confirmed using validation datasets as well as blood samples from KTCN and healthy individuals.

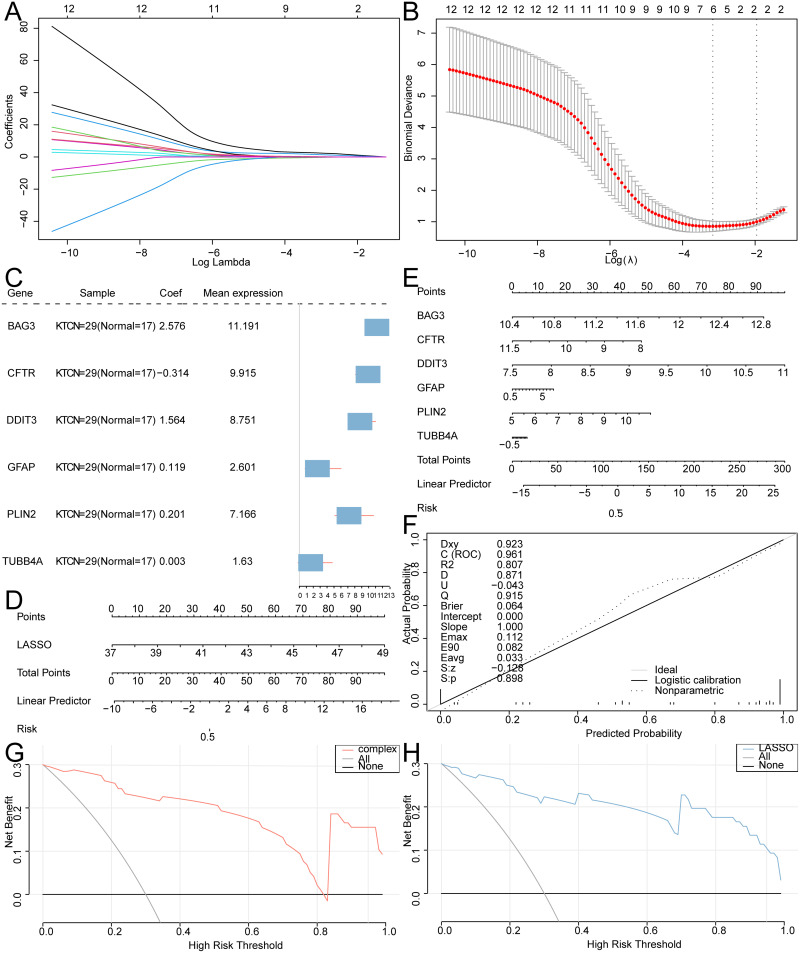
Results: In this study, we identified 12 hub ARDEGs, of which 9 genes were substantially distinct between KTCN patients and normal groups. The LASSO risk score was used to generate the nomogram, and the calibration curve evaluated the model's effective diagnostic performance (C index of 0.961). Patients with KTCN had greater percentages of M2 Macrophages and Gamma delta T cells, according to CIBERSORTx and ssGSEA. The outcomes of the bioinformatics analysis were supported by the DDIT3 and BINP3 expression levels in KTCN patients and healthy controls, according to the qRT-PCR data.

Conclusion: Five biomarkers (CFTR, PLIN2, DDIT3, BAG3, and BNIP3) and diagnostic models offer fresh perspectives on identifying and managing KTCN.

Keywords: autophagy-related genes; bioinformatics analysis; biomarker; diagnostic model; immune infiltration; keratoconus.


Conflict of interest statement

The authors report no conflicts of interest in this work.

Figures

Figure 1
Figure 1
Flowchart of the Research Methodologies.
Figure 2
Figure 2
Data set integration. (A) Two-dimensional PCA of the merged dataset before correction. (B) Two-dimensional PCA of the merged dataset after correction.
Figure 3
Figure 3
Analysis of autophagy-related differentially expressed genes. (A) Volcano map of DEGs in the KTCN and Normal groups of the combined dataset. (B) Wayne diagram of DEGs and ARGs. (C) Heatmap of ARDEGs in the KTCN and Normal groups of the combined dataset. (D) A histogram representing the ARDEGs’ GO analysis findings. (E) A histogram representing the ARDEGs’ KEGG analysis findings.
Figure 4
Figure 4
PPI network and mRNA-miRNA, mRNA-TF interaction network. (A) PPI network of ARDEGs. (B) Venn diagram of shared genes for the top 15 ARDEGs selected under the five algorithms of MCC, MNC, EPC, Degree, and Closeness. (C and D) mRNA-miRNA (C), mRNA-TF (D) interactions network of hub genes. (E) The chromosome of hub genes Localization map. In C-D, green circular blocks are mRNAs; purple-pink circular blocks are miRNAs; Orange circular blocks are specific TFs.
Figure 5
Figure 5
Construction of the diagnostic model of hub genes and diagnostic performance. (A) Value of the 12 genes’ log (Lambda) in the LASSO model. (B) The most proper log (Lambda) value in the LASSO model. (C) Forest plot of the six selected genes in the diagnostic model. (D) Nomogram of the LASSO risk score. (E) Nomogram of the expression of 6 hub genes. (F) Calibration plot of the LASSO risk score model. (G) DCA plot of the 6 hub genes. (H) DCA plot of the LASSO risk score. In the DCA plot, the x-axis denotes the threshold probability, and the y-axis, the net benefit.
Figure 6
Figure 6
Expression of hub genes in the combined dataset. (A) Comparison graph of the grouping of hub genes in the KTCN and Normal groups in the combined dataset. (B-J) Correlation scatter plots of TGFB1 and BAG3 (C), SQSTM1 and HMOX1 (D), UBC and HMOX1 (E), UBC and SQSTM1 (F), CFTR and BAG3 (G), HMOX1 and CFTR (H), TGFB1 and CFTR (I), and TUBB4A and CFTR (J). *P < 0.05; ** P < 0.01; *** P < 0.001.
Figure 7
Figure 7
Immuno-infiltration analysis of the combined data set (CIBERSORTx). (A) Grouped comparison plots of immune cells in different subgroups in the combined dataset. (B-D) Lollipop charts of correlation of immune cells M0 Macrophages (B), M2 Macrophages (C), and Tregs (D) with hub genes. *P < 0.05, **P < 0.01, ***P < 0.001.
Figure 8
Figure 8
Immuno-infiltration analysis of the combined data set (ssGSEA). (A) Grouping comparison plots of immune cells under different groupings of KTCN and Normal. B. Heatmap of correlation between immune cells. (C-F) Correlation scatter diagram of central memory CD8 T cells and Natural killer cells (C), central memory CD8 T cells and pDC (D), gamma delta T cell and effector memory CD8 T cell (E), and natural killer cell and gamma delta T cell (F). (G) Heatmap of correlation between hub genes and immune cells. (H-K) Correlation scatter diagram of TGFB1 and pDC (H), UBC and pDC (I), CFTR and pDC (J), DDIT3 and gamma delta T cell (K). ns, not significant, * P < 0.05, ** P < 0.01, *** P < 0.001.
Figure 9
Figure 9
Expression validation of hub genes in the GSE77938 dataset. (A) Grouping comparison plot of hub genes under KTCN grouping and normal grouping in the GSE77938 dataset. (B) ROC curve of BNIP3. (C) ROC curve of CFTR. * P < 0.05; ** P < 0.01.
Figure 10
Figure 10
Quantitative real-time PCR results for hub genes in healthy controls (HC) and KTCN patients. (A) qRT-PCR result for DDIT3 in HC and KTCN patients. (B) qRT-PCR result for BNIP3 in HC and KTCN patients. **P < 0.01, ****P < 0.0001.

References

    1. Ferrari G, Rama P. The keratoconus enigma: a review with emphasis on pathogenesis. Ocul Surf. 2020;18(3):363–373. doi:10.1016/j.jtos.2020.03.006 - DOI - PubMed
    1. Hashemi H, Heydarian S, Hooshmand E, et al. The prevalence and risk factors for keratoconus: a systematic review and meta-analysis. Cornea. 2020;39(2):263–270. doi:10.1097/ico.0000000000002150 - DOI - PubMed
    1. Rabinowitz Y. Keratoconus. Surv Ophthalmol. 1998;42(4):297–319. doi:10.1016/s0039-6257(97)00119-7 - DOI - PubMed
    1. Fan Gaskin J, Patel D, McGhee C. Acute corneal hydrops in keratoconus - new perspectives. Am J Ophthalmol. 2014;157(5):921–928. doi:10.1016/j.ajo.2014.01.017 - DOI - PubMed
    1. Gao H, Huang T, Pan Z, et al. Survey report on keratoplasty in China: a 5-year review from 2014 to 2018. PLoS One. 2020;15(10):e0239939. doi:10.1371/journal.pone.0239939 - DOI - PMC - PubMed