

doi: 10.12688/wellcomeopenres.19628.1.
eCollection 2023.
The genome sequence of the tree of heaven, Ailanthus altissima (Mill.) Swingle, 1916
Affiliations
- PMID: 37663793
- PMCID: PMC10472066
- DOI: 10.12688/wellcomeopenres.19628.1
Item in Clipboard
The genome sequence of the tree of heaven, Ailanthus altissima (Mill.) Swingle, 1916
Wellcome Open Res.
.
Abstract
We present a genome assembly from an individual Ailanthus altissima (tree of heaven; Streptophyta; Magnoliopsida; Sapindales; Simaroubaceae). The genome sequence is 939 megabases in span. Most of the assembly is scaffolded into 31 chromosomal pseudomolecules. The mitochondrial and plastid genome assemblies are 661.1 kilobases and 161.1 kilobases long, respectively.
Keywords: Ailanthus altissima; Simaroubaceae; chromosomal; genome sequence; tree of heaven.
Copyright: © 2023 Schley RJ et al.
Conflict of interest statement
No competing interests were disclosed.
Figures

a) mature tree;
b) young sapling, and
c) new leaves in Nottinghamshire (photographs © Carlton Roberts);
d)
A. altissima fruits (photograph © Nicholas
A. Tonelli).
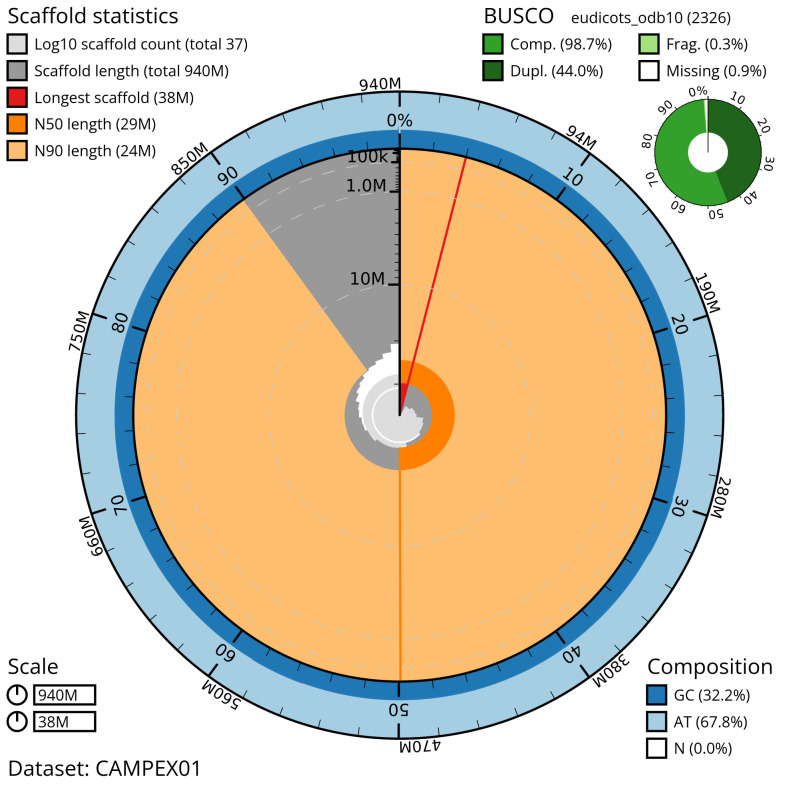
The BlobToolKit Snailplot shows N50 metrics and BUSCO gene completeness. The main plot is divided into 1,000 size-ordered bins around the circumference with each bin representing 0.1% of the 939,218,608 bp assembly. The distribution of scaffold lengths is shown in dark grey with the plot radius scaled to the longest scaffold present in the assembly (38,427,504 bp, shown in red). Orange and pale-orange arcs show the N50 and N90 scaffold lengths (29,421,908 and 24,184,688 bp, respectively). The pale grey spiral shows the cumulative scaffold count on a log scale with white scale lines showing successive orders of magnitude. The blue and pale-blue area around the outside of the plot shows the distribution of GC, AT and N percentages in the same bins as the inner plot. A summary of complete, fragmented, duplicated and missing BUSCO genes in the eudicots_odb10 set is shown in the top right. An interactive version of this figure is available at
https://blobtoolkit.genomehubs.org/view/CAMPEX01/dataset/CAMPEX01/snail .
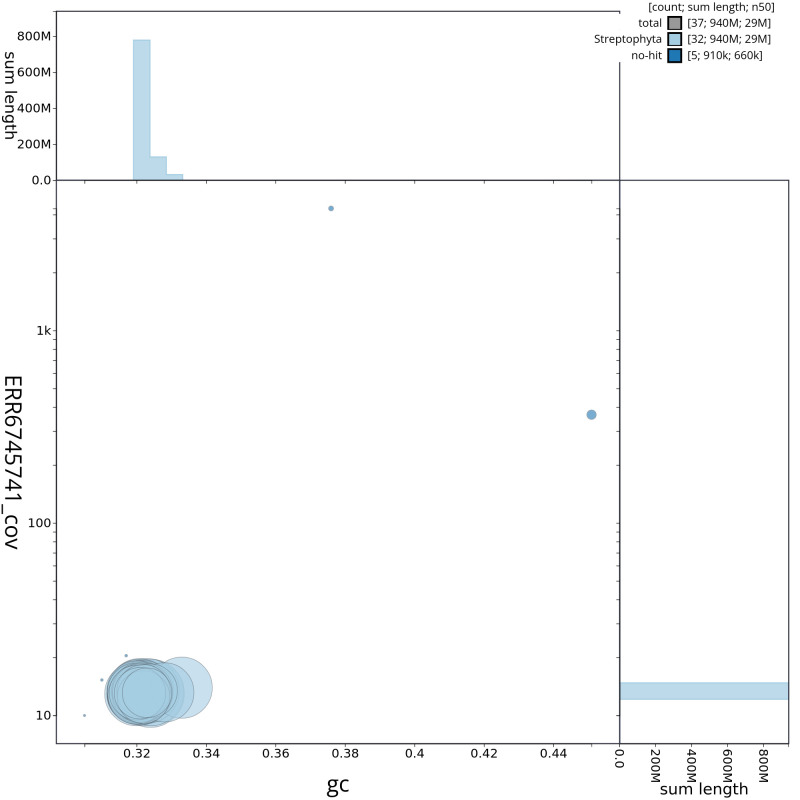
BlobToolKit GC-coverage plot. Chromosomes are coloured by phylum. Circles are sized in proportion to chromosome length. Histograms show the distribution of chromosome length sum along each axis. An interactive version of this figure is available at
https://blobtoolkit.genomehubs.org/view/CAMPEX01/dataset/CAMPEX01/blob .
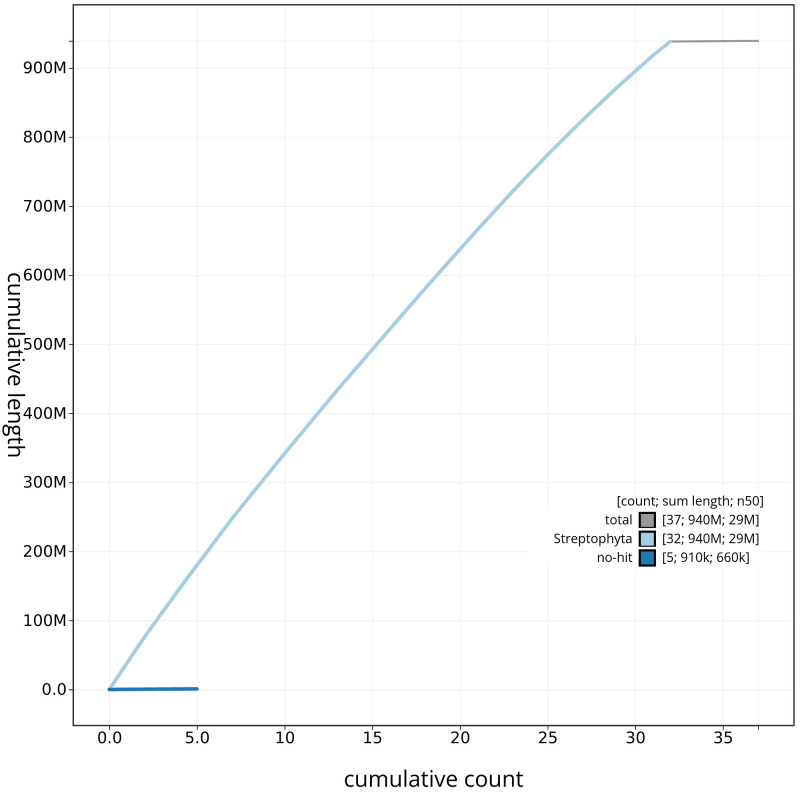
BlobToolKit cumulative sequence plot. The grey line shows cumulative length for all chromosomes. Coloured lines show cumulative lengths of chromosomes assigned to each phylum using the buscogenes taxrule. An interactive version of this figure is available at
https://blobtoolkit.genomehubs.org/view/CAMPEX01/dataset/CAMPEX01/cumulative .
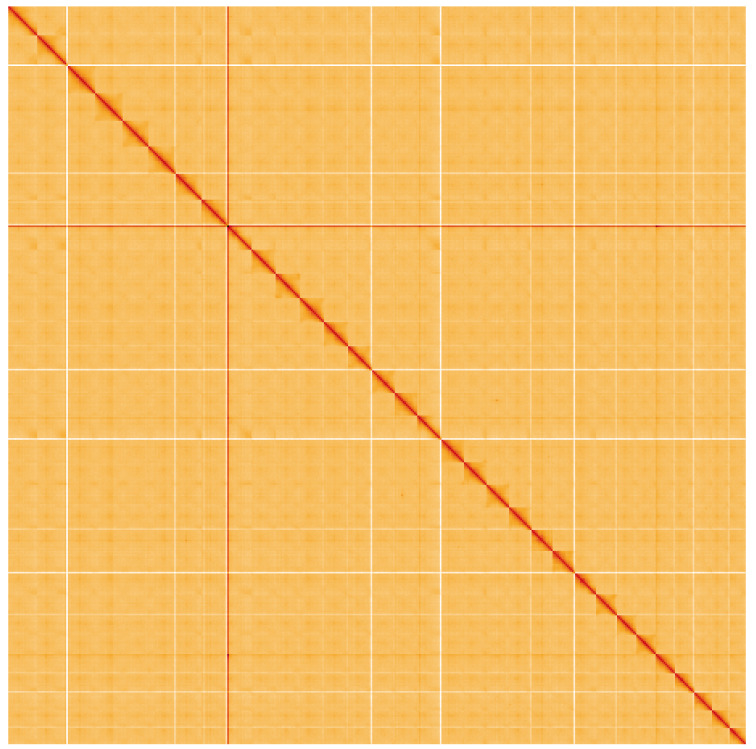
Hi-C contact map of the drAilAlti1.1 assembly, visualised using HiGlass. Chromosomes are given in order of size from left to right and top to bottom. An interactive version of this figure is available at
https://genome-note-higlass.tol.sanger.ac.uk/l/?d=XyRKDNDOTHy19SzkZkKRWw .
References
-
- Dallas JF, Leitch M, Hulme PE: Microsatellites for tree of heaven ( Ailanthus altissima). Mol Ecol Notes. 2005;5(2):340–342. 10.1111/j.1471-8286.2005.00920.x - DOI
LinkOut - more resources
Full Text Sources
