

An integrated analysis of dysregulated SCD1 in human cancers and functional verification of miR-181a-5p/SCD1 axis in esophageal squamous cell carcinoma
- PMID: 37664175
- PMCID: PMC10468324
- DOI: 10.1016/j.csbj.2023.08.009
An integrated analysis of dysregulated SCD1 in human cancers and functional verification of miR-181a-5p/SCD1 axis in esophageal squamous cell carcinoma
Abstract
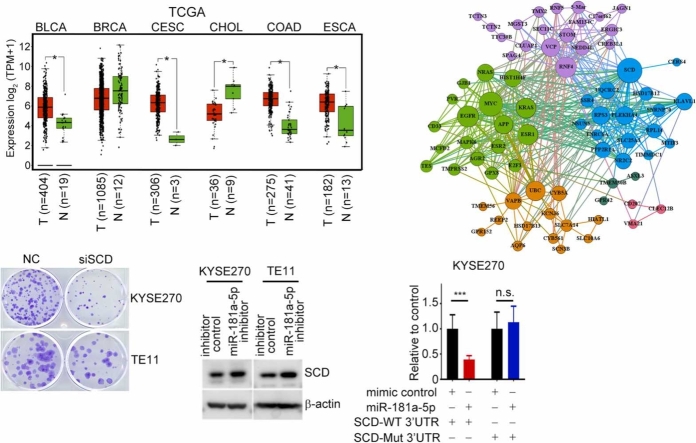
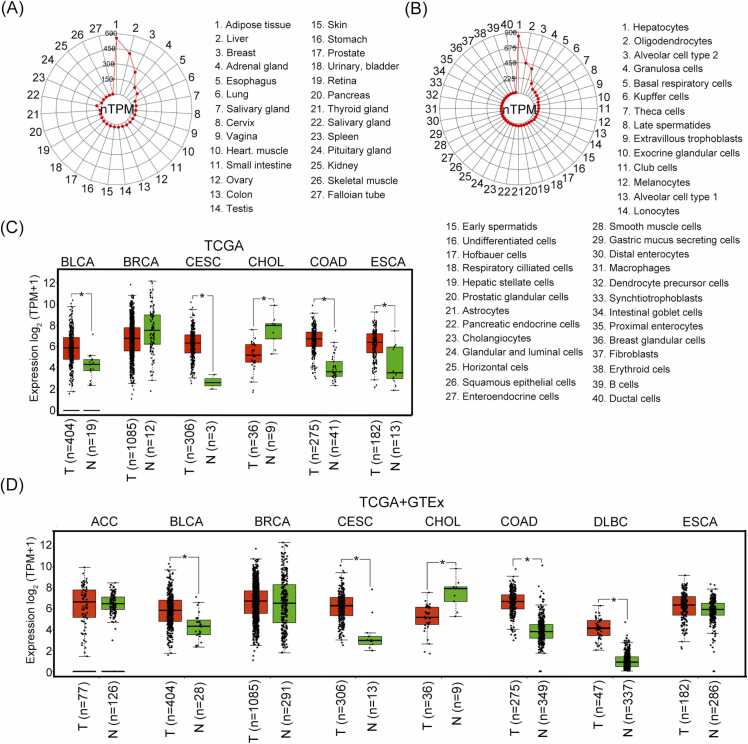
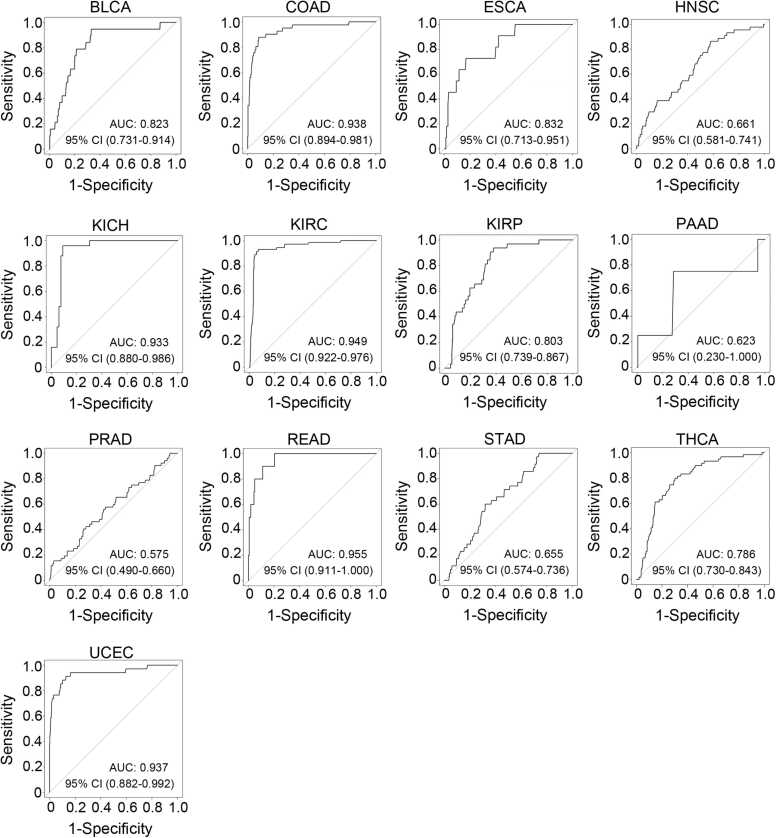
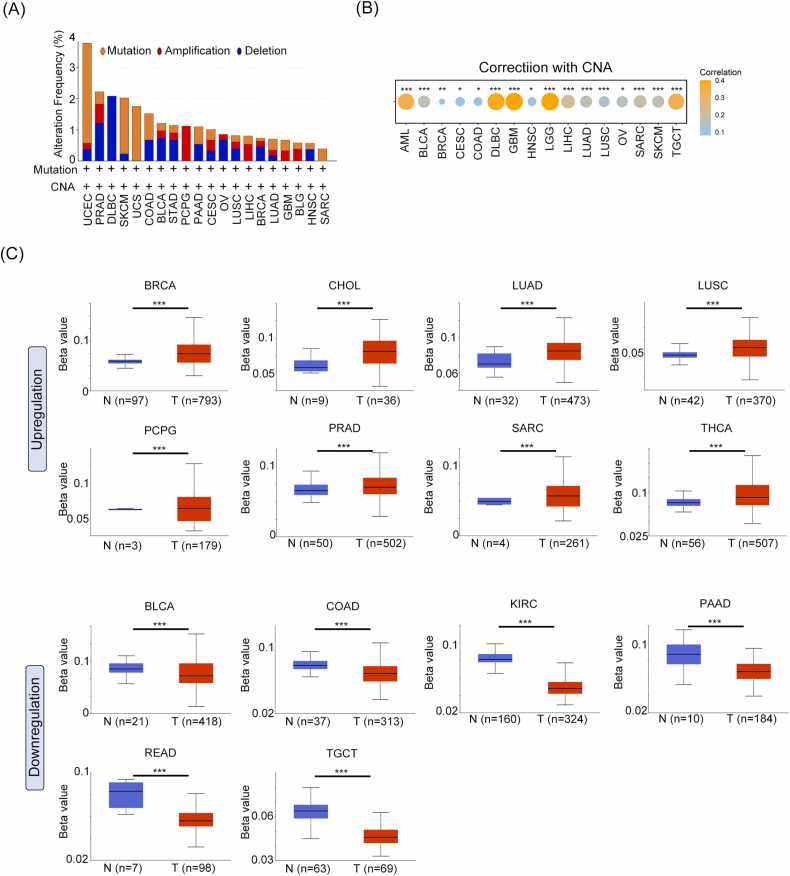
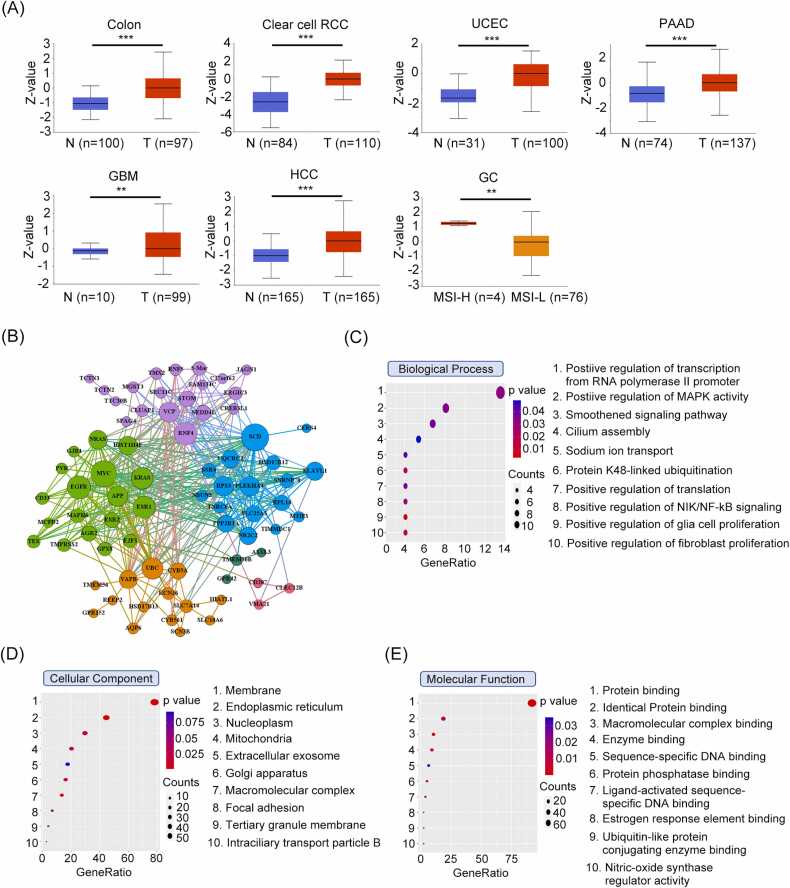
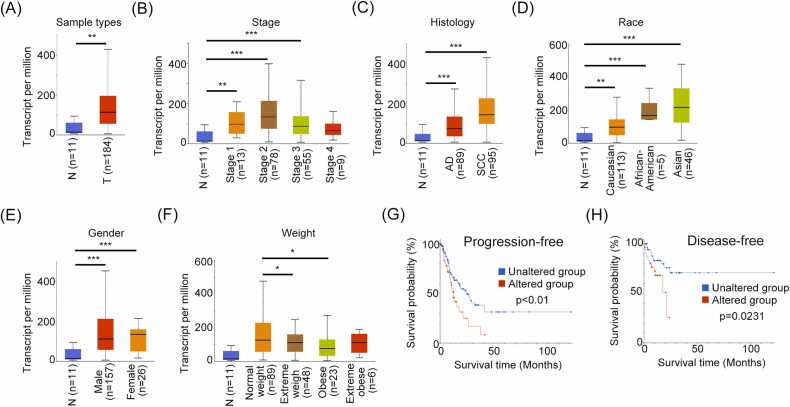
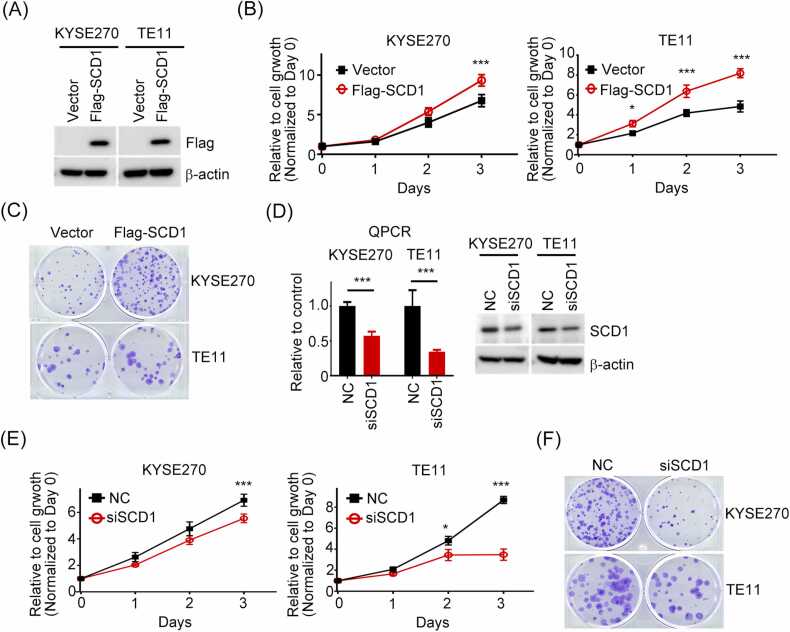
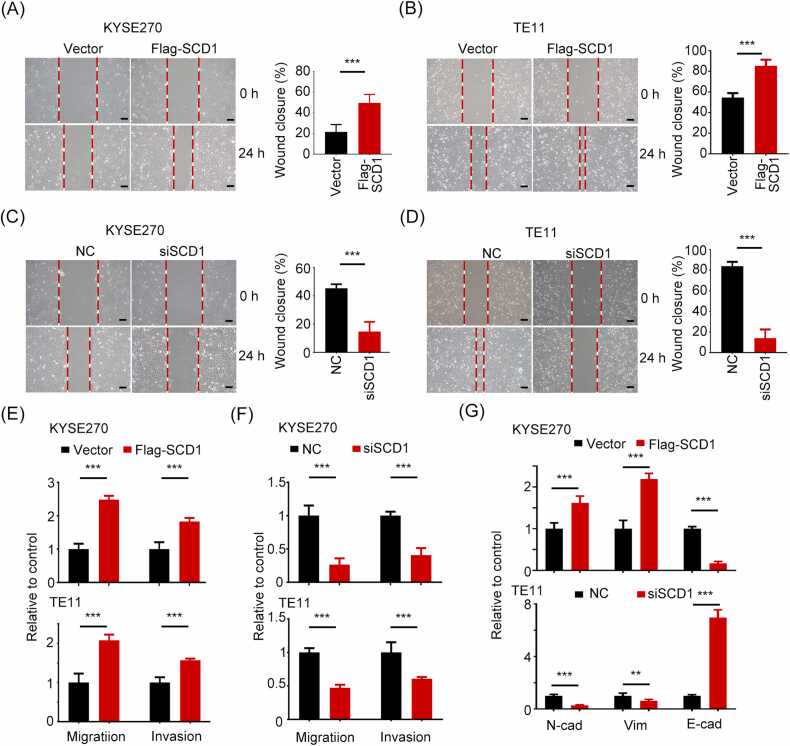
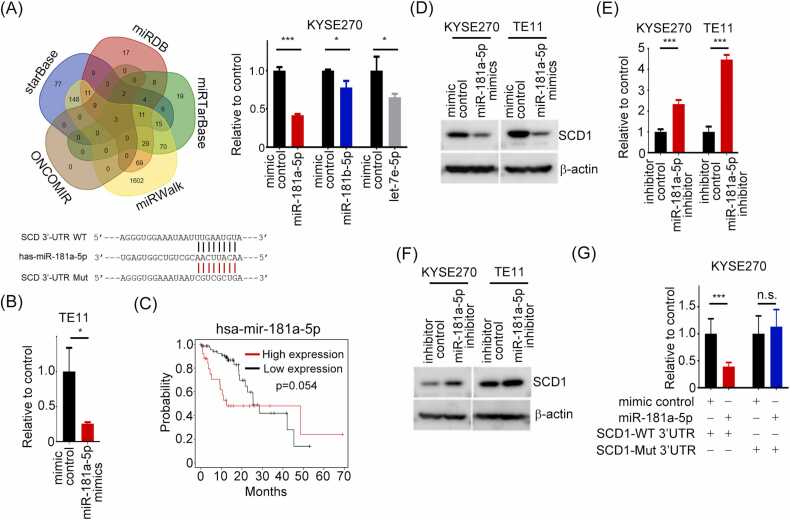
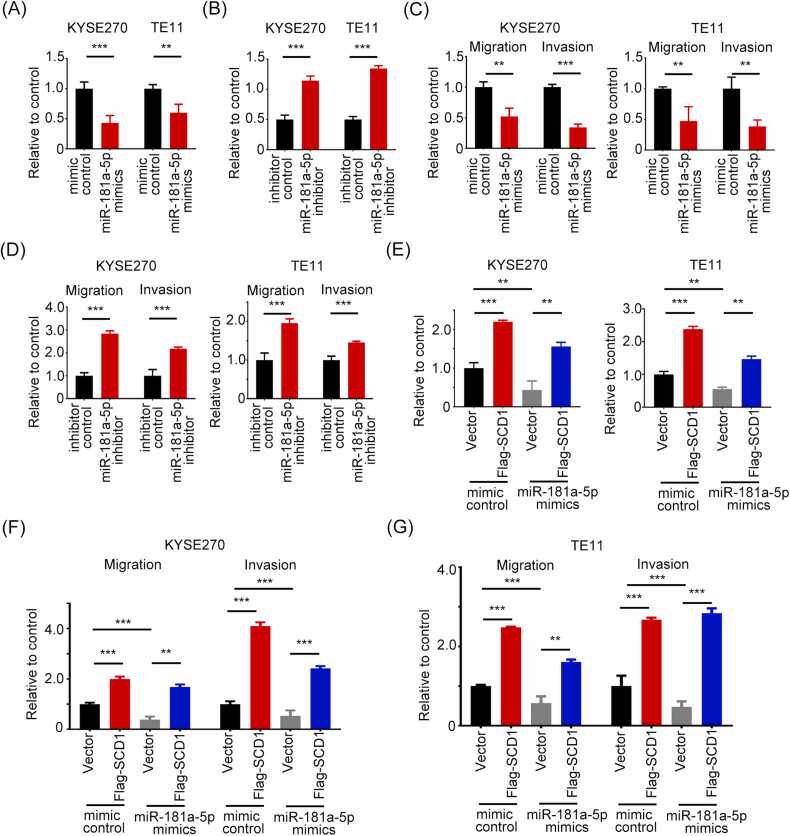
Esophageal squamous cell carcinoma (ESCC), one of the most lethal cancers, has become a global health issue. Stearoyl-coA desaturase 1 (SCD1) has been demonstrated to play a crucial role in human cancers. However, pan-cancer analysis has revealed little evidence to date. In the current study, we systematically inspected the expression patterns and potential clinical outcomes of SCD1 in multiple human cancers. SCD1 was dysregulated in several types of cancers, and its aberrant expression acted as a diagnostic biomarker, indicating that SCD1 may play a role in tumorigenesis. We used ESCC as an example to demonstrate that SCD1 was dramatically upregulated in tumor tissues of ESCC and was associated with clinicopathological characteristics in ESCC patients. Furthermore, Kaplan-Meier analysis showed that high SCD1 expression was correlated with poor progression-free survival (PFS) and disease-free survival (DFS) in ESCC patients. The protein-protein interaction (PPI) network and module analysis by PINA database and Gephi were performed to identify the hub targets. Meanwhile, the functional annotation analysis of these hubs was constructed by Gene Ontology (GO) and Kyoto Encyclopedia of Genes and Genomes (KEGG) pathway enrichment analyses. Functionally, the gain-of-function of SCD1 in ESCC cells promoted cell proliferation, migration, and invasion; in contrast, loss-of-function of SCD1 in ESCC cells had opposite effects. Bioinformatic, QPCR, Western blotting and luciferase assays indicated that SCD1 was a direct target of miR-181a-5p in ESCC cells. In addition, gain-of-function of miR-181a-5p in ESCC cells reduced the cell growth, migratory, and invasive abilities. Conversely, inhibition of miR-181a-5p expression by its inhibitor in ESCC cells had opposite biological effects. Importantly, reinforced SCD1 in miR-181a-5p mimic ESCC transfectants reversed miR-181a-5p mimic-prevented malignant phenotypes of ESCC cells. Taken together, these results indicate that SCD1 expression influences tumor progression in a variety of cancers, and the miR-181a-5p/SCD1 axis may be a potential therapeutic target for ESCC treatment.
Keywords: ESCC; MiR-181a-5p; Stearoyl-CoA desaturase.
© 2023 The Authors.
Conflict of interest statement
The authors declare that they have no known competing financial interests or personal relationships that could have appeared to influence the work reported in this paper.
Figures
Similar articles
-
MicroRNA-181a-5p prevents the progression of esophageal squamous cell carcinoma in vivo and in vitro via the MEK1-mediated ERK-MMP signaling pathway.Aging (Albany NY). 2022 Apr 25;14(8):3540-3553. doi: 10.18632/aging.204028. Epub 2022 Apr 25. Aging (Albany NY). 2022. PMID: 35468097 Free PMC article.
-
[Effects of microRNA-182-5p on cell proliferation and invasion of esophageal squamous cell carcinoma and related molecular mechanisms].Zhonghua Zhong Liu Za Zhi. 2020 Aug 23;42(8):635-643. doi: 10.3760/cma.j.cn112152-20200310-00191. Zhonghua Zhong Liu Za Zhi. 2020. PMID: 32867454 Chinese.
-
Long non-coding RNA LINC00680 functions as a ceRNA to promote esophageal squamous cell carcinoma progression through the miR-423-5p/PAK6 axis.Mol Cancer. 2022 Mar 7;21(1):69. doi: 10.1186/s12943-022-01539-3. Mol Cancer. 2022. PMID: 35255921 Free PMC article.
-
Common gene signatures and key pathways in hypopharyngeal and esophageal squamous cell carcinoma: Evidence from bioinformatic analysis.Medicine (Baltimore). 2020 Oct 16;99(42):e22434. doi: 10.1097/MD.0000000000022434. Medicine (Baltimore). 2020. PMID: 33080677 Free PMC article.
-
MicroRNA-24 in Cancer: A Double Side Medal With Opposite Properties.Front Oncol. 2020 Oct 2;10:553714. doi: 10.3389/fonc.2020.553714. eCollection 2020. Front Oncol. 2020. PMID: 33123467 Free PMC article. Review.
Cited by
-
HPV-Associated Gene Signatures in Bladder Cancer: A Comprehensive Prognostic Model and its Implications in Immunotherapy.Int J Med Sci. 2025 Jan 1;22(1):140-157. doi: 10.7150/ijms.98334. eCollection 2025. Int J Med Sci. 2025. PMID: 39744172 Free PMC article.
-
Ferroptosis: A critical link to treatment resistance in esophageal carcinoma.iScience. 2025 Jun 14;28(7):112901. doi: 10.1016/j.isci.2025.112901. eCollection 2025 Jul 18. iScience. 2025. PMID: 40687837 Free PMC article. Review.
References
LinkOut - more resources
Full Text Sources