. 2023 Aug 17:16:1225847.
doi: 10.3389/fnmol.2023.1225847. eCollection 2023.

Combining RNAscope and immunohistochemistry to visualize inflammatory gene products in neurons and microglia

Affiliations

Combining RNAscope and immunohistochemistry to visualize inflammatory gene products in neurons and microglia

Jayson B Ball et al. Front Mol Neurosci. .

Abstract

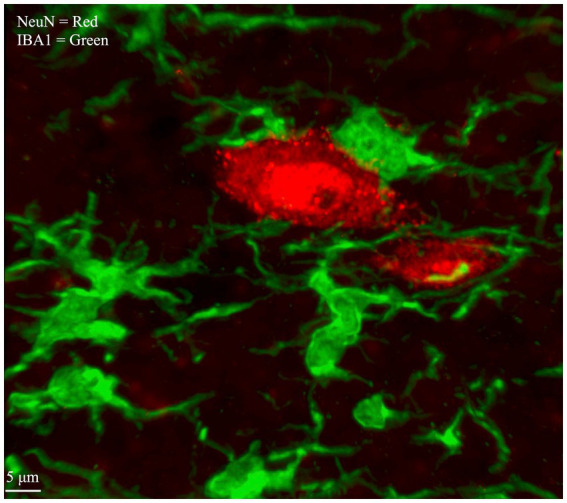
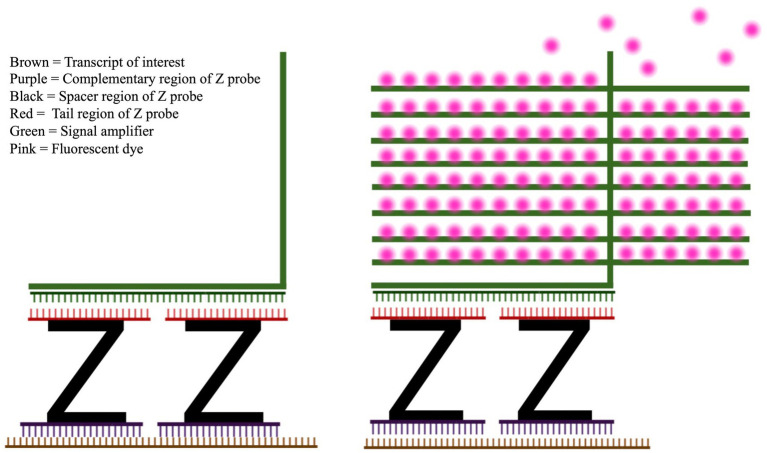
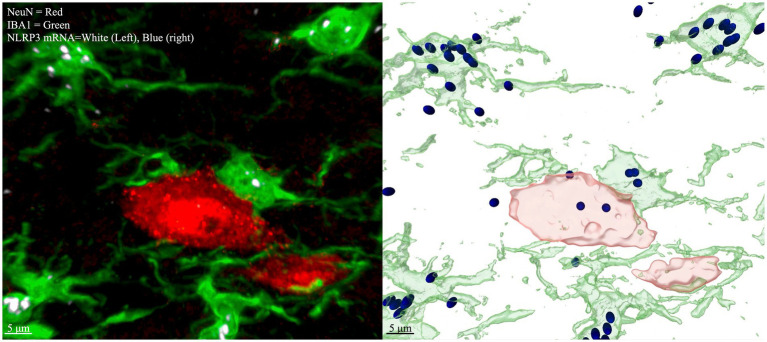
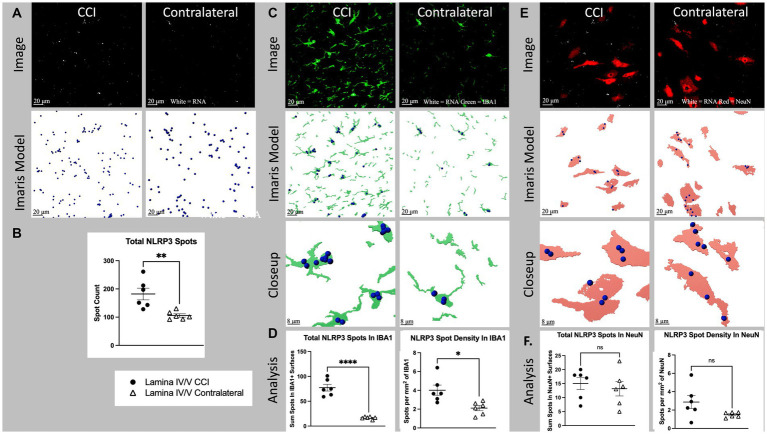
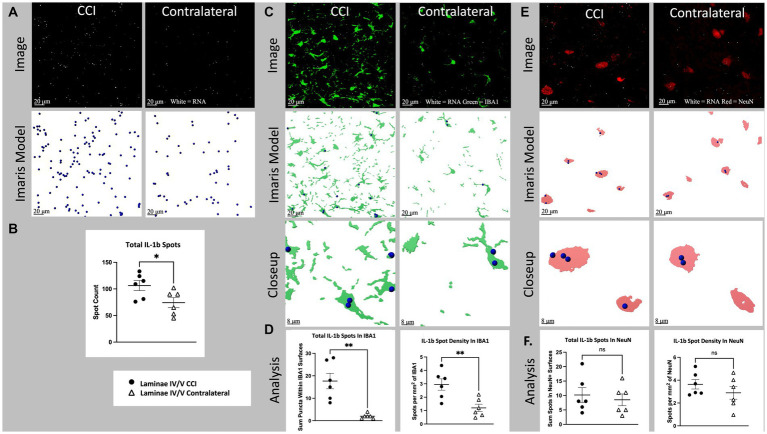
A challenge for central nervous system (CNS) tissue analysis in neuroscience research has been the difficulty to codetect and colocalize gene and protein expression in the same tissue. Given the importance of identifying gene expression relative to proteins of interest, for example, cell-type specific markers, we aimed to develop a protocol to optimize their codetection. RNAscope fluorescent in situ hybridization (FISH) combined with immunohistochemistry (IHC) in fixed (CNS) tissue sections allows for reliable quantification of gene transcripts of interest within IHC-labeled cells. This paper describes a new method for simultaneous visualization of FISH and IHC in thicker (14-μm), fixed tissue samples, using spinal cord sections. This method's effectiveness is shown by the cell-type-specific quantification of two genes, namely the proinflammatory cytokine interleukin-1beta (IL-1b) and the inflammasome NLR family pyrin domain containing 3 (NLRP3). These genes are challenging to measure accurately using immunohistochemistry (IHC) due to the nonspecificity of available antibodies and the hard-to-distinguish, dot-like visualizations of the labeled proteins within the tissue. These measurements were carried out in spinal cord sections after unilateral chronic constriction injury of the sciatic nerve to induce neuroinflammation in the spinal cord. RNAscope is used to label transcripts of genes of interest and IHC is used to label cell-type specific antigens (IBA1 for microglia, NeuN for neurons). This combination allowed for labeled RNA transcripts to be quantified within cell-type specific boundaries using confocal microscopy and standard image analysis methods. This method makes it easy to answer empirical questions that are intractable with standard IHC or in situ hybridization alone. The method, which has been optimized for spinal cord tissue and to minimize tissue preparation time and costs, is described in detail from tissue collection to image analysis. Further, the relative expression changes in inflammatory genes NLRP3 and IL-1b in spinal cord microglia vs. neurons of somatotopically relevant laminae are described for the first time.

Keywords: Imaris; NLRP3; co-localization; hybridization; interleukin-1beta; neuroinflammation; rat; spinal cord.


Conflict of interest statement

The authors declare that the research was conducted in the absence of any commercial or financial relationships that could be construed as a potential conflict of interest.

Figures

Figure 1
Figure 1
Microglia and Neurons within spinal cord gray matter labeled by multiplex IHC. Neuronal cell bodies, labeled with an antibody that targets NeuN, are visualized with a secondary antibody conjugated to a red fluorophore (Alexa Fluor 568). Microglia, labeled with an antibody that targets ionized calcium binding adaptor molecules (IBA1), are visualized with a secondary antibody conjugated to a green fluorophore (Alexa Fluor 488). Image is taken from laminae IV/V of lumbar enlargement section L3/4, ipsilateral to CCI.
Figure 2
Figure 2
RNAscope Z probe and fluorescence amplifier system. Left: The high specificity and sensitivity of RNA scope is achieved by the design of the Z probes (black) and signal amplifier (green). The lower section of the Z probe (purple) hybridizes with the RNA target of interest (brown). Once two distinct Z probes have hybridized to adjacent sections of the RNA, the amplifier sequence (green) can hybridize across Z probes. Right: After the amplification structure is assembled on top of the Z probe, fluorescent dye (pink) is attached to the amplifier.
Figure 3
Figure 3
Multichannel IHC with labeled NLRP3 mRNA (left), Imaris modeling (right). Red = NeuN (neurons), Green = IBA1 (microglia), White (left) and Blue (right) = NRLP3 mRNA. Image is taken from laminae IV/V lumbar enlargement ipsilateral to CCI. Spots are rendered by Imaris if the fluorescence signal meet an intensity threshold over background, so dim spots that are at a similar level of fluorescence intensity to nondescript tissue background will not be counted as spots or seen on the rendered image (right). The same intensity threshold for puncta applied to all images in the dataset.
Figure 4
Figure 4
Cell specific NLRP3 RNA expression in lamina IV/V lumbar (L3-6) dorsal horn ipsilateral to CCI vs. contralateral control. (A) Total NLRP3 spots (white) CCI vs. contralateral. Top images show a full, single field of view confocal image taken from the medial aspect of lamina IV/V (see Supplementary Figure S1 for region sampled). Bottom images show Imaris spot modeling (size of spots increased 4× for visualization). Total spots represent all labeled fluorescent puncta in a single field of view which meet brightness (intensity) threshold for inclusion in the RNA count. (B) Total NLRP3 spots for all animals CCI vs. Contralateral (p = 0.0053). (C) NLRP3 (white) colocalized with IBA1 (green), CCI vs. contralateral. Top images are the same as Figure 5A, but with green IBA1 channel also shown. Middle images show Imaris models of IBA1+ surfaces colocalized NLRP3 spots. Bottom images show a closeup of Imaris models. (D) Light shows total spots within IBA1+ surfaces in a single field of view (p < 0001). Right shows density of NLRP3 spots within IBA1+ surfaces (p = 0.0110). (E) NLRP3 (white) and NeuN (red), CCI vs. contralateral. Top images are the same as Figure 5A, but with red NLRP3 channel also shown. Middle images show Imaris models of NeuN+ surfaces and colocalized NLRP3 spots. Bottom images show a closeup of Imaris models. (F) Left shows total spots within NeuN+ surfaces in a single field of view (p = 0.5952). Right shows density of NLRP3 spots within NeuN+ surfaces (p = 0.0847). Graphs show individual datapoints (N = 6) and SEM. Each datapoint on subfigures (B,D,F) represents a single image from laminae IV/V of a single tissue section taken randomly from lumbar enlargement (L4-6) from an individual rat.
Figure 5
Figure 5
Cell specific IL-1b RNA expression in lamina IV/V lumbar (L3-6) dorsal horn ipsilateral to CCI vs. contralateral control. (A) Total IL-1b spots (white), CCI vs. contralateral. Top images show a full, single field of view confocal image taken from the medial aspect of lamina IV/V (see Supplementary Figure S1 for region sampled). Bottom images show Imaris spot modeling (size of spots increased 4× for visualization). Total spots represent all labeled fluorescent puncta in a single field of view which meet brightness (intensity) threshold for inclusion in the RNA count. (B) Total IL-1b spots for all animals CCI vs. contralateral (p = 0.0364). (C) IL-1b (white) and IBA1(green) CCI vs. contralateral. Top images are the same as Figure 6A, but with green IBA1 channel also shown. Middle images show Imaris models of IBA1+ surfaces and colocalized Il-1b spots. Bottom images show a closeup of Imaris models. (D) Left shows total spots within IBA1+ surfaces in a single field of view (p = 0.0011). Right shows density of IL-1b spots within IBA1+ surfaces (p = 0.0065). (E) il-1b (white) and NeuN (red), CCI vs. contralateral. Top images are the same as (A). but with red NLRP3 channel also shown. Middle images show Imaris models of NeuN+ surfaces and colocalized IL-1b spots. Bottom images show a closeup of Imaris models. (F) Left shows total spots within NeuN+ surfaces in a single field of view (p = 0.6211). Right shows density of IL-1b spots within NeuN+ Surfaces (p = 0.3094). Graphs show individual datapoints (N = 6) and SEM. Each datapoint on subfigures (B,D,F) represents a single image from laminae IV/V of a single tissue section taken randomly from lumbar enlargement (L3-6) from an individual rat.
Figure 6
Figure 6
Differential interference contrast images comparing tissue integrity of two spinal cord sections which have been processed for RNAscope + IHC either by the default recommendations included in the RNAscope multiplex kit (A,B) or the methods described in this paper (C,D). (A) An 8 μm thick unfixed spinal cord section from an early attempt at combining RNAscope + IHC in spinal cord. (B) Zoom of inset shows damage to gray matter. Notice the torn gaps in the tissue. (C) A 14 μm thick fixed spinal cord section with intact gray matter, processed as described in this methods paper. (D) Zoom of inset shows improved tissue integrity after fixation and thicker sectioning. The unfixed gray matter is prone to tearing after fresh flash freezing and cryostat sectioning. Due to extensive tearing in the unfixed tissue, the spatial boundary where gray matter turns to white matter is ragged and undefined but remains crisp and clear for image analysis in the thicker, fixed tissue (Yellow arrows). Scale Bar = 200 μm (A,C) or 60 μm (B,D). These images are of sections from a pilot experiment comparing fixed vs. non-fixed tissues and not included in the analyses reported in this manuscript.

References

    1. ACDbio (2023). User Manual: RNAscope Multiplex Fluorescent Reagent Kit v2 with sample preparation and pretreatment. Available at: https://acdbio.com/sites/default/files/UM%20323100%20Multiplex%20Fluores... (Accessed March 1, 2023).
    1. Allan S. M., Tyrrell P. J., Rothwell N. J. (2005). Interleukin-1 and neuronal injury. Nat. Rev. Immunol. 5, 629–640. doi: 10.1038/nri1664 - DOI - PubMed
    1. Atout S., Shurrab S., Loveridge C. (2022). Evaluation of the suitability of RNAscope as a technique to measure gene expression in clinical diagnostics: a systematic review. Mol. Diagn. Ther. 26, 19–37. doi: 10.1007/s40291-021-00570-2, PMID: - DOI - PMC - PubMed
    1. Bennett G. J., Xie Y.-K. (1988). A peripheral mononeuropathy in rat that produces disorders of pain sensation like those seen in man. Pain 33, 87–107. doi: 10.1016/0304-3959(88)90209-6, PMID: - DOI - PubMed
    1. Bingham V., McIlreavey L., Greene C., O’Doherty E., Clarke R., Craig S., et al. . (2017). RNAscope in situ hybridization confirms mRNA integrity in formalin-fixed, paraffin-embedded cancer tissue samples. Oncotarget 8, 93392–93403. doi: 10.18632/oncotarget.21851 - DOI - PMC - PubMed

LinkOut - more resources