. 2023 Aug 9;26(9):107596.
doi: 10.1016/j.isci.2023.107596. eCollection 2023 Sep 15.

Hematopoietic stem and progenitor cells confer cross-protective trained immunity in mouse models

Affiliations

Hematopoietic stem and progenitor cells confer cross-protective trained immunity in mouse models

Bailee N Kain et al. iScience. .

Erratum in

Abstract

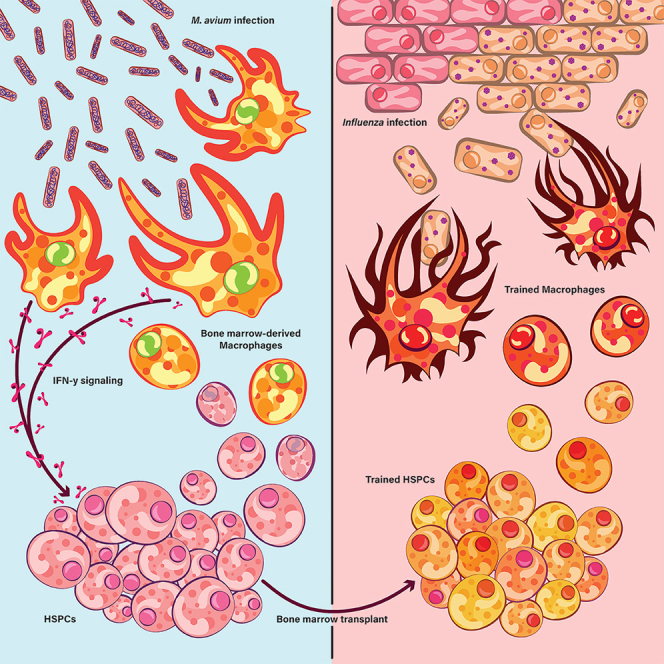
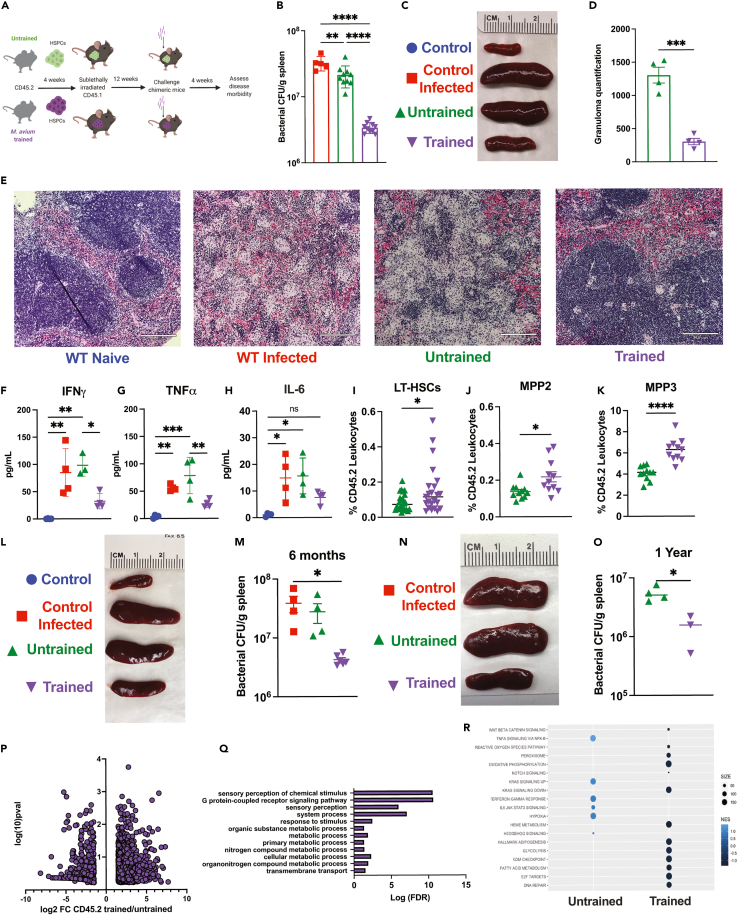
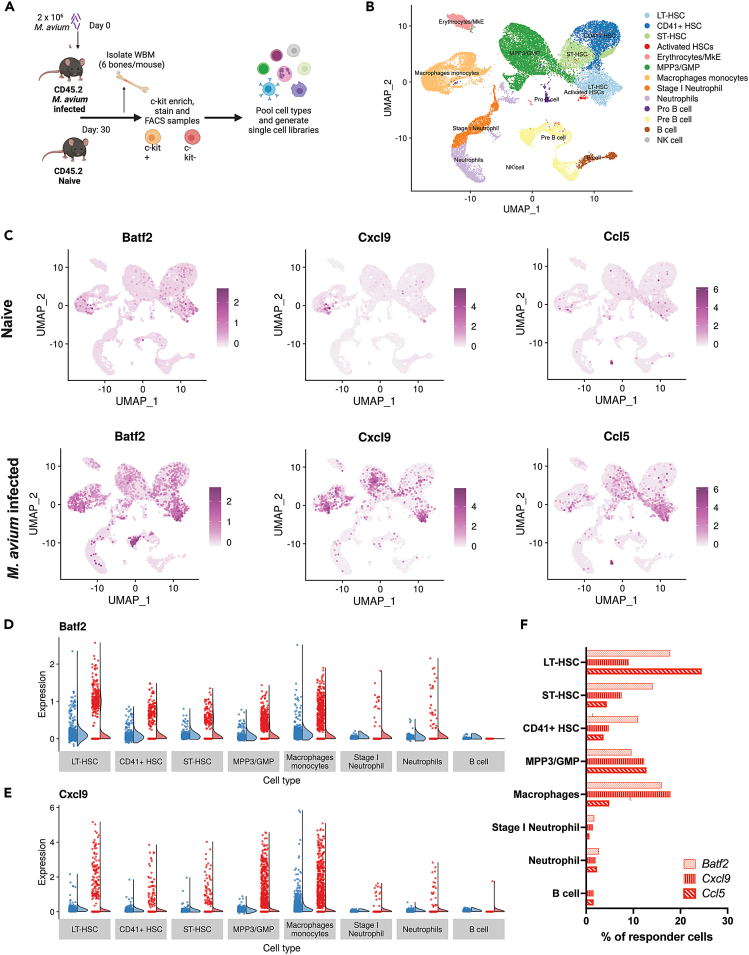
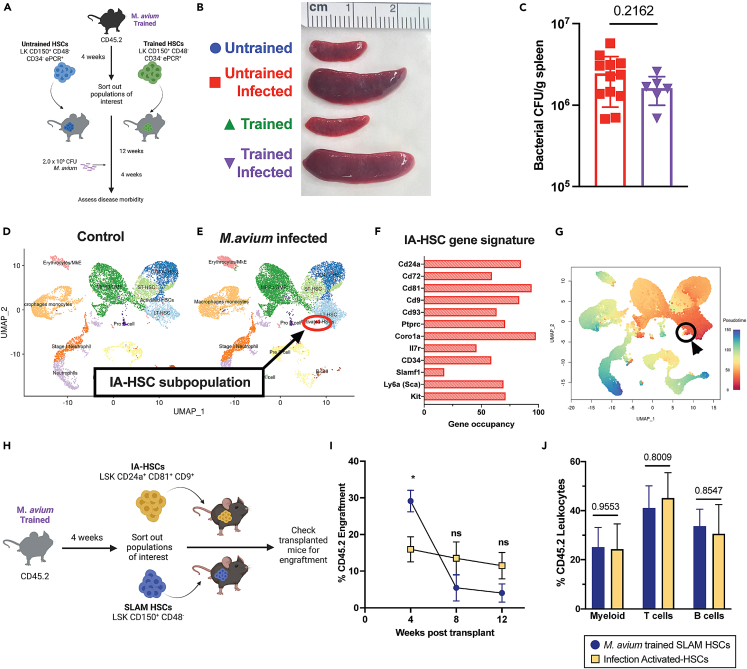
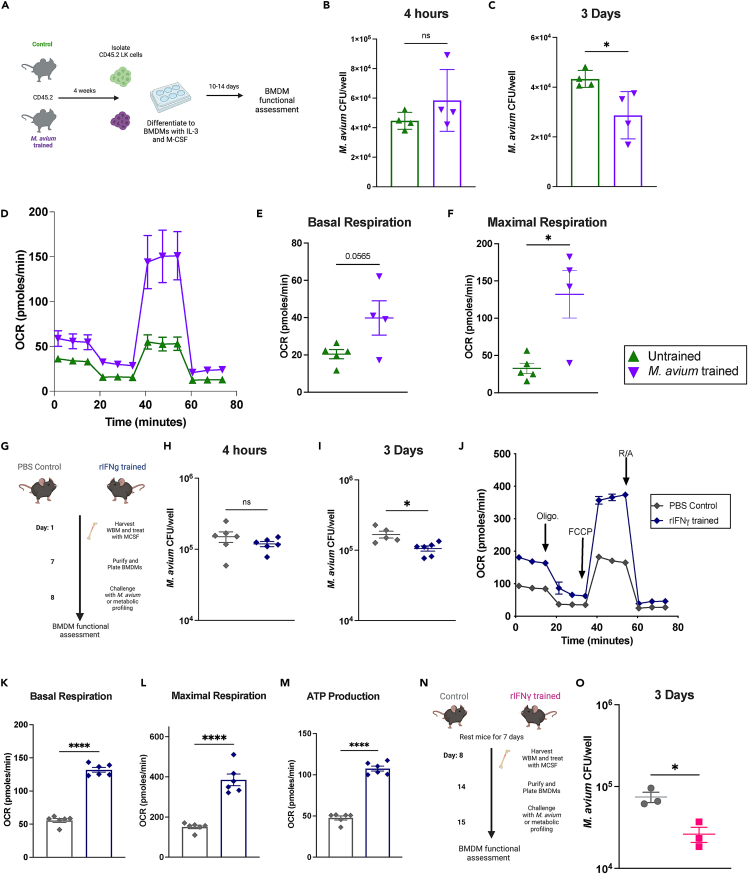
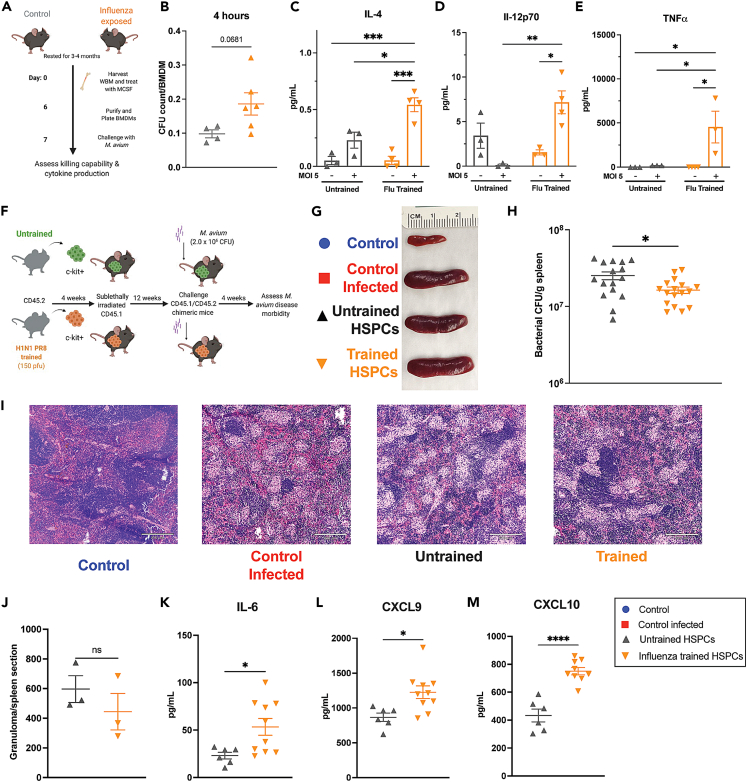
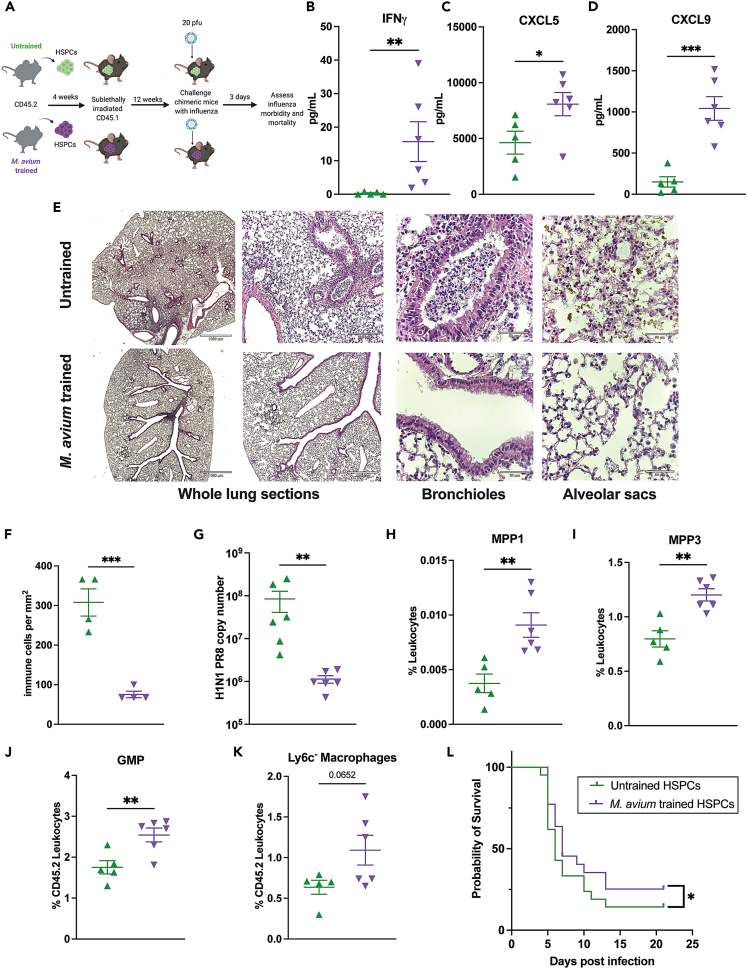
Recent studies suggest that infection reprograms hematopoietic stem and progenitor cells (HSPCs) to enhance innate immune responses upon secondary infectious challenge, a process called "trained immunity." However, the specificity and cell types responsible for this response remain poorly defined. We established a model of trained immunity in mice in response to Mycobacterium avium infection. scRNA-seq analysis revealed that HSPCs activate interferon gamma-response genes heterogeneously upon primary challenge, while rare cell populations expand. Macrophages derived from trained HSPCs demonstrated enhanced bacterial killing and metabolism, and a single dose of recombinant interferon gamma exposure was sufficient to induce similar training. Mice transplanted with influenza-trained HSPCs displayed enhanced immunity against M. avium challenge and vice versa, demonstrating cross protection against antigenically distinct pathogens. Together, these results indicate that heterogeneous responses to infection by HSPCs can lead to long-term production of bone marrow derived macrophages with enhanced function and confer cross-protection against alternative pathogens.

Keywords: Cell biology; Immunology; Microbiology; Stem cells research; Transcriptomics.


Conflict of interest statement

The authors declare no competing interests.

Figures

None
Graphical abstract
Figure 1
Figure 1
Transplant of M. avium-exposed HSPCs confers immunity to recipient mice following M. avium challenge (A) Chimeric mouse model of M. avium trained immunity experiments. (B) Splenic bacterial load in experimental mice one month post M. avium challenge. Results representative of 3 independent experiments, n = 5–9 per experimental group. (C) Representative image of spleens one-month post-challenge. (D) Quantification of splenic granulomas per stitched 10x image of longitudinal spleen section. Results representative of 2 independent experiments, n = 3–5 per group. (E) Splenic histology one month post M. avium infection. 10x magnification, Images representative of 3 independent experiments, scale bar 210μm. (F–H) Serum cytokine levels of transplant recipients one month post M. avium challenge. (I–K) Whole bone flow cytometry of transplant, challenged experiments. (I) Percentage of CD45.2 LT-HSCs (Lin,ckit+,CD150+,CD48-,Flk2-,CD34-), (J) CD45.2 MPP2 (Lin,ckit+, CD150+,CD48+,Flk2-,CD34+), and (K) CD45.2 MPP3 (Lin, ckit+, CD150-,CD48+,Flk2-,CD34+) in transplanted recipients post M. avium challenge. (L) Representative image of spleens harvested from naive and challenged experimental mice rested for six months post-transplant. (M) Splenic bacterial load in experimental mice one month post M. avium challenge in trained M. avium HSPC recipients that had been rested for six months post-transplant. n = 4–6 per experimental group. (N) Representative image of spleens harvested from challenged experimental mice rested for 1 year post-transplant. (O) Splenic bacterial load in experimental M. avium trained or untrained mice recipients that had been rested for 1 year post-transplant. n = 3–4 per experimental group. (P) Volcano plot representation of differentially expressed genes of CD45.2 untrained vs. trained HSPCs (LK CD150+, CD48) recovered from transplanted recipients 1 month following M. avium infection. (Q) Gene ontology analysis of genes upregulated in challenged M. avium trained HSPCs, showing an enrichment of metabolism related pathways. (R) Gene Set Enrichment Analysis (GSEA) results for Hallmark pathways comparing gene expression in untrained and trained HSPCs. For comparisons of two groups, statistics were calculated using Student’s t test. For comparisons of more than two groups, one-way ANOVA with Tukey’s multiple comparisons was completed. ∗p < 0.05, ∗∗p < 0.01 ∗∗∗p < 0.001 ∗∗∗∗p < 0.0001. Analysis, cutoff for bulk RNA-seq analysis was FDR <0.1 for a log-fold change of < -1.5 or >1.5.
Figure 2
Figure 2
M. avium exposure induces heterogeneous responses within HSPCs (A) Experimental schematic of single cell RNAseq library generation from control or M. avium exposed bone marrow one month post infection. Cells were isolated by FACS sorting and pooled for sequencing using the 10x genomics platform. (B) UMAP plot representing cell populations as identified by characteristic gene expression using scCATCH and curated gene lists. (C) UMAP plots of gene expression in naive or M. avium infected samples. Relative gene expression is represented by corresponding color scale. (D and E) Raincloud diagrams showing “non-responder” vs. “responder” single cell gene expression. (D) Batf2 expression by cell type (E) Cxcl9 expression by cell type. (F) Percentages of cells expressing IFNγ response genes Batf2, Cxcl9, and Ccl5 by cell type.
Figure 3
Figure 3
HSCs alone do not confer immune protection, but M. avium infection results in the emergence of a subpopulation of infection-activated HSCs (IA-HSCs) (A) Mosaic model of M. avium trained LT-HSC transplant. (B) Representative images showing splenomegaly in untrained and M. avium trained HSC recipients post M. avium challenge. Data are representative of two independent experiments with n = 6–12. (C) Splenic bacterial load in untrained and M. avium trained HSC transplant recipients post M. avium challenge. n = 6–12, Statistics: Unpaired t-test. (D) UMAP plots of scRNAseq data from BM cells of naive versus M. avium-infected mice. (E) Top gene occupancy of genes expressed by emerging infection activated HSCs (IA-HSCs). (F) UMAP representation of pseudotime analysis of combined naive and M. avium infected scRNA-seq datasets. Primitive cells with stem like properties are represented in red, while terminally differentiated immune cells are represented in blue. IA-HSCs circled in black. (G) Mosaic mouse model of IA-HSC transplant recipients and experimental schematic. (H) Engraftment percentage of CD45.2 donor cells at specific time points twelve weeks post-transplant. n = 6–10 biological replicates per group, statistics: One-way ANOVA with Tukey’s multiple comparisons. (I) Lineage distribution of trained SLAM HSC and IA-HSC recipients. n = 6–10 biological replicates per group, statistics: One-way ANOVA with Tukey’s multiple comparisons. ∗p < 0.05, ∗∗p < 0.01 ∗∗∗p < 0.001 ∗∗∗∗p < 0.0001.
Figure 4
Figure 4
M. avium trained HSPCS differentiate into macrophages that exhibit increased bacterial killing and metabolism (A) Experimental scheme for generation of bone marrow derived macrophages (BMDM) from HSPCs (LK). (B) M. avium bacterial CFU counts in BMDMs 4 h post M. avium challenge. (C) M. avium bacterial CFU counts in BMDMs 3 days post M. avium challenge. n = 4 per group. (D–F) Seahorse Mito Stress test of naive vs. M. avium trained BMDMs. n = 4–5 per group, data are representative of 2 independent experiments. (D) Metabolic trace of naive and M. avium trained BMDMs at baseline. (E) Basal respiration of naive vs. M. avium-trained BMDMs. (F) Maximal respiration of naive vs. M. avium trained BMDMs. (G) Experimental scheme of rIFNγ training and BMDM generation from whole bone marrow (WBM). Mice were treated with rIFNγ 24 h prior to harvest of WBM for culture. (H) M. avium bacterial CFU counts in BMDMs 4 h post challenge. (I) M. avium bacterial CFU counts in BMDMs 3 days post challenge. n = 6; data are representative of three independent experiments. (J–M) Seahorse Mito Stress test of naive vs. rIFNγ trained BMDMs. n = 6; data are representative of two independent experiments. (J) Metabolic trace of naive and rIFNγ-trained BMDMs at baseline. (K) Basal respiration of naive vs. rIFNγ-trained BMDMs. (L) Maximal respiration of naive vs. rIFNγ-trained BMDMs. (M) ATP production of naive vs. rIFNγ-trained BMDMs. (N) Experimental scheme: Mice were trained for 24 h with rIFNγ and rested for seven days prior to harvest of WBM for BMDM culture. (O) M. avium bacterial CFU counts in BMDMs 3 days post challenge. n = 3 per group; data are representative of two independent experiments. Statistics were calculated using Student’s t test for two groups or one-way ANOVA with Tukey’s multiple comparisons. ∗p < 0.05, ∗∗p < 0.01 ∗∗∗p < 0.001 ∗∗∗∗p < 0.0001.
Figure 5
Figure 5
Influenza training leads to increased pro-inflammatory responses in BMDMs and mild cross-protection in vivo (A) Experimental schematic for influenza trained WBM-derived BMDMs. (B) M. avium bacterial CFU engulfed per BMDM 4 h post M. avium challenge. (C–E) BMDM supernatant cytokine concentration from BMDM cultures 4 h post M. avium challenge for: (C) IL-4 (D) IL-12p70 (E) TNFα Statistics: two-way ANOVA with Tukey’s multiple comparisons, n = 3–4 per experimental group. (F) Mosaic model of H1N1 PR8-trained HSPC transplants followed by M. avium challenge. (G) Representative images of spleens from control and challenged transplant recipients one month post M. avium infection. (H) M. avium bacterial load in challenged recipients of untrained versus trained HSPCs. Data are pooled from two independent experiments, n = 7–17 per experimental group. Significant by two-way ANOVA with Tukey’s multiple comparisons. (I) Representative histology of spleens of transplanted challenged recipients at 10x magnification, 210 μm scale bar. (J) Splenic granuloma quantification from one longitudinally cut complete spleen section at 10x magnification. p values calculated by one-way ANOVA, n = 3 per experimental group. (K–M) Serum cytokine from transplant recipient mice 1 month after M. avium challenge. (K) IL-6 (L) CXCL9 and (M) CXCL10 serum cytokine levels were elevated in H1N1 PR8-trained recipients post challenge compared to untrained controls. Statistics: Unpaired t-test, n = 6–10 per group. ∗p < 0.05, ∗∗p < 0.01 ∗∗∗p < 0.001 ∗∗∗∗p < 0.0001.
Figure 6
Figure 6
M. avium training induces cross-protection against acute influenza infection (A) Mosaic mouse model of M. avium trained HSPC recipients and H1N1 influenza challenge. (B–D) Serum cytokine levels in transplant recipients three days post H1N1 PR8 challenge for: (B) IFNγ, (C) CXCL5, and (D) CXCL9. n = 5–6 per experimental group. Statistics: unpaired t-test. (E–G) H&E-stained lung sections from untrained and trained challenged mice. From left to right: 2x and 5x magnification: whole lung sections representing global tissue damage. 10x magnification: representative section of bronchioles, untrained HSPC recipients have more immune infiltration within the bronchiole space compared to trained HSPC recipients. 40x: representative section of alveolar sacs (F) Nucleated immune cells per mm2 of lung tissue. n = 4 per group (G) Viral titer 3 days post influenza infection quantified by influenza nucleoprotein (NP) qPCR from lung supernatants, n = 6 mice per group, statistics:unpaired t-test. (H–K) Flow cytometry analysis of bone marrow leukocytes from challenged transplant recipients three days post H1N1 PR8 challenge. (H) CD45.2 ST-HSC/MPP1 (LK, CD150+, CD48, Flk2-, CD34+), (I) CD45.2 myeloid biased progenitors (MPP3) (LK, CD150-, CD48+, Flk2-, CD34+), (J) CD45.2 GMP (LK, CD150-, CD16/32+), and (K) CD45.2 Ly6c monocytes (CD11b+, Ly6g, SSC-A low, Ly6c) were increased in M. avium trained HSPC recipients compared to untrained controls. n = 5–6 per group, Statistics: Unpaired t test. (L) Kaplan Meier survival curve of transplanted mice challenged with 5xLD50 (150 pfu) influenza H1N1 PR8. Results were pooled from two independent experiments, n = 11–12 per group per experiment. ∗p < 0.05, ∗∗p < 0.01 ∗∗∗p < 0.001 ∗∗∗∗p < 0.0001.

Similar articles

Cited by

References

    1. Bekkering S., Domínguez-Andrés J., Joosten L.A.B., Riksen N.P., Netea M.G. Trained Immunity: Reprogramming Innate Immunity in Health and Disease. Annu. Rev. Immunol. 2021;39:667–693. doi: 10.1146/annurev-immunol-102119-073855. - DOI - PubMed
    1. Domínguez-Andrés J., Joosten L.A., Netea M.G. Induction of innate immune memory: the role of cellular metabolism. Curr. Opin. Immunol. 2019;56:10–16. doi: 10.1016/j.coi.2018.09.001. - DOI - PubMed
    1. Butkeviciute E., Jones C.E., Smith S.G. Heterologous effects of infant BCG vaccination: Potential mechanisms of immunity. Future Microbiol. 2018;13:1193–1208. doi: 10.2217/fmb-2018-0026. - DOI - PMC - PubMed
    1. Arts R.J.W., Moorlag S.J.C.F.M., Novakovic B., Li Y., Wang S.Y., Oosting M., Kumar V., Xavier R.J., Wijmenga C., Joosten L.A.B., et al. BCG Vaccination Protects against Experimental Viral Infection in Humans through the Induction of Cytokines Associated with Trained Immunity. Cell Host Microbe. 2018;23:89–100.e5. doi: 10.1016/j.chom.2017.12.010. - DOI - PubMed
    1. Berendsen M.L., van Gijzel S.W., Smits J., de Mast Q., Aaby P., Benn C.S., Netea M.G., van der Ven A.J. BCG vaccination is associated with reduced malaria prevalence in children under the age of 5 years in sub-Saharan Africa. BMJ Glob. Health. 2019;4:e001862. doi: 10.1136/bmjgh-2019-001862. - DOI - PMC - PubMed