

Genome-scale modeling predicts metabolic differences between macrophage subtypes in colorectal cancer
- PMID: 37664588
- PMCID: PMC10474475
- DOI: 10.1016/j.isci.2023.107569
Genome-scale modeling predicts metabolic differences between macrophage subtypes in colorectal cancer
Abstract
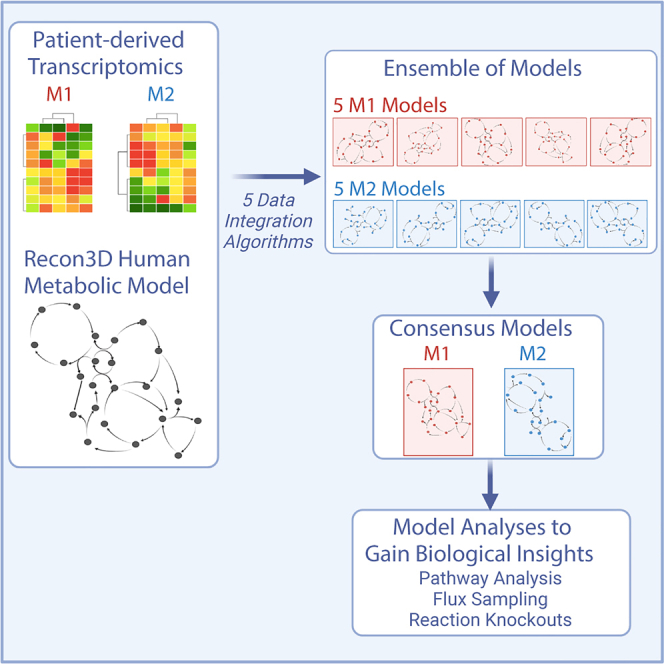
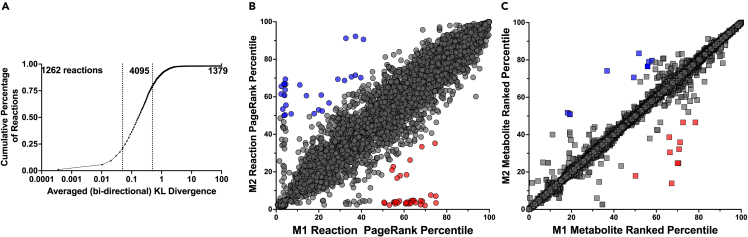
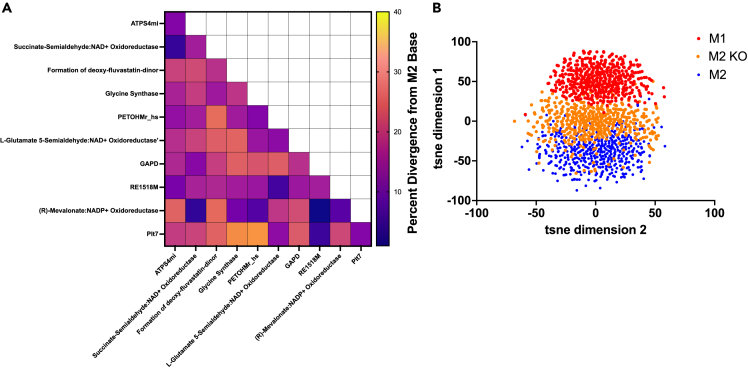
Colorectal cancer (CRC) shows high incidence and mortality, partly due to the tumor microenvironment (TME), which is viewed as an active promoter of disease progression. Macrophages are among the most abundant cells in the TME. These immune cells are generally categorized as M1, with inflammatory and anti-cancer properties, or M2, which promote tumor proliferation and survival. Although the M1/M2 subclassification scheme is strongly influenced by metabolism, the metabolic divergence between the subtypes remains poorly understood. Therefore, we generated a suite of computational models that characterize the M1- and M2-specific metabolic states. Our models show key differences between the M1 and M2 metabolic networks and capabilities. We leverage the models to identify metabolic perturbations that cause the metabolic state of M2 macrophages to more closely resemble M1 cells. Overall, this work increases understanding of macrophage metabolism in CRC and elucidates strategies to promote the metabolic state of anti-tumor macrophages.
Keywords: Cancer; Health informatics; Human genetics; Quantitative genetics.
© 2023 The Authors.
Conflict of interest statement
The authors declare no competing interests.
Figures
Update of
-
Ensemble-based genome-scale modeling predicts metabolic differences between macrophage subtypes in colorectal cancer.bioRxiv [Preprint]. 2023 Mar 11:2023.03.09.532000. doi: 10.1101/2023.03.09.532000. bioRxiv. 2023. Update in: iScience. 2023 Aug 09;26(9):107569. doi: 10.1016/j.isci.2023.107569. PMID: 36993493 Free PMC article. Updated. Preprint.
Similar articles
-
Ensemble-based genome-scale modeling predicts metabolic differences between macrophage subtypes in colorectal cancer.bioRxiv [Preprint]. 2023 Mar 11:2023.03.09.532000. doi: 10.1101/2023.03.09.532000. bioRxiv. 2023. Update in: iScience. 2023 Aug 09;26(9):107569. doi: 10.1016/j.isci.2023.107569. PMID: 36993493 Free PMC article. Updated. Preprint.
-
EZH2 Inhibitors Suppress Colorectal Cancer by Regulating Macrophage Polarization in the Tumor Microenvironment.Front Immunol. 2022 Apr 1;13:857808. doi: 10.3389/fimmu.2022.857808. eCollection 2022. Front Immunol. 2022. PMID: 35432300 Free PMC article.
-
Dysregulated metabolism: A friend-to-foe skewer of macrophages.Int Rev Immunol. 2023;42(4):287-303. doi: 10.1080/08830185.2022.2095374. Epub 2022 Jul 6. Int Rev Immunol. 2023. PMID: 35792727 Review.
-
Tumor cells-derived exosomal circVCP promoted the progression of colorectal cancer by regulating macrophage M1/M2 polarization.Gene. 2023 Jun 20;870:147413. doi: 10.1016/j.gene.2023.147413. Epub 2023 Apr 5. Gene. 2023. PMID: 37028610
-
Tumor-associated macrophages employ immunoediting mechanisms in colorectal tumor progression: Current research in Macrophage repolarization immunotherapy.Int Immunopharmacol. 2023 Mar;116:109569. doi: 10.1016/j.intimp.2022.109569. Epub 2023 Feb 9. Int Immunopharmacol. 2023. PMID: 36773572 Review.
Cited by
-
Dissecting metabolic landscape of alveolar macrophage.Sci Rep. 2024 Dec 5;14(1):30383. doi: 10.1038/s41598-024-81253-w. Sci Rep. 2024. PMID: 39638830 Free PMC article.
-
ThermOptCobra: Thermodynamically optimal construction and analysis of metabolic networks for reliable phenotype predictions.iScience. 2025 Jun 26;28(8):113005. doi: 10.1016/j.isci.2025.113005. eCollection 2025 Aug 15. iScience. 2025. PMID: 40777053 Free PMC article.
-
Single-cell sequencing combined with spatial transcriptomics reveals that the IRF7 gene in M1 macrophages inhibits the occurrence of pancreatic cancer by regulating lipid metabolism-related mechanisms.Clin Transl Med. 2024 Aug;14(8):e1799. doi: 10.1002/ctm2.1799. Clin Transl Med. 2024. PMID: 39118300 Free PMC article.
-
Integrating mechanism-based T cell phenotypes into a model of tumor-immune cell interactions.APL Bioeng. 2024 Aug 20;8(3):036111. doi: 10.1063/5.0205996. eCollection 2024 Sep. APL Bioeng. 2024. PMID: 39175956 Free PMC article.
-
Flux sampling in genome-scale metabolic modeling of microbial communities.BMC Bioinformatics. 2024 Jan 29;25(1):45. doi: 10.1186/s12859-024-05655-3. BMC Bioinformatics. 2024. PMID: 38287239 Free PMC article.
References
-
- Song M., Li D., Makaryan S.Z., Finley S.D. Quantitative modeling to understand cell signaling in the tumor microenvironment. Current Opinion in Systems Biology. 2021;27 doi: 10.1016/j.coisb.2021.05.006. - DOI
Grants and funding
LinkOut - more resources
Full Text Sources
