. 2023 Aug 12;26(9):107609.
doi: 10.1016/j.isci.2023.107609. eCollection 2023 Sep 15.

MYCT1 attenuates renal fibrosis and tubular injury in diabetic kidney disease

Affiliations

MYCT1 attenuates renal fibrosis and tubular injury in diabetic kidney disease

Xin Li et al. iScience. .

Abstract

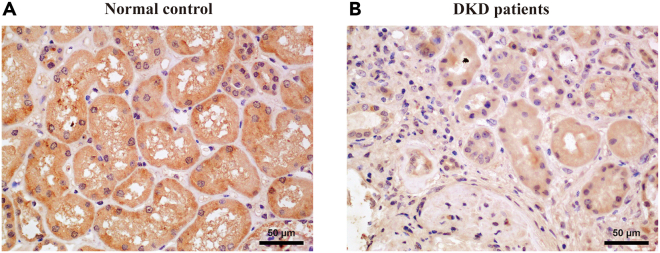
Tubulointerstitial abnormalities contribute to the progression of diabetic kidney disease (DKD). However, the underlying mechanism of the pathobiology of tubulointerstitial disease is largely unknown. Here, we showed that MYCT1 expression was downregulated in in vitro and in vivo DKD models. Adeno-associated virus (AAV)-Myct1 significantly attenuated renal dysfunction and tubulointerstitial fibrosis in diabetic db/db mice and downregulated Sp1 transcription and TGF-β1/SMAD3 pathway activation. In human proximal tubular epithelial cells, high glucose-induced high expression of SP1 and TGF-β1/SMAD3 pathway activation as well as overaccumulation of extracellular matrix (ECM) were abrogated by MYCT1 overexpression. Mechanistically, the binding of VDR to the MYCT1 promoter was predicted and confirmed using dual-luciferase reporter and ChIP analysis. VDR transcriptionally upregulates MYCT1. Our data reveal MYCT1 as a new and potential therapeutic target in treating DKD.

Keywords: Biological sciences; Diabetology; Molecular biology.


Conflict of interest statement

The authors declare no competing interests.

Figures

None
Graphical abstract
Figure 1
Figure 1
Expression of MYCT1 in renal biopsies (A and B) IHC staining of MYCT1 protein in renal biopsies from normal controls (A) and DKD patients (B). The scale bar represents 50 μm. Magnification is 400×. Normal, normal kidney biopsies. DKD, kidney biopsies from diabetic kidney disease patients.
Figure 2
Figure 2
Expression of MYCT1, VDR and SP1 in kidney tissue of diabetic db/db mice and in HG-treated HK-2 cells (A–C) qRT–PCR shows that the mRNAs of Myct1 and Vdr are downregulated and the mRNA of Sp1 is upregulated in renal cortical tissue of db/db mice compared with db/m mice. (D) Western blot analysis shows that the proteins Myct1 and Vdr are downregulated and the protein Sp1 is upregulated in renal cortical tissue of db/db mice compared with db/m mice. (E–G) qRT–PCR shows that the mRNA levels of MYCT1 and VDR are downregulated and the mRNA level of SP1 is upregulated in the HG group compared with the NG and MA groups. (H) Western blot analysis shows that the MYCT1 and VDR proteins are downregulated and the SP1 protein is upregulated in the HG group compared with the NG and MA groups. In all panels, the data are representative of three independent experiments. Control: db/m mice, DKD: db/db mice. Data are presented as the mean ± SD. ∗p < 0.05, ∗∗p < 0.01, NS, not significant.
Figure 3
Figure 3
Effect of Myct1 overexpression on the expression of SP1 and VDR in diabetic db/db mice (A) Schematic of the mouse experimental protocol. (B–D) The effect of AAV-Myct1 on the mRNA expression of Myct1, Vdr and Sp1 in the renal cortical tissues of mouse kidney tissues was detected using qRT–PCR analysis. (E) The effect of AAV-Myct1 on the protein expression of Myct1, Vdr and Sp1 in the renal cortical tissues of mouse kidney tissues was detected using Western blot analysis. (F) IHC detection of Myct1, Vdr and Sp1 in mouse kidney tissues of the db/m, db/db, db/db+AAV-Vector and db/db+AAV-Myct1 groups (×400). Bar = 50 μm. (G) Dual immunofluorescent staining for Myct1 and various segment-specific tubular markers in kidneys from db/m mice. The following segment-specific tubular markers were used: proximal tubule, lotus tetragonolobus lectin (LTL); distal tubule, peanut agglutinin (PNA); and collecting duct, dolichos biflorus agglutinin (DBA). Arrows indicate positive tubules with colocalization of Myct1 and specific tubular markers. Bar = 50 μm. In all panels, the data are representative of three independent experiments. Control: db/m mice, DKD: db/db mice. Data are presented as the mean ± SD. ∗p < 0.05, ∗∗p < 0.01, NS, not significant.
Figure 4
Figure 4
Overexpression of Myct1 restores renal function in diabetic db/db mice (A and B) The UACR and urinary Ngal at various time points (12, 15, 17 and 20 weeks of age). (C and D) Blood glucose (mmol/L) and (D) body weight (g) were detected at the indicated weeks (12, 15, 17 and 20 weeks of age). (E and F) The kidney weight and (F) KW/BW ratio in various groups at the end of the study. (G and H) Serum creatinine and (H) Serum BUN in various groups at 20 weeks of age. (I) Representative images of H-E and PAS and Masson staining (×400). Bar = 50 μm. (J) Quantitative analysis of collagen deposition of Masson staining. Control: db/m mice, DKD: db/db mice. In all panels, the data are representative of three independent experiments. Data are presented as the mean ± SD. ∗p < 0.05, ∗∗p < 0.01, NS, not significant.
Figure 5
Figure 5
Overexpression of Myct1 reduced tubulointerstitial fibrosis in diabetic mouse kidneys (A) The effect of AAV-Myct1 on the protein expression of Tgf-β1, p-Smad3, Collagen I, Collagen IV and Fn in renal cortical tissues from various groups was detected using Western blot analysis. (B) IHC detection of Tgf-β1, p-Smad3, Collagen I, Collagen IV and Fn in mouse kidney tissues of various groups at the end of the study (×400). Bar = 50 μm. (C and D) The mRNA expression of Tgf-β1 and Smad3 in the renal cortical tissues from various groups was detected using qRT–PCR. Control: db/m mice, DKD: db/db mice. In all panels, the data are representative of three independent experiments. Data are presented as the mean ± SD. ∗p < 0.05, ∗∗p < 0.01, NS, not significant.
Figure 6
Figure 6
Effect of Myct1 overexpression on the expression of SP1 and VDR and profibrotic processes in HG-treated HK-2 cells (A and B) Forty-eight hours after transfection of the MYCT1 overexpression plasmids (2500 ng) in the HG group in 6-well plates, MYCT1 overexpression efficiencies were assessed using qRT–PCR and Western blot analysis. (C–F) Forty-eight hours after transfection of the MYCT1 overexpression plasmids in the NG group and HG group, the mRNA expression levels of VDR, SP1, TGF-β1 and SMAD3 were assessed using qRT–PCR. (G) Forty-eight hours after transfection of the MYCT1 overexpression plasmids in the NG group and HG group, the protein expression levels of VDR, SP1, TGF-β1, p-SMAD3 and SMAD3 as well as the important ECM components COL I, COL IV and FN were assessed using Western blot analysis. (H) After transfection with the MYCT1 overexpression plasmids, cell proliferation was detected with a CCK-8 assay at 0, 24, 48 and 72 h. In all panels, the data are representative of three independent experiments. Data are presented as the mean ± SD. ∗p < 0.05, ∗∗p < 0.01, NS, not significant.
Figure 7
Figure 7
Regulatory effect of VDR on the MYCT1 promoter (A) One VDR binding site on the promoter of MYCT1 was predicted by the JASPAR tool. (B) Luciferase reporter analysis elucidated the influence of VDR silencing on the luciferase activity of the MYCT1 promoter reporter in each group. (C and D) ChIP analysis of the VDR-binding site. The DNA fragment corresponding to the promoter of MYCT1 enriched by VDR binding was evaluated by agarose gel electrophoresis or real-time quantitative PCR. (E) Forty-eight hours after treatment with calcitriol in the HG group, the mRNA expression levels of VDR and MYCT1 were assessed using qRT–PCR. (F) Forty-eight hours after transfection with VDR siRNAs in the NG group, the mRNA expression levels of VDR and MYCT1 were assessed using qRT–PCR. (G) Forty-eight hours after treatment with calcitriol in the HG group, the protein expression levels of VDR and MYCT1 were assessed using Western blot analysis. (H) Forty-eight hours after transfection with VDR siRNAs in the NG group, the protein expression levels of VDR and MYCT1 were assessed using Western blot analysis. In all panels, the data are representative of three independent experiments. Data are presented as the mean ± SD. ∗p < 0.05, ∗∗p < 0.01, NS, not significant.

Similar articles

Cited by

References

    1. Barrera-Chimal J., Lima-Posada I., Bakris G.L., Jaisser F. Mineralocorticoid receptor antagonists in diabetic kidney disease - mechanistic and therapeutic effects. Nat. Rev. Nephrol. 2022;18:56–70. doi: 10.1038/s41581-021-00490-8. - DOI - PubMed
    1. Chen J., Wang X., He Q., Bulus N., Fogo A.B., Zhang M.Z., Harris R.C. YAP Activation in Renal Proximal Tubule Cells Drives Diabetic Renal Interstitial Fibrogenesis. Diabetes. 2020;69:2446–2457. doi: 10.2337/db20-0579. - DOI - PMC - PubMed
    1. Mori Y., Ajay A.K., Chang J.H., Mou S., Zhao H., Kishi S., Li J., Brooks C.R., Xiao S., Woo H.M., et al. KIM-1 mediates fatty acid uptake by renal tubular cells to promote progressive diabetic kidney disease. Cell Metabol. 2021;33:1042–1061.e7. doi: 10.1016/j.cmet.2021.04.004. - DOI - PMC - PubMed
    1. Qiu G., Qiu G., Xu Z., Huang D., Gong L., Li C., Sun X., Sun K. Cloning and characterization of MTLC, a novel gene in 6q25. Zhonghua Yi Xue Yi Chuan Xue Za Zhi. 2003;20:94–97. Chinese. - PubMed
    1. Wang P.P., Ding S.Y., Sun Y.Y., Li Y.H., Fu W.N. MYCT1 Inhibits the Adhesion and Migration of Laryngeal Cancer Cells Potentially Through Repressing Collagen VI. Front. Oncol. 2021;10 doi: 10.3389/fonc.2020.564733. - DOI - PMC - PubMed

LinkOut - more resources