

SHOX2 promotes prostate cancer proliferation and metastasis through disruption of the Hippo-YAP pathway
- PMID: 37664594
- PMCID: PMC10470409
- DOI: 10.1016/j.isci.2023.107617
SHOX2 promotes prostate cancer proliferation and metastasis through disruption of the Hippo-YAP pathway
Abstract
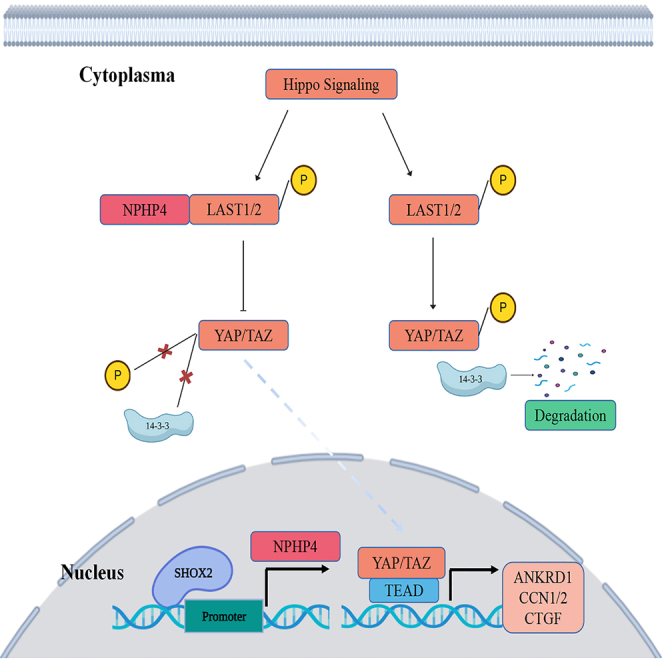
The transcription factor SHOX2 gene is critical in regulating gene expression and the development of tumors, but its biological role in prostate cancer (PCa) remains unclear. In this study, we found that SHOX2 expression was significantly raised in PCa tissues and was associated with clinicopathological features as well as disease-free survival (DFS) of PCa patients. Phenotypic tests showed that the absence of SHOX2 inhibited PCa growth and invasion, while SHOX2 overexpression promoted these effects. Mechanistically, SHOX2 was found to activate the transcription of nephronophthisis type 4 (NPHP4), a gene located downstream of SHOX2. Further analysis revealed that SHOX2 could potentially interfere with the Hippo-YAP signaling pathway through NPHP4 activation, facilitating the oncogenic behavior of PCa cells. These findings highlight SHOX2 as an oncogene in PCa and provide a basis for developing potential therapeutic approaches against this disease.
Keywords: Biological sciences; Cancer; Molecular biology.
© 2023.
Conflict of interest statement
The authors declare no competing interests.
Figures


Similar articles
-
Elevated expression of Par3 promotes prostate cancer metastasis by forming a Par3/aPKC/KIBRA complex and inactivating the hippo pathway.J Exp Clin Cancer Res. 2017 Oct 10;36(1):139. doi: 10.1186/s13046-017-0609-y. J Exp Clin Cancer Res. 2017. PMID: 29017577 Free PMC article.
-
Reduced DAPK1 Expression Promotes Stem Cell-Like Characteristics of Prostate Cancer Cells by Activating ZEB1 via Hippo/YAP Signaling Pathway.Stem Cells Dev. 2021 Sep 15;30(18):934-945. doi: 10.1089/scd.2021.0043. Epub 2021 Aug 17. Stem Cells Dev. 2021. PMID: 34289746
-
[Citron Rho-interacting serine/threonine kinase knockdown suppresses prostate cancer cell proliferation and metastasis by blocking Hippo-YAP pathway].Nan Fang Yi Ke Da Xue Xue Bao. 2019 Mar 30;39(3):257-263. doi: 10.12122/j.issn.1673-4254.2019.03.01. Nan Fang Yi Ke Da Xue Xue Bao. 2019. PMID: 31068310 Free PMC article.
-
Emerging Role of YAP and the Hippo Pathway in Prostate Cancer.Biomedicines. 2022 Nov 7;10(11):2834. doi: 10.3390/biomedicines10112834. Biomedicines. 2022. PMID: 36359354 Free PMC article. Review.
-
Targeting YAP and Hippo signaling pathway in liver cancer.Expert Opin Ther Targets. 2010 Aug;14(8):855-68. doi: 10.1517/14728222.2010.499361. Expert Opin Ther Targets. 2010. PMID: 20545481 Review.
Cited by
-
CCDC25 suppresses clear cell renal cell carcinoma progression by LATS1/YAP-mediated regulation of the hippo pathway.Cancer Cell Int. 2024 Apr 3;24(1):124. doi: 10.1186/s12935-024-03318-0. Cancer Cell Int. 2024. PMID: 38570766 Free PMC article.
-
Evaluating the comprehensive diagnosis efficiency of lung cancer, including measurement of SHOX2 and RASSF1A gene methylation.BMC Cancer. 2024 Mar 2;24(1):282. doi: 10.1186/s12885-024-12022-1. BMC Cancer. 2024. PMID: 38429660 Free PMC article.
-
Association of DNA methylation of RASSF1A and SHOX2 with lung cancer risk: A systematic review and meta-analysis.Medicine (Baltimore). 2024 Dec 13;103(50):e40042. doi: 10.1097/MD.0000000000040042. Medicine (Baltimore). 2024. PMID: 39686414 Free PMC article.
-
N6-methyladenosine-modified long non-coding RNA KIF9-AS1 promotes stemness and sorafenib resistance in hepatocellular carcinoma by upregulating SHOX2 expression.World J Gastroenterol. 2024 Dec 28;30(48):5174-5190. doi: 10.3748/wjg.v30.i48.5174. World J Gastroenterol. 2024. PMID: 39735272 Free PMC article.
-
Multi-omics analysis deciphers intercellular communication regulating oxidative stress to promote oral squamous cell carcinoma progression.NPJ Precis Oncol. 2024 Nov 21;8(1):272. doi: 10.1038/s41698-024-00764-x. NPJ Precis Oncol. 2024. PMID: 39572698 Free PMC article.
References
-
- Siegel R.L., Miller K.D., Wagle N.S., Jemal A. Cancer statistics, 2023. CA Cancer J Clin. 2023;1:17–48. - PubMed
-
- Seibert T.M., Garraway I.P., Plym A., Mahal B.A., Giri V., Jacobs M.F., Cheng H.H., Loeb S., Helfand B.T., Eeles R.A., Morgan T.M. Genetic Risk Prediction for Prostate Cancer: Implications for Early Detection and Prevention. Eur. Urol. 2023;83:241–248. - PubMed
-
- Ge R., Wang Z., Montironi R., Jiang Z., Cheng M., Santoni M., Huang K., Massari F., Lu X., Cimadamore A., et al. Epigenetic modulations and lineage plasticity in advanced prostate cancer. Ann. Oncol. 2020;31:470–479. - PubMed
LinkOut - more resources
Full Text Sources
