. 2023 Aug 2;26(9):107515.
doi: 10.1016/j.isci.2023.107515. eCollection 2023 Sep 15.

Biglycan regulated colorectal cancer progress by modulating enteric neuron-derived IL-10 and abundance of Bacteroides thetaiotaomicron

Affiliations

Biglycan regulated colorectal cancer progress by modulating enteric neuron-derived IL-10 and abundance of Bacteroides thetaiotaomicron

Yuyu Xu et al. iScience. .

Abstract

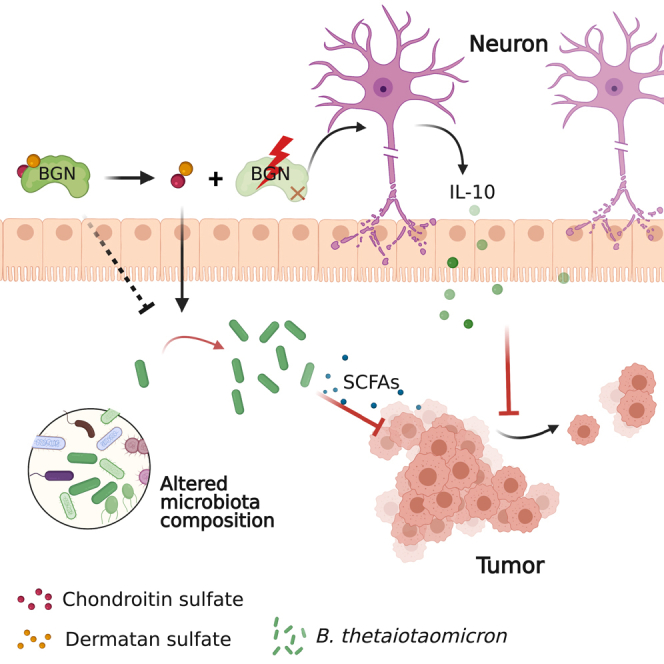
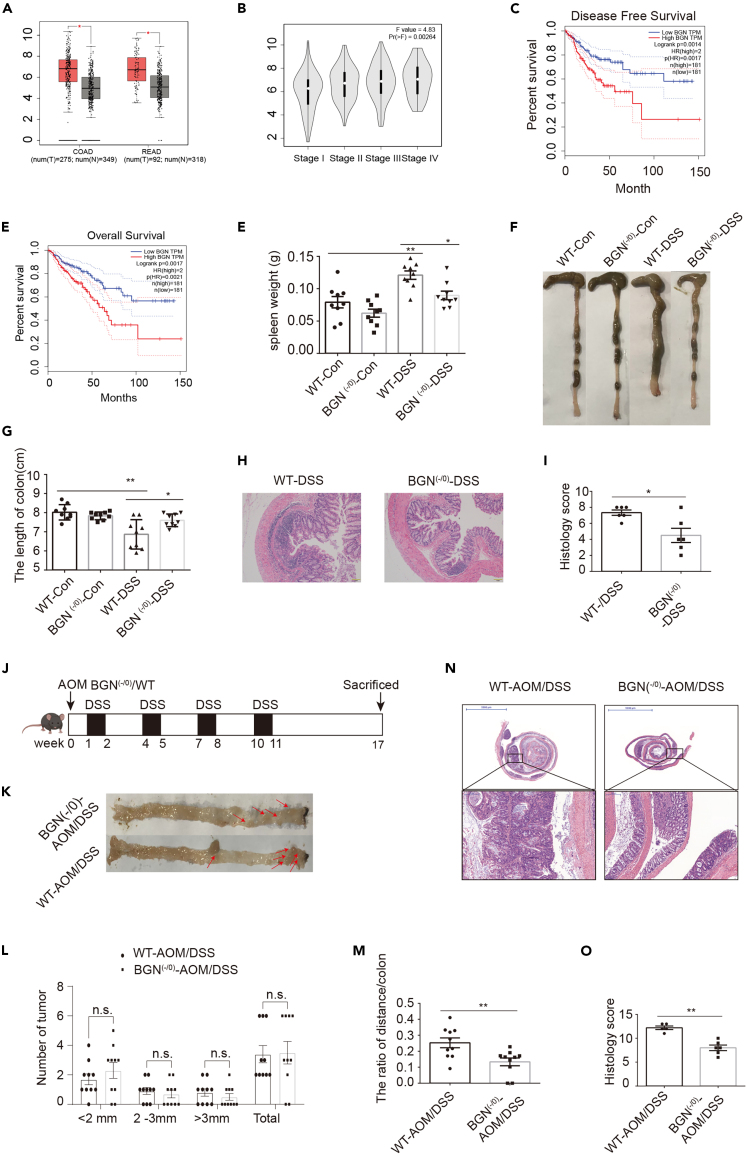
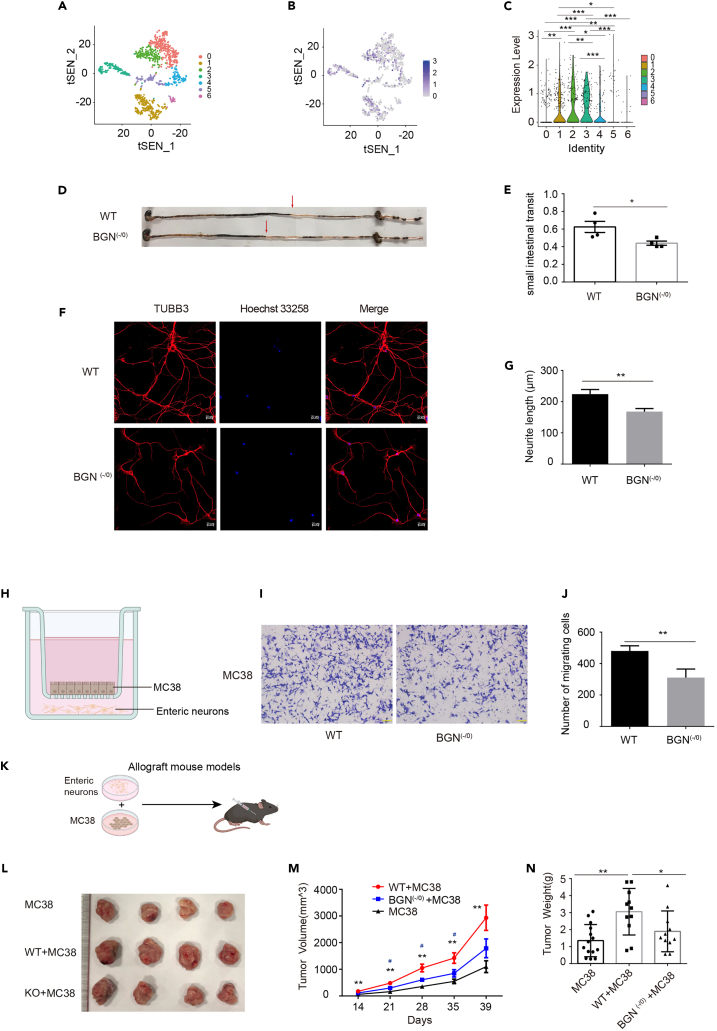
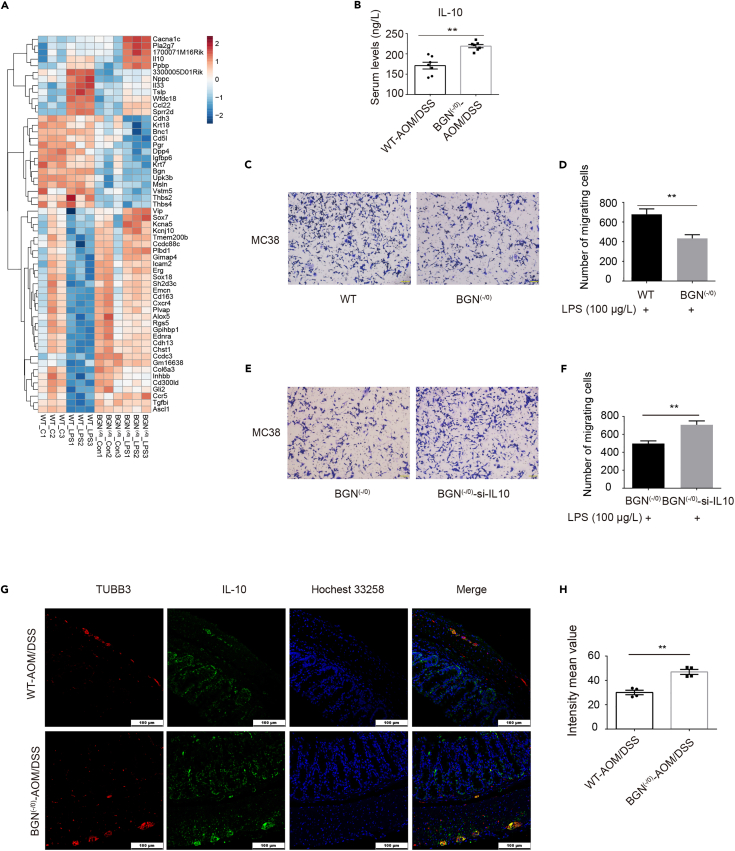
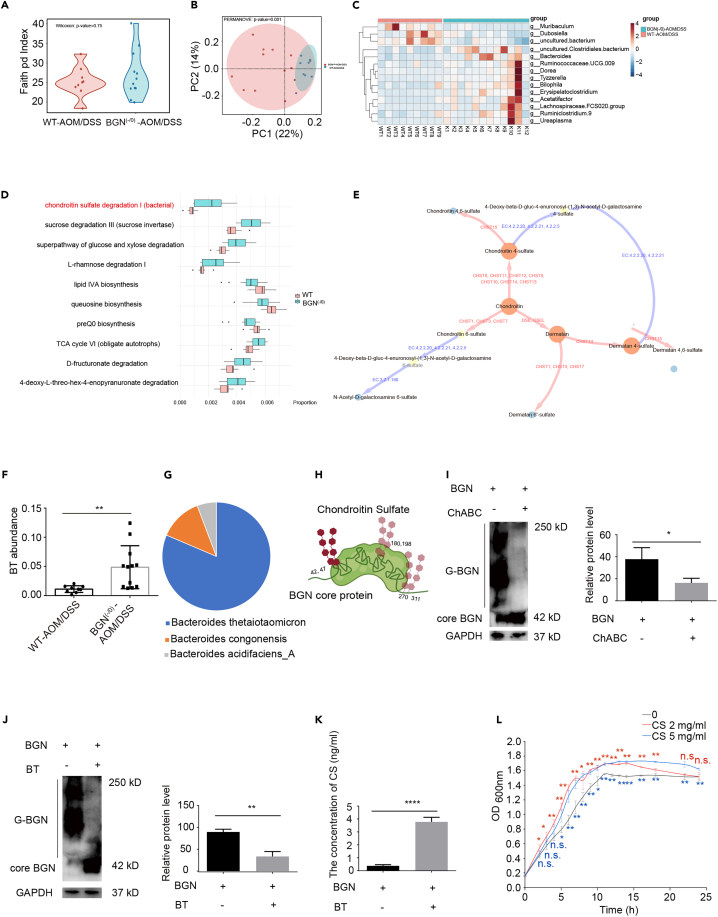
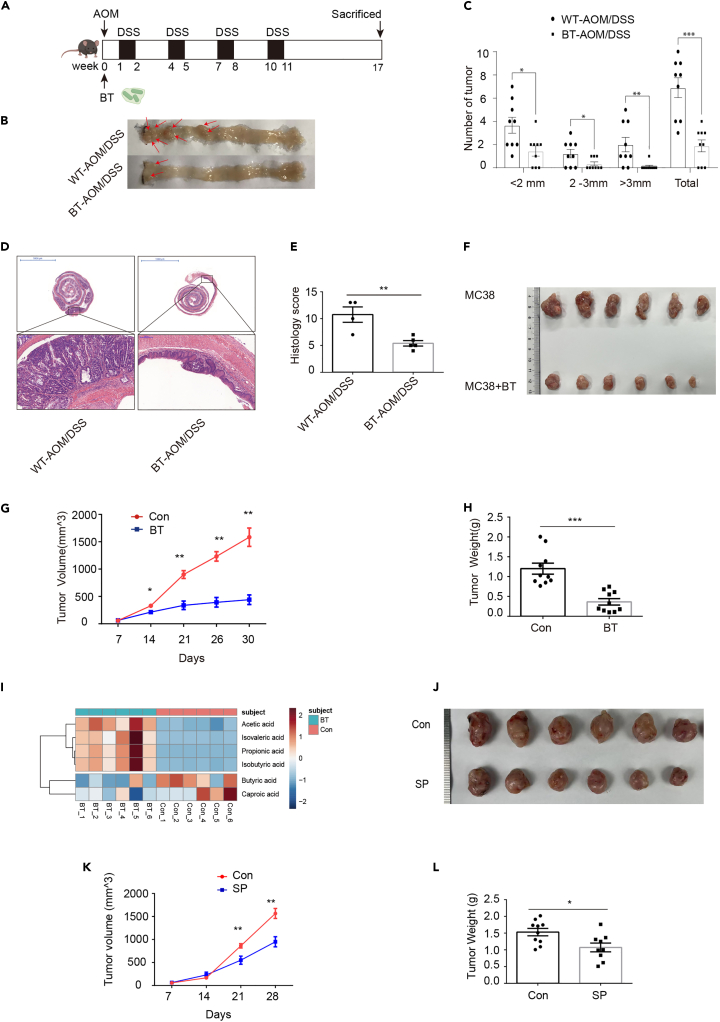
Biglycan (BGN) is a proteoglycan with branch chains and highly expressed in enteric neurons in the tumor tissue of colorectal cancer (CRC), which is negatively associated with survival rates in patients with CRC. However, how the proteoglycan promotes the progress of CRC through interacting with bacteria and regulating the immune response of enteric neurons remains largely unknown. In the present study, we found that biglycan deficiency changed tumor distribution in a colitis-associated colon cancer model. Furthermore, we revealed that BGN deficiency inhibits tumor growth in an allograft tumor model and the migration of cancer cell by upregulating interleukin-10 expression in enteric neurons. Significantly, we demonstrated that biglycan deficiency enriched the abundance of Bacteroides thetaiotaomicron through competing with it for chondroitin sulfate to inhibit CRC progress. Our work provided new insights into the interaction between host proteoglycan and gut microbiota as well as the role of enteric neurons in the tumor microenvironment.

Keywords: Cancer; Health sciences; Microbiome.


Conflict of interest statement

The authors declare no conflicts of interest.

Figures

None
Graphical abstract
Figure 1
Figure 1
BGN deficiency alleviates DSS-induced colitis and altered the tumor distribution in colitis-associated colon cancer mice model (A) BGN was higher expression in CRC tissue than adjacent normal tissue, as analyzed by GEPIA website. (B) The expression of BGN elevated in CRC tissue along with the stages of CRC, as analyzed by GEPIA website. (C) High level of BGN reduced the disease-free curves of CRC patients, as analyzed by GEPIA website. (D) High level of BGN reduced the overall survival curves of CRC patients, as analyzed by GEPIA website. (E) The spleen weight was higher in DSS-treated mice than that in control mice. BGN deficiency reduced spleen weight in DSS-treated mice (n = 9 mice/group). (F and G) Representative image of colon in mice colitis. DSS treatment reduced the length of colon and BGN deficiency increased the length of colon in DSS-treated mice (n = 9 mice/group). (H and I) Representative image of colon sections, stained with H&E (Scale: 1 mm). BGN deficiency reduced the colon pathological scores in mice colitis (n = 6 mice/group). (J) Schematic timeline for experimental design, created with Biorender.com. (K) Representative images of colonic tumors from AOM/DSS-treated BGN (-/0) and WT mice (n = 10 mice/group). (L) Tumor size and number of macroscopic polyps in AOM/DSS-treated BGN (-/0) and WT mice (n = 10 mice/group). (M) BGN deficiency changed the ratio of the distance from tumor to distal colon (DC) to the whole length of colon (n = 10 mice/group). (N and O) Representative image of Swiss-rolled colon sections, stained with H&E (scale bar = 200 μm, 5 mm). BGN deficiency reduced the colon pathological scores in mice CAC (n = 5–6 mice/group). Data are representative or cumulative results of at least two independent experiments (E, G–H, K, and L). Data are presented as mean ± S.E.M. ∗p < 0.05, ∗∗p < 0.01 and n.s. indicates not significant (p > 0.05).
Figure 2
Figure 2
BGN deficiency inhibited cancer cell migration and MC38 cell allograft growth through enteric neurons (A) The mouse enteric neurons were clustered to 7 clusters by tSNE. (B) Visualization of BGN expression in mouse enteric neurons clusters by tSNE. (C) BGN was expressed in mouse enteric neurons clusters. (D and E) Representative image of ink propulsion distance in BGN (-/0) and WT mice and BGN deficiency reduced intestinal propulsion rate (n = 4 mice/group). (F and G) Representative images of mouse enteric neurons of TUBB3 staining, by Immunofluorescence. BGN deficiency reduced the length of neurite (n = 3 mice/group). (H) The model of transwell co-culture of cancer cell and enteric neurons (Created with Biorender.com). (I and J) Representative image presenting transwell co-culture of MC-38 cells and the enteric neurons from BGN (-/0) and WT mice. The number of MC-38 cells migration was decreased in co-culture with BGN (-/0) mice enteric neurons (n = 3 biological replicates/group). (K) Allograft mouse model (Created with Biorender.com). (L) Representative image of tumors. (M) BGN (-/0) mice enteric neurons reduced the tumor size (n = 11–14 mice/group). (N) BGN (-/0) mice enteric neurons reduced the tumor weight (n = 11–14 mice/group). Data are representative or cumulative results of at least two independent experiments (D–G, J and L–M). Data are presented as mean ± S.E.M. ∗ indicates WT + MC38 group VS. MC38 group, # indicates WT + MC38 group VS. BGN (-/0) +MC38 group, ∗p < 0.05, ∗∗p < 0.01. ∗∗∗p < 0.001.
Figure 3
Figure 3
BGN deficiency enhanced IL-10 expression in mouse enteric neurons induced by LPS (A) Heatmap showing the top 31 DEGS in BGN (-/0) and WT control enteric neurons and LPS-treated BGN (-/0) and WT mouse enteric neurons. (B) BGN deficiency reduced the level of IL-10 in AOM/DSS-treated mice, as detected by ELISA assay (n = 7 mice/group). (C and D) Representative image presenting transwell co-culture of MC38 cells and the enteric neurons from BGN (-/0) and WT mice with LPS (100 μg/L). The number of MC38 cells migration was decreased in co-culture with BGN (-/0) mice enteric neurons with LPS (100 μg/L) treatment (n = 3 biological replicates/group). (E and F) Representative image presenting transwell co-culture of MC38 cells and the enteric neurons from BGN (-/0) and IL-10 knockdown of BGN (-/0) enteric neurons with LPS (100 μg/L). The number of MC38 cells migration was increased in co-culture with IL-10 knockdown of BGN (-/0) mice enteric neurons (n = 3 biological replicates/group). (G and H) BGN deficiency upregulated the IL-10 expression of enteric neurons in CAC mice (n = 4 mice/group). Data are representative or cumulative results of at least two independent experiments (B–H). Data are presented as mean ± S.E.M. ∗p < 0.05 and ∗∗p < 0.01.
Figure 4
Figure 4
BGN modulated gut microbiota composition of AOM/DSS mice (A) α-diversity (Faith pd Index) analysis in AOM/DSS-treated BGN (-/0) and WT mice (n = 9–12 mice/group). (B) BGN deficiency changed the β-diversity based on PcoA at the Bray-Curtis distance in AOM/DSS-treated BGN (-/0) and WT mice (n = 9–12 mice/group). (C) BGN deficiency changed the gut microbiota composition. Heatmap showing the differential genus in the fecal from AOM/DSS-treated BGN (-/0) and WT mice (n = 9–12 mice/group). (D) The functional abundances were different in AOM/DSS-treated BGN (-/0) and WT mice, analyzed by PICRUSt2 (n = 9–12 mice/group). (E) The chondroitin sulfate metabolic network. The red edge indicates the corresponding reaction were conducted by human-encoded enzymes, and the blue ones were done by bacteria-encoded enzymes. (F) BGN deficiency improved the relative abundance B. thetaiotaomicron (BT) in AOM/DSS-treated BGN (-/0) mice (n = 9–12 mice/group). (G) B. thetaiotaomicron was the primary taxon in CS degradation I pathway regulation (n = 9–12 mice/group). (H) The Schematic of BGN glycosylation site (Created with Biorender.com). (I) The glycosylation of BGN with CS can be digested by ChABC, detected by Western blotting and quantitative analysis. G-BGN means the glycosylated BGN (n = 3 biological replicates/group). (J) B. thetaiotaomicron reduced the glycosylation level of BGN, detected by Western blotting and quantitative analysis. G-BGN means the glycosylated BGN (n = 3 biological replicates/group). (K) B. thetaiotaomicron increased the level of dissociative CS, detected by ELISA (n = 5/group). (L) The growth curve for B. thetaiotaomicron showed CS promoted B. thetaiotaomicron growth. The blue ∗ indicates 5 mg/mL CS group VS. control group and the red ∗ indicates 2 mg/mL CS group VS. control group. Data are representative or cumulative results of at least two independent experiments (A–D, F, and I–L). Data are presented as mean ± S.E.M. ∗p < 0.05, ∗∗p < 0.01, ∗∗∗p < 0.001, ∗∗∗∗p < 0.0001 and n.s. indicates not significant (p > 0.05).
Figure 5
Figure 5
B. thetaiotaomicron and sodium propionate inhibited tumorgenesis in AOM/DSS-induced mouse CAC and MC38 allograft tumor, respectively (A) Schematic timeline for experimental design (Created with Biorender.com). (B) Representative images of colonic tumors from AOM/DSS-treated WT and B. thetaiotaomicron administration mice (n = 9mice/group). (C) B. thetaiotaomicron administration reduced the number of tumor size (n = 9 mice/group). (D and E) Representative images of Swiss-rolled colon sections, stained with H&E (scale bar = 200 μm, 5 mm). B. thetaiotaomicron administration reduced the pathological scores in CAC mice (n = 4–5 mice/group). (F) Representative images of MC38 allograft tumors in PBS and B. thetaiotaomicron administration group. (G and H) B. thetaiotaomicron administration reduced the growth and weight of MC38 allograft tumor (n = 10 mice/group). (I) The heatmap showed that supernatant of B. thetaiotaomicron medium was enriched in acetic acid, isovaleric acid, propionic acid and isobutyric acid not caproic acid and butyric acid (n = 6/group). (J) Representative images of MC38 allograft tumors in PBS and Sodium propionate injection group (n = 9–10 mice/group). (K and L) Sodium propionate reduced the growth and weight of MC38 allograft tumors (n = 9–10 mice/group). Data are representative or cumulative results of at least two independent experiments (B–H and J–L). Data are presented as mean ± S.E.M. ∗p < 0.05, ∗∗p < 0.01 and ∗∗∗p < 0.001.

References

    1. Sung H., Ferlay J., Siegel R.L., Laversanne M., Soerjomataram I., Jemal A., Bray F. Global Cancer Statistics 2020: GLOBOCAN Estimates of Incidence and Mortality Worldwide for 36 Cancers in 185 Countries. CA. Cancer J. Clin. 2021;71:209–249. doi: 10.3322/caac.21660. - DOI - PubMed
    1. Dekker E., Tanis P.J., Vleugels J.L.A., Kasi P.M., Wallace M.B. Colorectal cancer. Lancet. 2019;394:1467–1480. doi: 10.1016/S0140-6736(19)32319-0. - DOI - PubMed
    1. Yu A.I., Zhao L., Eaton K.A., Ho S., Chen J., Poe S., Becker J., Gonzalez A., McKinstry D., Hasso M., et al. Gut Microbiota Modulate CD8 T Cell Responses to Influence Colitis-Associated Tumorigenesis. Cell Rep. 2020;31 doi: 10.1016/j.celrep.2020.03.035. - DOI - PMC - PubMed
    1. Kvorjak M., Ahmed Y., Miller M.L., Sriram R., Coronnello C., Hashash J.G., Hartman D.J., Telmer C.A., Miskov-Zivanov N., Finn O.J., Cascio S. Cross-talk between Colon Cells and Macrophages Increases ST6GALNAC1 and MUC1-sTn Expression in Ulcerative Colitis and Colitis-Associated Colon Cancer. Cancer Immunol. Res. 2020;8:167–178. doi: 10.1158/2326-6066.CIR-19-0514. - DOI - PMC - PubMed
    1. Wu X., Yang H., Chen X., Gao J., Duan Y., Wei D., Zhang J., Ge K., Liang X.J., Huang Y., et al. Nano-herb medicine and PDT induced synergistic immunotherapy for colon cancer treatment. Biomaterials. 2021;269 doi: 10.1016/j.biomaterials.2021.120654. - DOI - PubMed