. 2023 Aug 11;26(9):107597.
doi: 10.1016/j.isci.2023.107597. eCollection 2023 Sep 15.

Transcriptomic and proteomic assessment of tocilizumab response in a randomized controlled trial of patients hospitalized with COVID-19

Affiliations

Transcriptomic and proteomic assessment of tocilizumab response in a randomized controlled trial of patients hospitalized with COVID-19

Haridha Shivram et al. iScience. .

Abstract

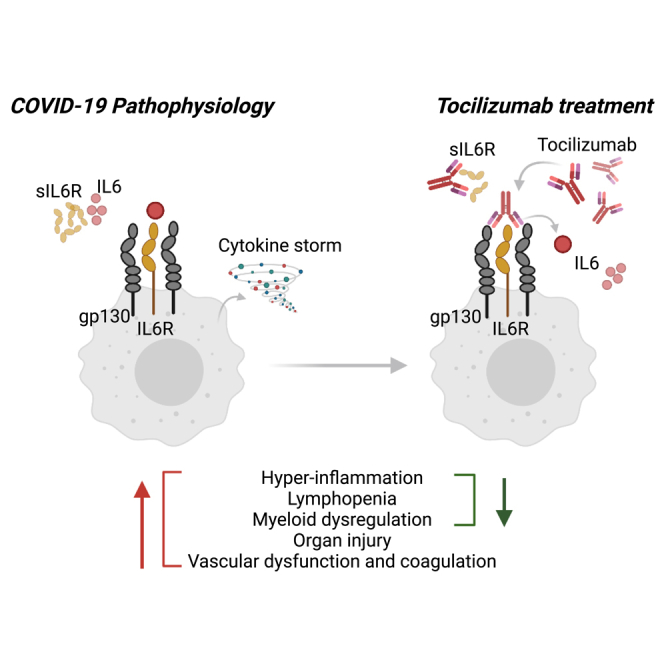
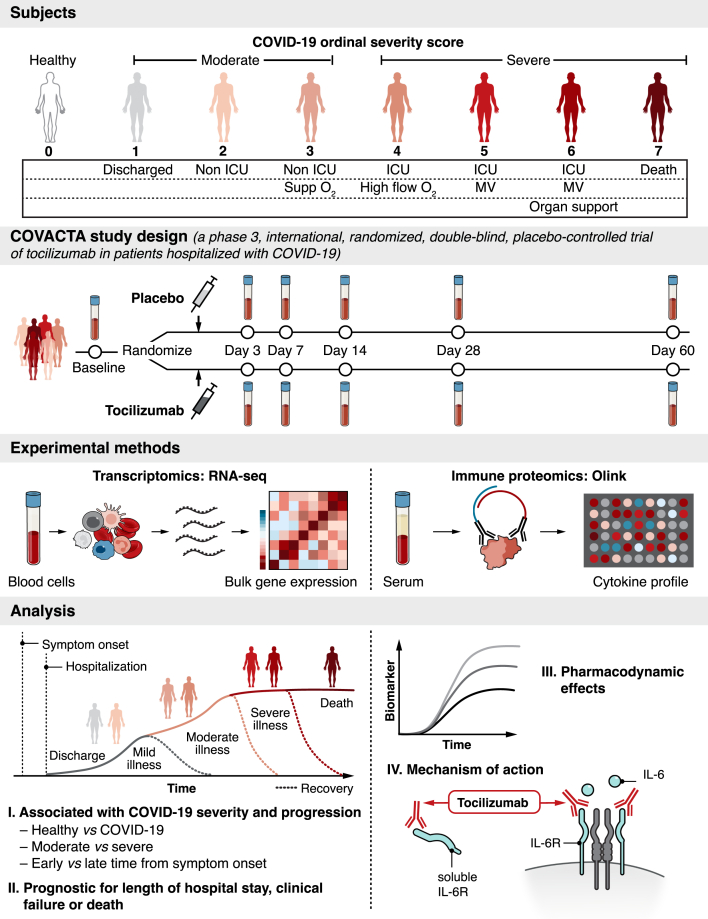
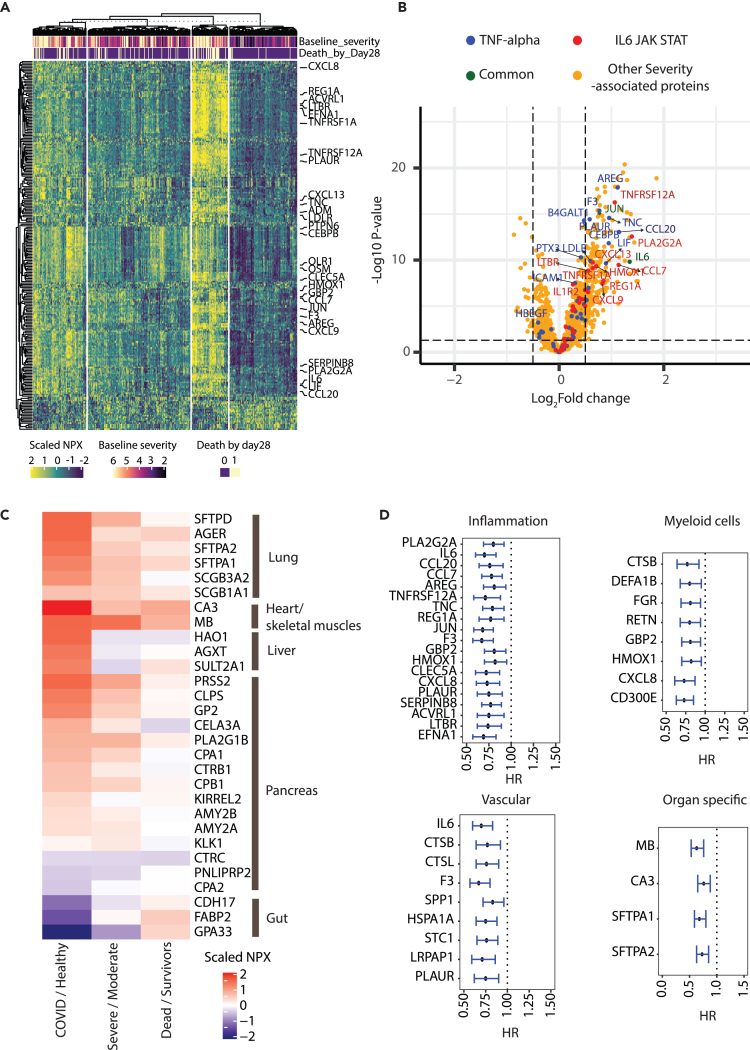
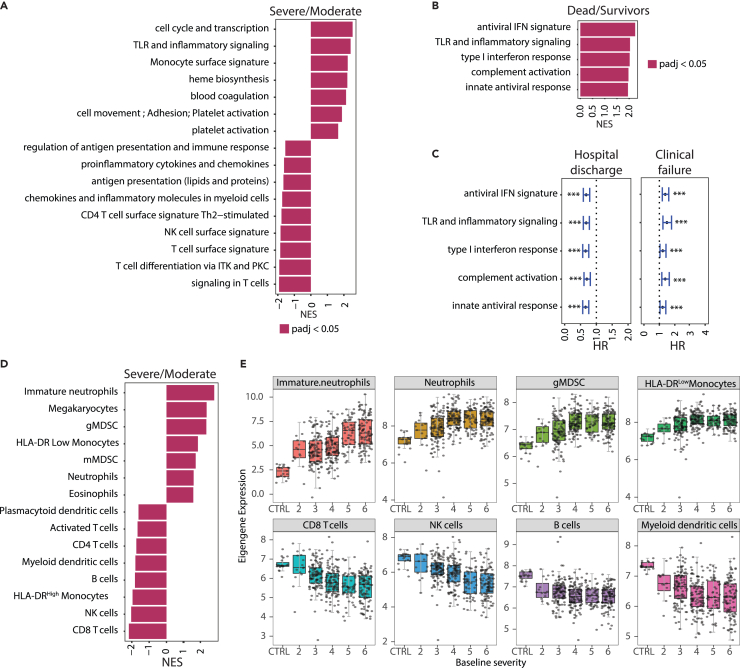
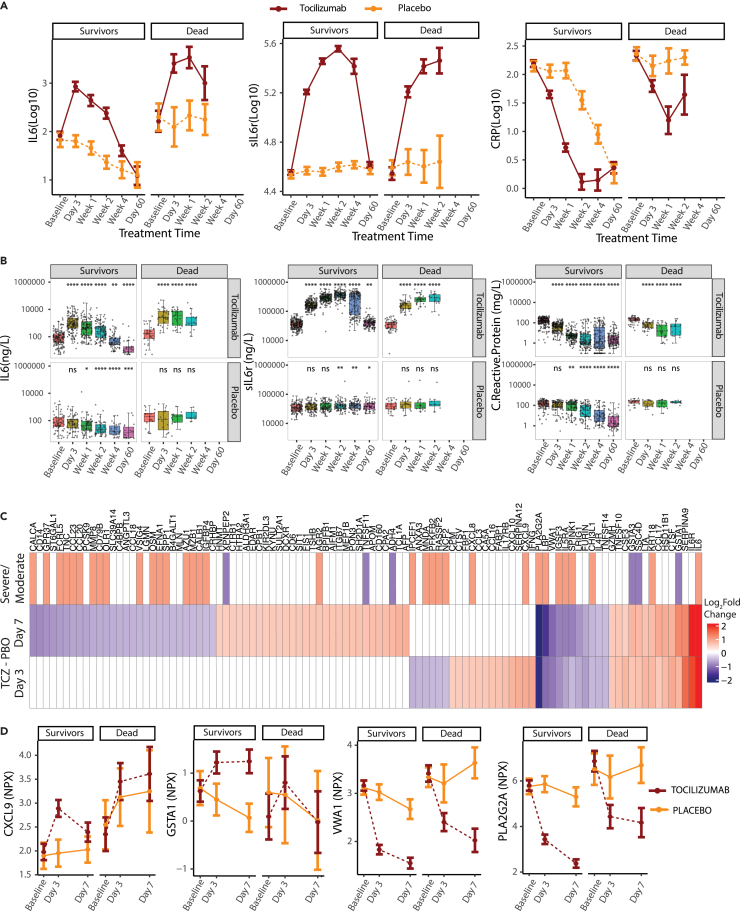
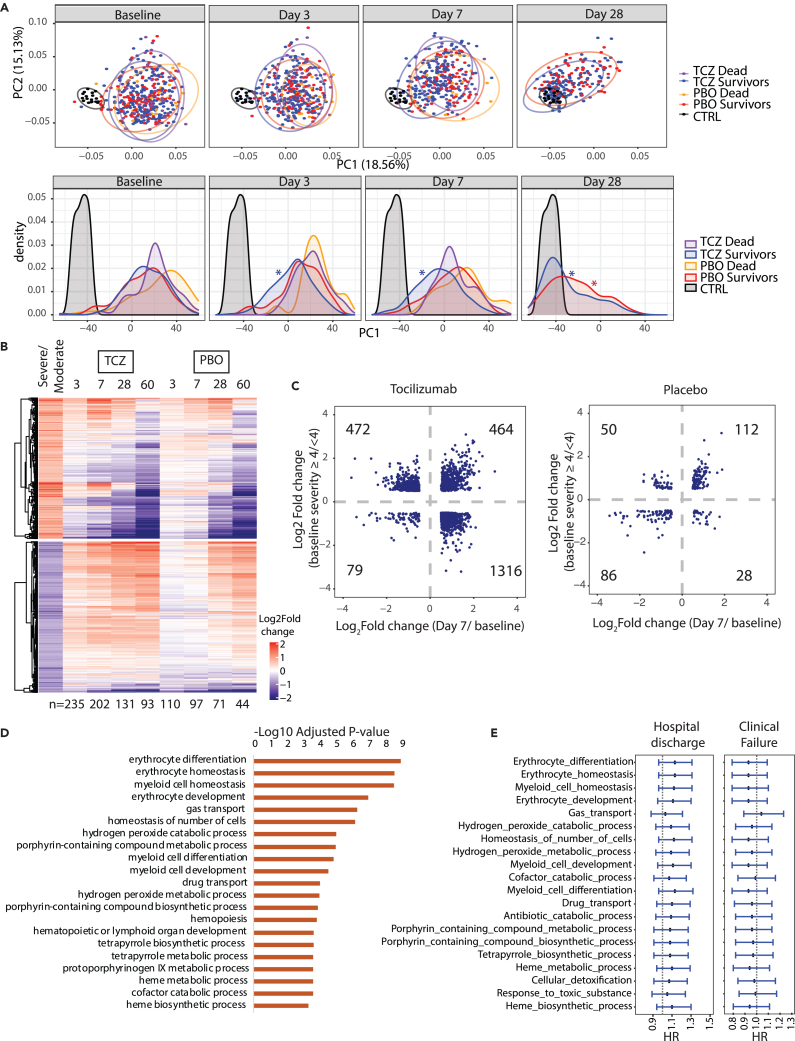
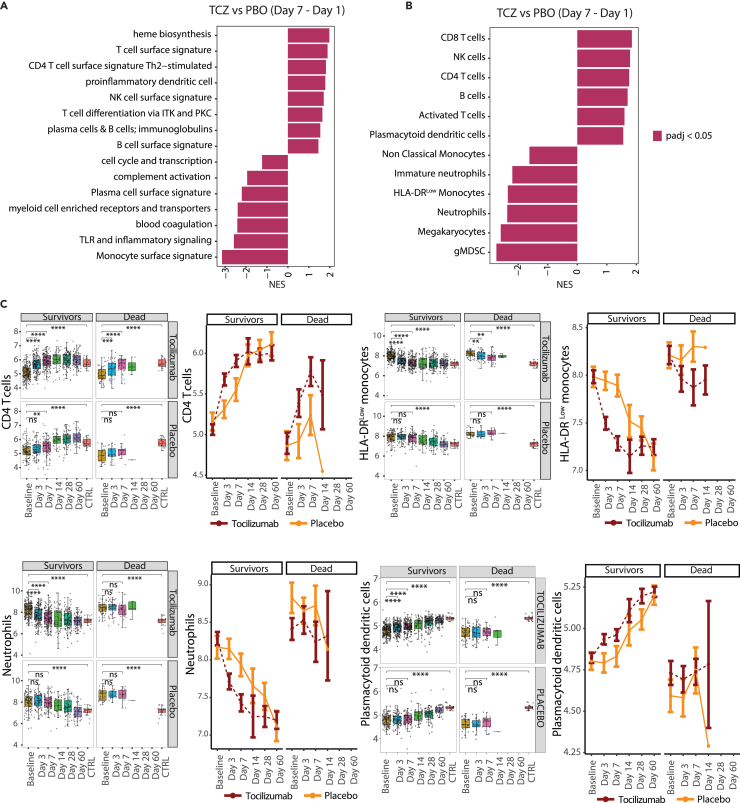
High interleukin (IL)-6 levels are associated with greater COVID-19 severity. IL-6 receptor blockade by tocilizumab (anti-IL6R; Actemra) is used globally for the treatment of severe COVID-19, yet a molecular understanding of the therapeutic benefit remains unclear. We characterized the immune profile and identified cellular and molecular pathways modified by tocilizumab in peripheral blood samples from patients enrolled in the COVACTA study, a phase 3, randomized, double-blind, placebo-controlled trial of the efficacy and safety of tocilizumab in hospitalized patients with severe COVID-19. We identified markers of inflammation, lymphopenia, myeloid dysregulation, and organ injury that predict disease severity and clinical outcomes. Proteomic analysis confirmed a pharmacodynamic effect for tocilizumab and identified novel pharmacodynamic biomarkers. Transcriptomic analysis revealed that tocilizumab treatment leads to faster resolution of lymphopenia and myeloid dysregulation associated with severe COVID-19, indicating greater anti-inflammatory activity relative to placebo and potentially leading to faster recovery in patients hospitalized with COVID-19.

Keywords: Omics; Pharmaceutical science; Virology.


Conflict of interest statement

H.S., J.A.H., C.M.R., A.Q., O.O., J.M., F.C., M.B., L.T., A.R., and R.N.B. are employees of Roche/Genentech and hold stock and/or stock options in Roche/Genentech. A.T. is an employee of Roche/Genentech. F.C. has a patent pending to Genentech for biomarkers for predicting a response to an interleukin (IL)-6 antagonist (P36367-US). L.T. is an author of a patent Method for Treating Pneumonia, including COVID-19 Pneumonia with an IL-6 Antagonist pending, owned by Genentech/Roche. A.R. is a co-founder and equity holder of Celsius Therapeutics, an equity holder in Immunitas Therapeutics and, until July 31, 2020, was a scientific advisory board member of ThermoFisher Scientific, Syros Pharmaceuticals, Asimov, and Neogene Therapeutics. A.R. is a named inventor on multiple patents related to single cell and spatial genomics filed by or issued to the Broad Institute. I.O.R. has nothing to declare.

Figures

None
Graphical abstract
Figure 1
Figure 1
Serum protein and whole blood RNA profiling from hospitalized patients with COVID-19 enrolled in the COVACTA study at baseline and during treatment with tocilizumab Disease severity was assessed at baseline and after dosing using a 7-category ordinal scale. At baseline, “moderate” COVID-19 was defined as an ordinal scale score <4 and “severe” COVID-19 was defined as ordinal scale score ≥4. The present analysis included an external control group using peripheral blood from healthy adults. Patients enrolled in COVACTA received a single intravenous tocilizumab infusion (8 mg/kg) or placebo in addition to standard care. Serum and peripheral whole blood collected from COVACTA patients at baseline (before dosing) and up to 60 days after dosing were profiled by proteomics (Olink) and transcriptomics (RNA-Seq) assays. Key immune aberrations associated with COVID-19, time from symptom onset, and disease severity were identified at baseline and assessed for prognostic association with time to hospital discharge/ready for discharge, mortality, and time to clinical failure. To understand mechanism of action, the pharmacodynamic effect of tocilizumab and the response of severity associated biomarkers to tocilizumab treatment were assessed in longitudinal samples. ICU, intensive care unit; IL-6R, interleukin 6 receptor; MV, mechanical ventilation.
Figure 2
Figure 2
Protein biomarkers associated with COVID-19 severity and disease progression (A) Heatmap showing serum levels in NPX units of 245 proteins differentially expressed based on COVID-19 baseline severity (224 proteins with higher and 21 with lower levels in severe patients respectively). 6 proteins were filtered out before plotting due to lower measurement quality. Rows represent proteins and columns represent samples measured at baseline. Columns (n = 391) are clustered using K-means clustering. Specific proteins involved in inflammatory pathways are highlighted by name. (B) Volcano plot showing differentially expressed proteins between severe and moderate COVID-19. Proteins involved in the specified pathways are highlighted by colors. (C) Heatmap showing differential expression of organ-specific proteins between COVID (n = 388) vs. healthy (n = 59) (Column 1), baseline severity ≥4 (Severe, n = 266) vs. < 4 (Moderate, n = 122) (Column 2), and mortality at day 28 yes (Dead, n = 79) vs. no (Survivors, n = 309) (Column 3). (D) Proteins prognostic for worse clinical outcome (time to hospital discharge) identified using Cox proportional hazard model. Proteins are arranged in decreasing order of fold change between severe vs. moderate cases. Error bars represent 95% confidence intervals. IL, interleukin; JAK STAT, Janus kinase-signal transducer and activator of transcription; TNF, tumor necrosis factor.
Figure 3
Figure 3
Transcriptomic signatures associated with COVID-19 severity and disease progression (A) Fast gene set enrichment analysis (FGSEA) of differentially expressed genes between cases with baseline severity ≥4 (Severe, n = 280) and <4 (Moderate, n = 124) at baseline. Higher NES represents upregulation of the indicated immune pathways. (B) FGSEA analysis of differentially expressed genes between cases associated with higher mortality (death by day 28, n = 83) and survivors (n = 321). Higher NES represents upregulation of the indicated immune pathway. (C) Forest plot showing hazard ratios with 95% confidence ratios identified using Cox proportional hazard model depicting time to hospital discharge (left) and clinical failure (right) from COVID-19 for immune pathways shown in (B). ∗∗∗Represents Benjamini-Hochberg adjusted p value < 0.05. Error bars represent 95% confidence intervals. (D) Same as 3A where higher NES represents upregulation of blood cellularity signatures. (E) Boxplots showing changes in eigengene values of blood cell-type signatures across different baseline severity scales of COVID-19 patients. The X axis represents the baseline severity scales: 2 (n = 15), 3, (n = 109), 4 (n = 114), 5 (n = 58), 6 (n = 107) and healthy controls (CTRL, n = 19). CD, cluster of differentiation; gMDSC, granulocytic myeloid-derived suppressor cells; HLA, human leukocyte antigen; HR, hazard ratio; IFN, interferon; ITK, IL-2 inducible T cell kinase; mMDSC, monocytic myeloid-derived suppressor cells; NES, normalized enrichment score; NK, natural killer; PKC, protein kinase C; PBO, placebo; TCZ, tocilizumab; Th, T helper cell; TLR, toll-like receptors.
Figure 4
Figure 4
Serum proteins responsive to tocilizumab treatment in hospitalized COVID-19 patients (A and B) (A) Line plots and (B) boxplots showing changes in serum levels measured by ELISA of known pharmacodynamic biomarkers of TCZ comparing response to treatment with TCZ and placebo longitudinally for cases showing clinical improvement (survivors) vs. those who die by day 28 (dead). Sample numbers plotted are provided in Table S5. ∗Represents statistical significance using Wilcoxon tests at each timepoint using baseline as the reference group. ∗≤0.05, ∗∗≤0.01, ∗∗∗≤0.001 and ∗∗∗∗≤0.0001. (C) Heatmap showing proteins differentially regulated between TCZ and placebo treatment by day 3 and day 7 determined by Olink, and whether they were elevated in severe vs. moderate COVID-19. Proteins highlighted represent those that change on TCZ treatment by at least ±0.5 log2fold over placebo. (TCZ Day 3/7 − baseline) – (PBO Day 3/7 − baseline). Gray cells represent proteins that did not meet the differential cut-off. (D) Line plots showing examples of treatment response of selected proteins to tocilizumab and placebo faceted by clinical status by day 28. Error bars represent 95% confidence intervals around the median. ELISA, enzyme-linked immunosorbent assay; IL-6, interleukin 6; PBO, placebo; TCZ, tocilizumab.
Figure 5
Figure 5
Differential gene expression in response to tocilizumab treatment in hospitalized COVID-19 patients (A) PCA and corresponding density plots showing longitudinal changes in RNA-seq signal at baseline, day 3, day 7, and day 28. ∗p value < 0.05, Kolmogorov-Smirnov test performed between the indicated timepoints relative to baseline. (B) Heatmap showing longitudinal response of the blood transcriptome to TCZ treatment. Rows represent severity-associated genes identified by DESeq2. For each timepoint only samples measured at baseline and at the indicated timepoint were used for analysis (n indicated below the heatmap). (C) Scatterplot of log2fold difference between severe vs. moderate baseline cases and day 7 after treatment vs. baseline for TCZ (left) and Placebo (right). Data points represent genes significantly different by ≥0.5 or ≥-0.5 log2fold for both comparisons. (D) Bar plot showing immune pathways enriched among genes expressed higher in severe vs. moderate cases at baseline that also show greater increase on TCZ treatment vs. placebo by day 7 ([TCZ Day 7 – TCZ Day 1] – [PBO Day 7 – PBO Day 1]). (E) Cox proportional hazard modeling for pathways shown in panel D. Forest plots generated as in (C). CTRL, control; HR, hazard ratio; PCA, principal component analysis; PBO, placebo; TCZ, tocilizumab.
Figure 6
Figure 6
Immune pathways and cellularity signatures responsive to tocilizumab treatment in hospitalized COVID-19 patients (A) Bar plot showing immune pathways enriched among genes showing a greater response to tocilizumab compared to placebo by day 7 (calculated as [TCZ Day 7 – TCZ Day 1] – [PBO Day 7 – PBO Day 1]). (B) Bar plot showing blood cell types enriched among genes showing greater response to TCZ compared to placebo by day 7 ([TCZ Day 7 – TCZ Day 1] – [PBO Day 7 – PBO Day 1]). (C) Boxplot (left) and line plot (right) showing eigengene expression of gene sets corresponding to blood cell types for cases treated with tocilizumab and placebo across timepoints. ∗Represents statistical significance using pairwise T tests at each timepoint using baseline as reference the reference group. ∗≤0.05, ∗∗≤0.01, ∗∗∗≤0.001 and ∗∗∗∗≤0.0001. Error bars represent 95% confidence intervals around the median. Sample numbers corresponding to the plotted categories are provided in Table S5. CD, cluster of differentiation; gMDSC, granulocytic myeloid-derived suppressor cells; HLA, human leukocyte antigen; ITK, IL-2 inducible T cell kinase; IL-2, interleukin-2; NES, normalized enrichment score; NK, natural killer; PKC, protein kinase C; PBO, placebo; TCZ, tocilizumab; Th, T helper cell; TLR, toll-like receptors.

Similar articles

Cited by

References

    1. Wang C., Wang Z., Wang G., Lau J.Y.N., Zhang K., Li W. COVID-19 in early 2021: current status and looking forward. Signal Transduct. Target. Ther. 2021;6:114. doi: 10.1038/s41392-021-00527-1. - DOI - PMC - PubMed
    1. WHO Rapid Evidence Appraisal for COVID-19 Therapies REACT Working Group. Shankar-Hari M., Vale C.L., Godolphin P.J., Fisher D., Higgins J.P.T., Spiga F., Savovic J., Tierney J., Baron G., et al. Association between administration of IL-6 antagonists and mortality among patients hospitalized for COVID-19: A meta-analysis. JAMA. 2021;326:499–518. doi: 10.1001/jama.2021.11330. - DOI - PMC - PubMed
    1. The RECOVERY Collaborative Group. Lim W.S., Emberson J.R., Mafham M., Bell J.L., Linsell L., Staplin N., Brightling C., Ustianowski A., Elmahi E., et al. Dexamethasone in hospitalized patients with Covid-19. N. Engl. J. Med. 2021;384:693–704. doi: 10.1056/NEJMoa2021436. - DOI - PMC - PubMed
    1. Vabret N., Britton G.J., Gruber C., Hegde S., Kim J., Kuksin M., Levantovsky R., Malle L., Moreira A., Park M.D., et al. Immunology of COVID-19: current state of the science. Immunity. 2020;52:910–941. doi: 10.1016/j.immuni.2020.05.002. - DOI - PMC - PubMed
    1. McGonagle D., Sharif K., O'Regan A., Bridgewood C. The role of cytokines including interleukin-6 in COVID-19 induced pneumonia and macrophage activation syndrome-like disease. Autoimmun. Rev. 2020;19 doi: 10.1016/j.autrev.2020.102537. - DOI - PMC - PubMed