. 2023 Aug 23;26(4):437.
doi: 10.3892/ol.2023.14024. eCollection 2023 Oct.

Prognostic value of nutritional and inflammatory markers in patients with hepatocellular carcinoma who receive immune checkpoint inhibitors

Affiliations

Prognostic value of nutritional and inflammatory markers in patients with hepatocellular carcinoma who receive immune checkpoint inhibitors

Chunxun Liu et al. Oncol Lett. .

Abstract

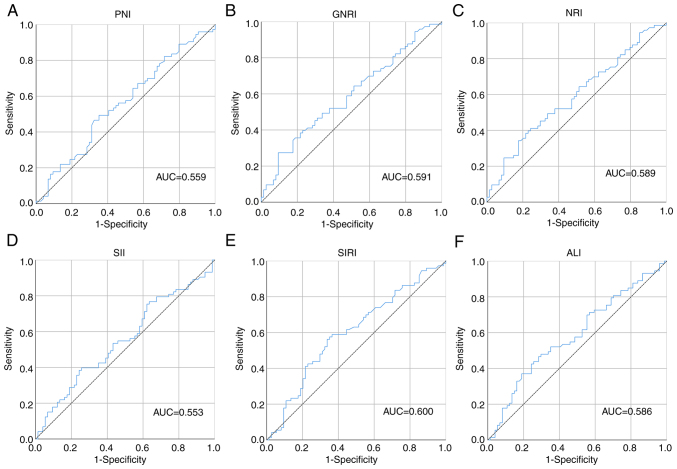
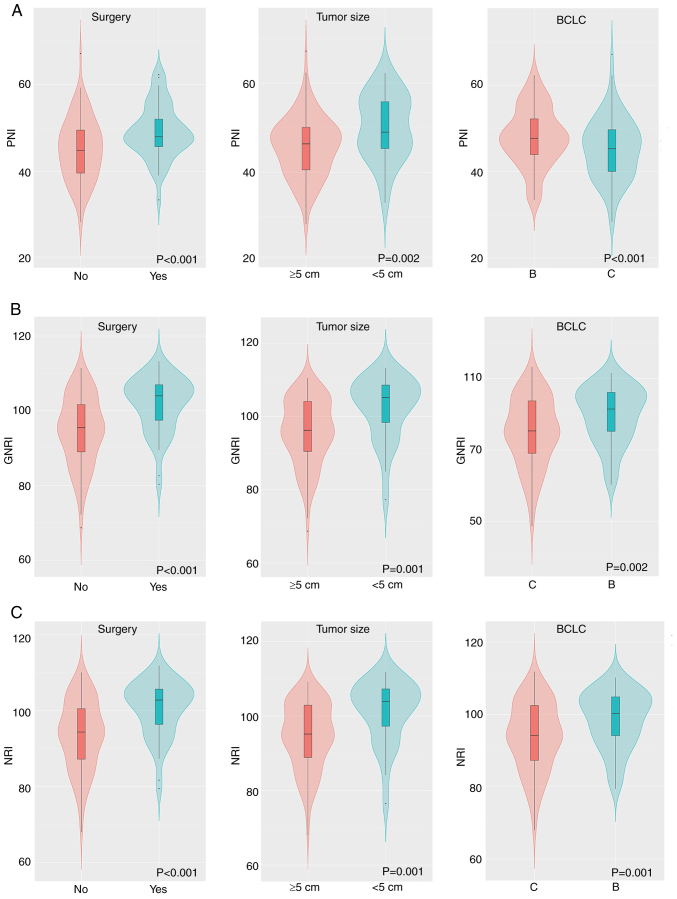
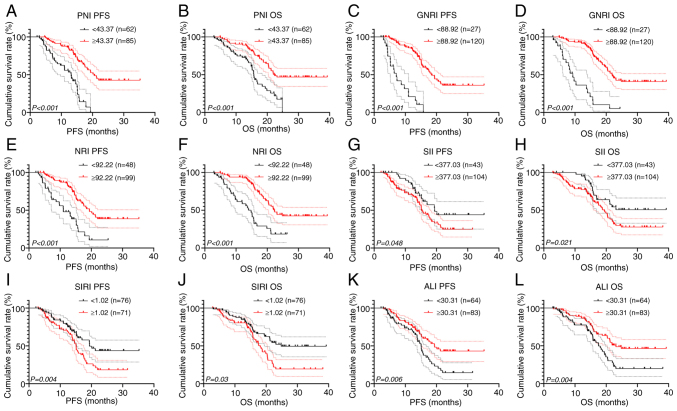
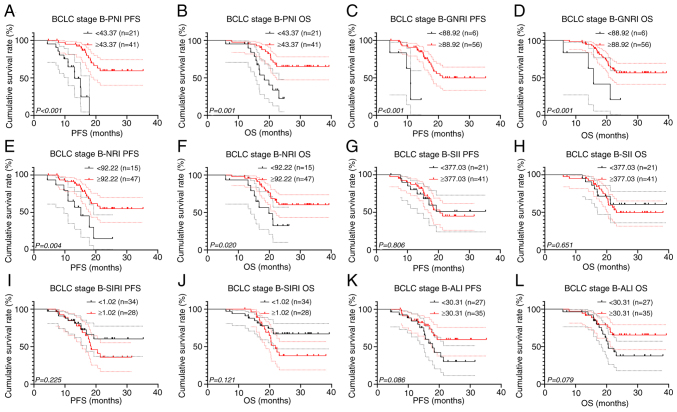
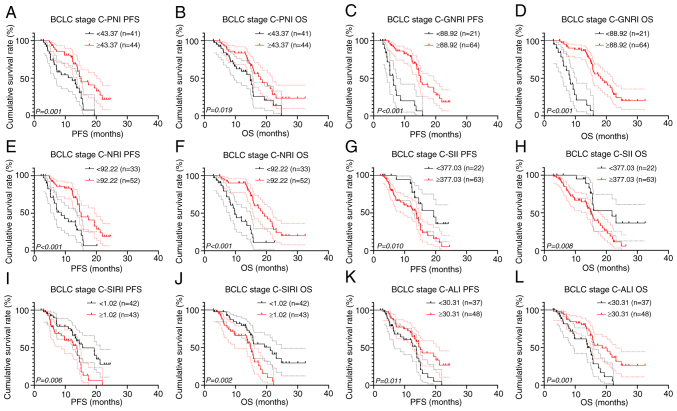
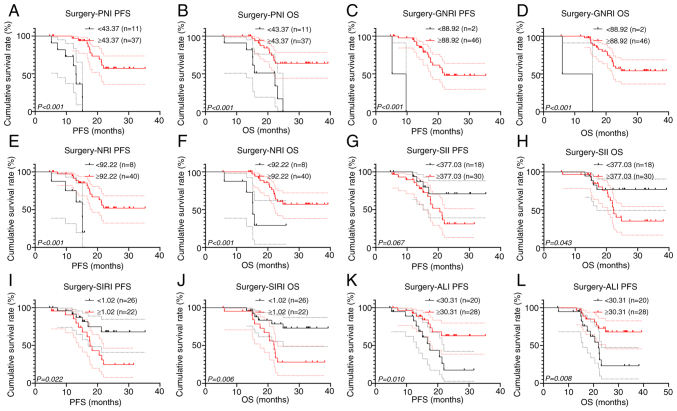
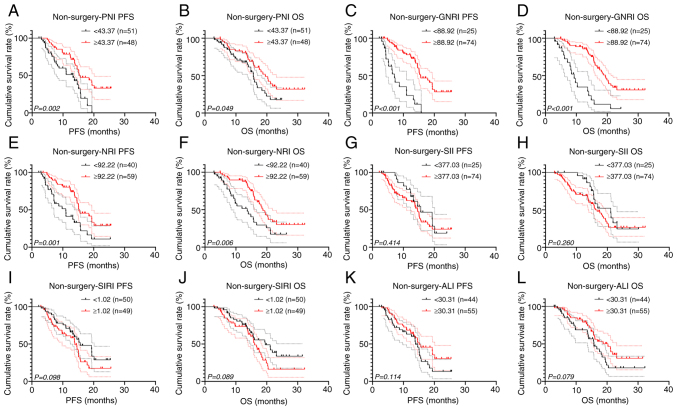
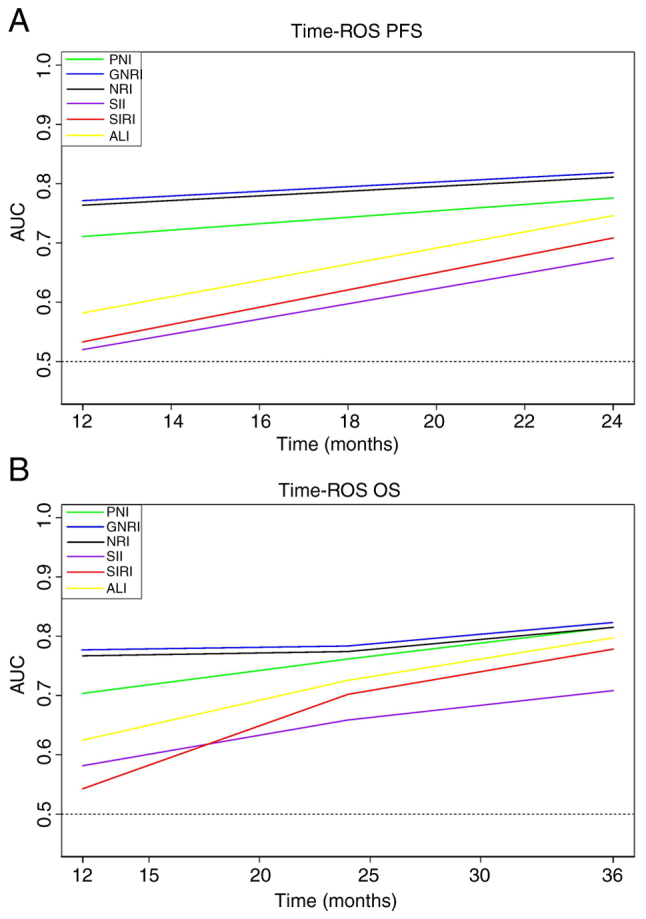
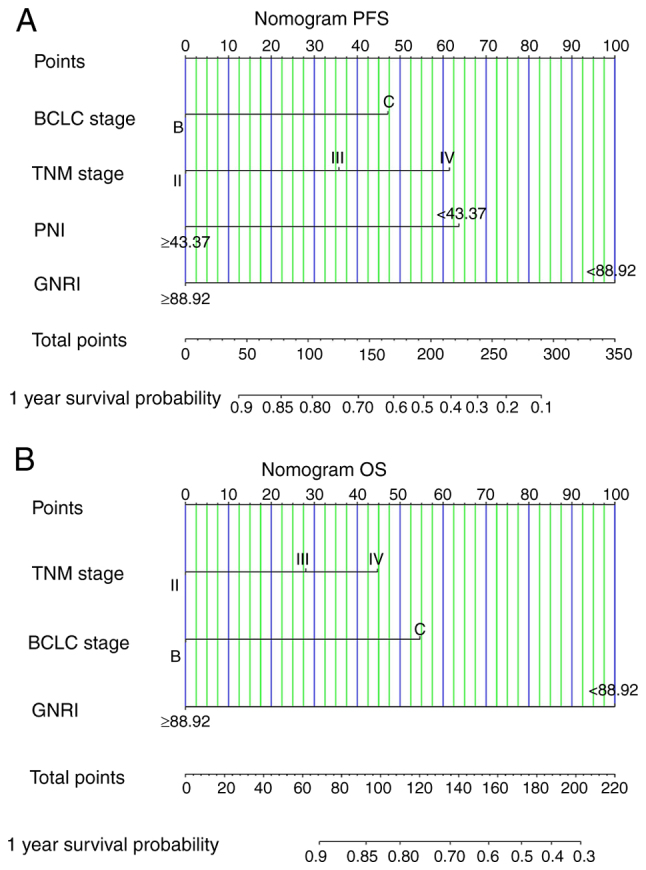
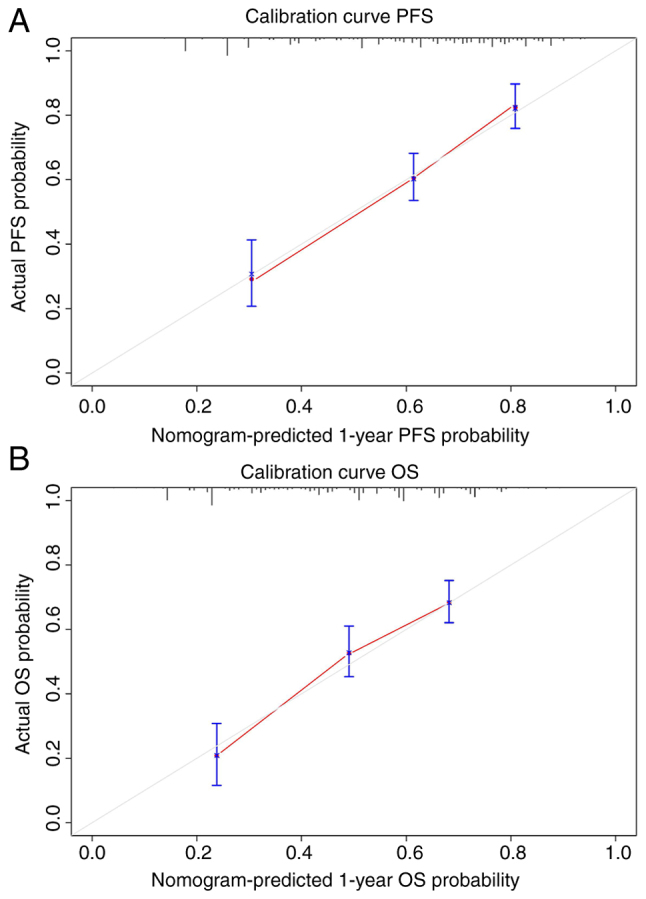
The emergence of immune checkpoint inhibitors (ICIs) has provided a new treatment option for patients with hepatocellular carcinoma (HCC). However, further evaluation is needed for determining biomarkers for the use of ICIs. The present study evaluated the prognostic value of certain nutritional and inflammatory markers in patients with HCC who received ICIs. In the present study, the clinical data of 151 patients with HCC who received ICIs at Harbin Medical University Cancer Hospital from January 2019 to December 2021 were collected. The blood parameters of all patients before treatment were collected to evaluate certain nutritional and inflammatory markers, including the prognostic nutrition index (PNI), nutritional risk index (NRI), geriatric NRI (GNRI), systemic immune-inflammation index (SII), systemic inflammation response index (SIRI) and advanced lung cancer inflammation index (ALI). Patients were grouped using the cut-off value calculated using receiver operating characteristic (ROC) curves, and the relationship between these biomarkers and prognosis was evaluated through survival analysis. Furthermore, the prognostic value of these biomarkers was assessed through multivariate Cox regression analysis and construction of nomograms. Finally, time-ROC curves were plotted to compare the differences in predicting prognosis between the biomarkers. In the preliminary survival analysis, all inflammatory and nutritional markers included in the present study were significantly associated with the prognosis of HCC in patients who received ICIs. Similar results were obtained in a subgroup analysis of patients with different Barcelona Clinic Liver Cancer (BCLC) stages. Multivariate Cox regression analysis demonstrated that GNRI, PNI, BCLC stage and Tumor-Node-Metastasis (TNM) stage were significantly associated with progression-free survival (PFS), whereas GNRI, BCLC stage and TNM stage were also significantly associated with overall survival (OS). Furthermore, the time-ROC curves indicated that nutritional indicators had a higher prognostic value in all indexes, especially GNRI. The C-index (95% confidence interval) of the nomograms for predicting the survival probability of patients who received ICIs were 0.801 (0.746-0.877) and 0.823 (0.761-0.898) for PFS and overall OS, respectively, which also showed high accuracy. In conclusion, the present study demonstrated that PNI, GNRI, NRI, SII, SIRI and ALI were all related to the efficacy of ICIs in HCC and could serve as non-invasive biomarkers for ICI treatment effectiveness. Moreover, compared with inflammatory markers, nutritional markers had greater predictive ability, with GNRI being the biomarker with the best prognostic value.

Keywords: hepatocellular carcinoma; immune checkpoint inhibitors; inflammatory status; nutritional status; prognostic factors.


Conflict of interest statement

The authors declare that they have no competing interests.

Figures

Figure 1.
Figure 1.
ROC curves of the inflammation and nutritional markers. The ROC curves for (A) PNI, (B) GNRI, (C) NRI, (D) SII, (E) SIRI and (F) ALI. AUC, area under the curve; ROC, receiver operating characteristic; PNI, prognostic nutrition index; NRI, nutritional risk index; GNRI, geriatric NRI; SII, systemic immune-inflammation index; SIRI, systemic inflammation response index; ALI, advanced lung cancer inflammation index.
Figure 2.
Figure 2.
Distribution differences in nutritional marker scores. (A) PNI, (B) GNRI and (C) NRI scores in different surgery, tumor size and BCLC stage groups. BCLC, Barcelona Clinic Liver Cancer; PNI, prognostic nutrition index; NRI, nutritional risk index; GNRI, geriatric NRI.
Figure 3.
Figure 3.
Inflammation and nutritional marker-related PFS and OS curves. (A) PFS and (B) OS curves for PNI. (C) PFS and (D) OS curves for GNRI. (E) PFS and (F) OS curves for NRI. (G) PFS and (H) OS curves for SII. (I) PFS and (J) OS curves for SIRI. (K) PFS and (L) OS curves for ALI. PFS, progression-free survival; OS, overall survival; PNI, prognostic nutrition index; NRI, nutritional risk index; GNRI, geriatric NRI; SII, systemic immune-inflammation index; SIRI, systemic inflammation response index; ALI, advanced lung cancer inflammation index.
Figure 4.
Figure 4.
PFS and OS curves for patients with BCLC stage B. (A) PFS and (B) OS curves for PNI. (C) PFS and (D) OS curves for GNRI. (E) PFS and (F) OS curves for NRI. (G) PFS and (H) OS curves for SII. (I) PFS and (J) OS curves for SIRI. (K) PFS and (L) OS curves for ALI. BCLC, Barcelona Clinic Liver Cancer; PFS, progression-free survival; OS, overall survival; PNI, prognostic nutrition index; NRI, nutritional risk index; GNRI, geriatric NRI; SII, systemic immune-inflammation index; SIRI, systemic inflammation response index; ALI, advanced lung cancer inflammation index.
Figure 5.
Figure 5.
PFS and OS curves for patients with BCLC stage C. (A) PFS and (B) OS curves for PNI. (C) PFS and (D) OS curves for GNRI. (E) PFS and (F) OS curves for NRI. (G) PFS and (H) OS curves for SII. (I) PFS and (J) OS curves for SIRI. (K) PFS and (L) OS curves for ALI. BCLC, Barcelona Clinic Liver Cancer; PFS, progression-free survival; OS, overall survival; PNI, prognostic nutrition index; NRI, nutritional risk index; GNRI, geriatric NRI; SII, systemic immune-inflammation index; SIRI, systemic inflammation response index; ALI, advanced lung cancer inflammation index.
Figure 6.
Figure 6.
PFS and OS curves for patients that underwent surgery. (A) PFS and (B) OS curves for PNI. (C) PFS and (D) OS curves for GNRI. (E) PFS and (F) OS curves for NRI. (G) PFS and (H) OS curves for SII. (I) PFS and (J) OS curves for SIRI. (K) PFS and (L) OS curves for ALI. PFS, progression-free survival; OS, overall survival; PNI, prognostic nutrition index; NRI, nutritional risk index; GNRI, geriatric NRI; SII, systemic immune-inflammation index; SIRI, systemic inflammation response index; ALI, advanced lung cancer inflammation index.
Figure 7.
Figure 7.
PFS and OS curves for patients that did not undergo surgery. (A) PFS and (B) OS curves for PNI. (C) PFS and (D) OS curves for GNRI. (E) PFS and (F) OS curves for NRI. (G) PFS and (H) OS curves for SII. (I) PFS and (J) OS curves for SIRI. (K) PFS and (L) OS curves for ALI. PFS, progression-free survival; OS, overall survival; PNI, prognostic nutrition index; NRI, nutritional risk index; GNRI, geriatric NRI; SII, systemic immune-inflammation index; SIRI, systemic inflammation response index; ALI, advanced lung cancer inflammation index.
Figure 8.
Figure 8.
Inflammation and nutritional marker-related time-ROC curves of PFS and OS. Time-ROC curves of (A) PFS and (B) OS. AUC of GNRI was consistently higher than that of other indicators at all time points, indicating its superior predictive value. AUC, area under the curve; ROC, receiver operating characteristic; PFS, progression-free survival; OS, overall survival; PNI, prognostic nutrition index; NRI, nutritional risk index; GNRI, geriatric NRI; SII, systemic immune-inflammation index; SIRI, systemic inflammation response index; ALI, advanced lung cancer inflammation index.
Figure 9.
Figure 9.
Nomograms predicting the probability of PFS and OS. Nomograms predicted probability of (A) PFS and (B) OS. GNRI exhibits highest proportion of scores in both PFS and OS nomograms (even surpassing TNM and BCLC stage), further confirming its superior predictive advantage. PFS, progression-free survival; OS, overall survival; PNI, prognostic nutrition index; GNRI, geriatric nutritional risk index; BCLC, Barcelona Clinic Liver Cancer; TNM, Tumor-Node-Metastasis.
Figure 10.
Figure 10.
Calibration curves of the nomograms. The calibration curves of the (A) PFS and (B) OS nomograms. The high consistency between the predicted survival probabilities and actual survival probabilities in the calibration curves demonstrated the high accuracy of the nomograms for PFS and OS. PFS, progression-free survival; OS, overall survival.

Similar articles

Cited by

References

    1. Wang Y, Deng B. Hepatocellular carcinoma: Molecular mechanism, targeted therapy, and biomarkers. Cancer Metastasis Rev. 2023 Feb 2; doi: 10.1007/s10555-023-10084-4. (Epub ahead of print) - DOI - PubMed
    1. Bray F, Ferlay J, Soerjomataram I, Siegel RL, Torre LA, Jemal A. Global cancer statistics 2018: GLOBOCAN estimates of incidence and mortality worldwide for 36 cancers in 185 countries. CA Cancer J Clin. 2018;68:394–424. doi: 10.3322/caac.21492. - DOI - PubMed
    1. Vogel A, Meyer T, Sapisochin G, Salem R, Saborowski A. Hepatocellular carcinoma. Lancet. 2022;400:1345–1362. doi: 10.1016/S0140-6736(22)01200-4. - DOI - PubMed
    1. Yang JD, Hainaut P, Gores GJ, Amadou A, Plymoth A, Roberts LR. A global view of hepatocellular carcinoma: Trends, risk, prevention and management. Nat Rev Gastroenterol Hepatol. 2019;16:589–604. doi: 10.1038/s41575-019-0186-y. - DOI - PMC - PubMed
    1. Yang C, Zhang H, Zhang L, Zhu AX, Bernards R, Qin W, Wang C. Evolving therapeutic landscape of advanced hepatocellular carcinoma. Nat Rev Gastroenterol Hepatol. 2023;20:203–222. doi: 10.1038/s41575-022-00704-9. - DOI - PubMed