

Centriolar subdistal appendages promote double-strand break repair through homologous recombination
- PMID: 37664992
- PMCID: PMC10561181
- DOI: 10.15252/embr.202256724
Centriolar subdistal appendages promote double-strand break repair through homologous recombination
Abstract
The centrosome is a cytoplasmic organelle with roles in microtubule organization that has also been proposed to act as a hub for cellular signaling. Some centrosomal components are required for full activation of the DNA damage response. However, whether the centrosome regulates specific DNA repair pathways is not known. Here, we show that centrosome presence is required to fully activate recombination, specifically to completely license its initial step, the so-called DNA end resection. Furthermore, we identify a centriolar structure, the subdistal appendages, and a specific factor, CEP170, as the critical centrosomal component involved in the regulation of recombination and resection. Cells lacking centrosomes or depleted for CEP170 are, consequently, hypersensitive to DNA damaging agents. Moreover, low levels of CEP170 in multiple cancer types correlate with an increase of the mutation burden associated with specific mutational signatures and a better prognosis, suggesting that changes in CEP170 can act as a mutation driver but could also be targeted to improve current oncological treatments.
Keywords: CEP170; DNA end resection; centrosomes; homologous recombination; subdistal appendages.
© 2023 The Authors. Published under the terms of the CC BY NC ND 4.0 license.
Conflict of interest statement
The authors declare that they have no conflict of interest.
Figures
- A, B
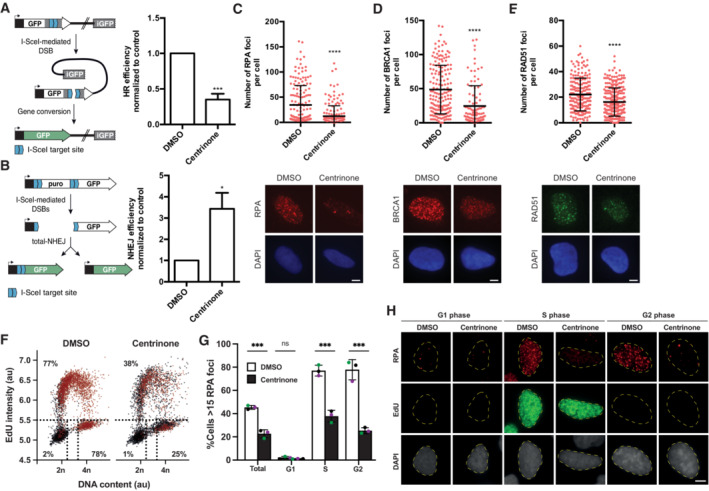
(A) Homologous recombination was assessed in U2OS cells bearing the DR‐GFP reporter in cells lacking centrosomes upon the treatment with centrinone for 7 days or mock‐treated with DMSO. A schematic representation of the reporter and the recombination event that renders the appearance of a functional GFP gene is shown on the left side. Within the BFP‐positive cell population, that is, cells transfected with I‐Sce‐I containing viral particles, the percentage of GFP‐positive cells, that is, cells that have undergone repair by HR after induction with the nuclease I‐SceI, was normalized to the DMSO control taken as 1. (B) Same as (A) but in cells harboring the NHEJ reporter EJ5‐GFP.
- C–E
(C) U2OS cells treated for 7 days with centrinone or DMSO, as indicated, were irradiated with 10 Gy and 1 h later prepared for immunofluorescence using an anti‐RPA antibody as described in the Materials and Methods section. The number of RPA foci per cell for at least 200 cells per condition was quantified automatically using FIJI software and plotted. Error bars represent standard deviations. One representative experiment out of three performed with similar results is shown. (top). Representative images are shown (bottom). Scale bar in white represents 7 μm. (D) Same as (C), but using an antibody against BRCA1. (E) Same as (C), but using an anti‐RAD51 antibody.
- F
U2OS cells were treated 7 days with centrinone or DMSO as control before a 30‐min pulse‐labeled with EdU. Afterward, cells were irradiated (10 Gy) and incubated for 1 h. Click‐it reaction and immunostaining against RPA was carried out as described in the Materials and Methods section. Automated multichannel wide‐field microscopy for quantitative image‐based cytometry (QIBC) was performed. Single‐cell data for more than 5,000 cells is depicted as scatter plots showing DNA content (DAPI intensity) and EdU incorporation during S phase (EdU intensity). Correlatively, RPA foci was measured for each cell. Cells with more than 15 RPA foci are classified as positive (labeled in red). Dotted lines define regions assigned as G1 (bottom left), S (top), and G2/M (bottom right).
- G
Quantification of RPA foci positive cells regarding cell cycle status from three different experiments analyzed as described in (F). Each color datapoints marks a biological replica of a total of three independent repetitions.
- H
Representative images of (F) and (G) are shown. Scale bar in white represents 7 μm.
- A, B
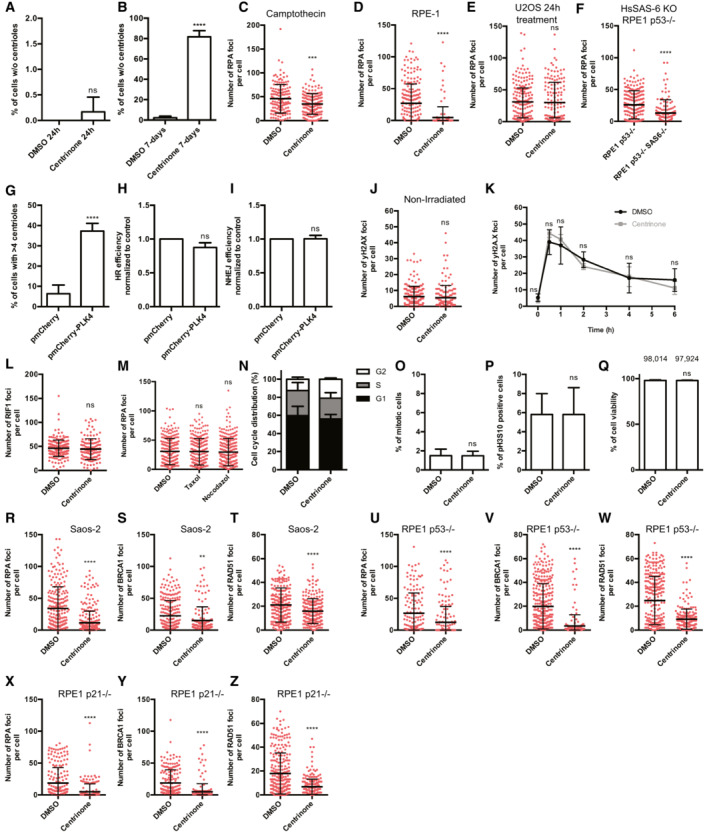
U2OS cells were treated with 125 nM of centrinone, or DMSO as a control, for 24 h (A) or 7 days (B). Then, the presence of centrosomes was immunodetected using an antibody against the centriolar proteins γ‐tubulin and CP110. The percentage of cells without centrioles was counted and plotted.
- C
U2OS cells treated for 7 days with centrinone or DMSO, as indicated, were exposed to Camptothecin 1 μM for 1 h and prepared for immunofluorescence using an anti‐RPA antibody as described in the Materials and Methods section. The number of RPA foci per cell for at least 200 cells per condition was quantified automatically using FIJI software and plotted. One representative experiment out of three performed with similar results is shown.
- D–F
(D) RPE‐1 cells treated for 7 days with centrinone or DMSO, as indicated, were irradiated with 10 Gy and 1 h later prepared for immunofluorescence using an anti‐RPA antibody as described in the Materials and Methods section. The number of RPA foci per cell was calculated as in (C). The number of RPA foci per cell for at least 200 cells per condition was quantified automatically using FIJI software and plotted. One representative biological replicate out of three that rendered similar results is shown. (E) As in (D), but in U2OS cells treated for 24 h with centrinone or DMSO. (F) As in D, but in p53 KO or p53 KO HsSAS‐6 KO RPE‐1 cells.
- G
U2OS cells transfected with a plasmid harboring a mCherry‐tagged PLK4, or an empty vector as a control, were grown for 3 days. Then, the number of centrosomes was immunodetected using an antibody against the centriolar proteins γ‐tubulin and CP110. The number of cells with more than four centrioles was counted and plotted.
- H
Same as Fig 1A, but in cells overexpressing or not PLK4.
- I
Same as Fig 1B, but in cells overexpressing or not PLK4.
- J
U2OS cells treated for 7 days with centrinone or DMSO, as indicated, were prepared for immunofluorescence using an anti‐γH2AX antibody as described in the Materials and Methods section. The number of γH2AX foci per cell for at least 200 cells per condition was quantified automatically using FIJI software and plotted. One representative experiment out of three performed with similar results is shown.
- K
DSB repair kinetic using γH2AX as a proxy. U2OS cells exposed to centrinone or DMSO as a control for 7 days were irradiated (2 Gy). Samples were collected at the indicated time points and γH2AX was immunodetected using a specific antibody as described in the Materials and Methods section. NI indicates a non‐irradiated sample taken just before irradiation. The number of γH2AX foci was scored and plotted.
- L
Same as Fig 1C, but using an antibody against the NHEJ factor RIF1. The number of RIF1 foci per cell for at least 200 cells per condition was quantified automatically using FIJI software and plotted. One representative biological replicate out of three that rendered similar results is shown.
- M
Same as Fig 1C, but in cells treated with Taxol, Nocodazole or DMSO. The number of RPA foci per cell for at least 200 cells per condition was quantified automatically using FIJI software and plotted. One representative biological replica out of three that rendered similar results is shown.
- N
Cell cycle distribution of samples treated for 7 days with centrinone or DMSO, as indicated.
- O, P
(O) U2OS cells treated for 7 days with centrinone or DMSO, as indicated, were fixed and the percentage of mitotic cells was quantified based on DAPI staining. At least 400 cells were quantified per condition. (P) Same as (O) but cells were immunostained with an antibody against phospho‐H3S10. At least 400 cells were scored per condition and the percentage of phospho‐H3S10 positive cells was quantified.
- Q
Cell viability of U2OS cells treated for 7 days with centrinone or DMSO was quantified by Trypan Blue staining and plotted.
- R–T
Same as Fig 1C–E but using Saos‐2 cells.
- U–W
Same as Fig 1C–E but using RPE‐1 p53 KO cells.
- X–Z
Same as Fig 1C–E but using RPE‐1 p21 KO cells.
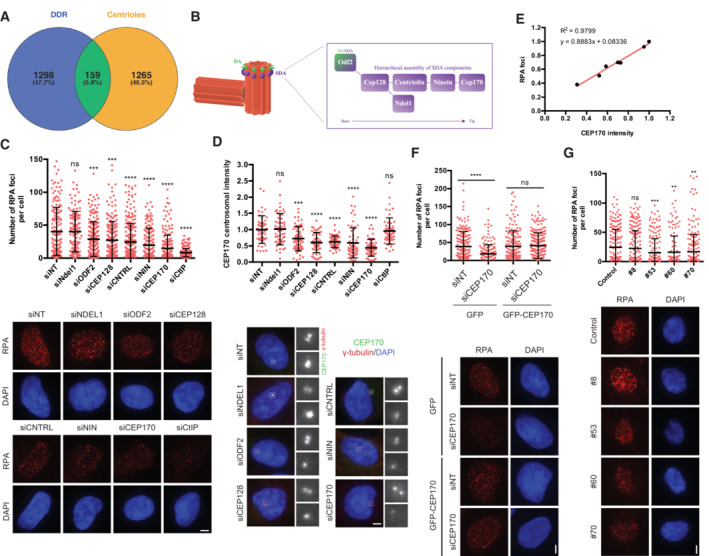
Venn diagram showing the overlapping of genes found both in DDR screenings and in centrosome‐related screening, as described in the main text and the Materials and Methods section.
Schematics of the centrioles showing the Distal and Subdistal appendages (DA and SDA, respectively). The inset shows the molecular architecture of the SDA.
U2OS cells transfected with siRNAs against the indicated proteins or a siRNA control (siNT) and the number of RPA foci per cell for at least 200 cells per condition was quantified automatically using FIJI software and plotted. One representative experiment out of three performed with similar results is shown (top). Representative images are shown (bottom). Scale bar in white represents 7 μm.
The same samples used in (C) were used to immunodetect CEP170 at centrioles. Intensity of individual cells is plotted (top) in cells depleted for the indicated factors. Representative images of each condition are shown on the bottom side. For each condition, insets of centrosomes labeled by either CEP170 or γ‐tubulin are shown.
Linear correlation between RPA foci and CEP170 intensity. For each condition, the average calculated in (C and D) was used in the plot. The R 2, linear correlation and mathematical formula are shown.
U2OS cells harboring a plasmid expressing a siRNA‐resistant GFP‐tagged CEP170 or an empty vector were transfected with siRNAs against CEP170 or a control sequence (siNT). Then, cells were treated with IR and the number of RPA foci per cell for at least 200 cells per condition was quantified automatically using FIJI software and plotted. One representative experiment out of three biological replicates that rendered similar results is shown (top). Representative images are shown (bottom).
Same as (C) but in RPE‐1 cells with partial knock out of CEP170 (top). The number of RPA foci per cell for at least 200 cells per condition was quantified automatically using FIJI software and plotted. One representative experiment out of three biological replicates that rendered similar results is shown. Representative images are shown (bottom).
- A
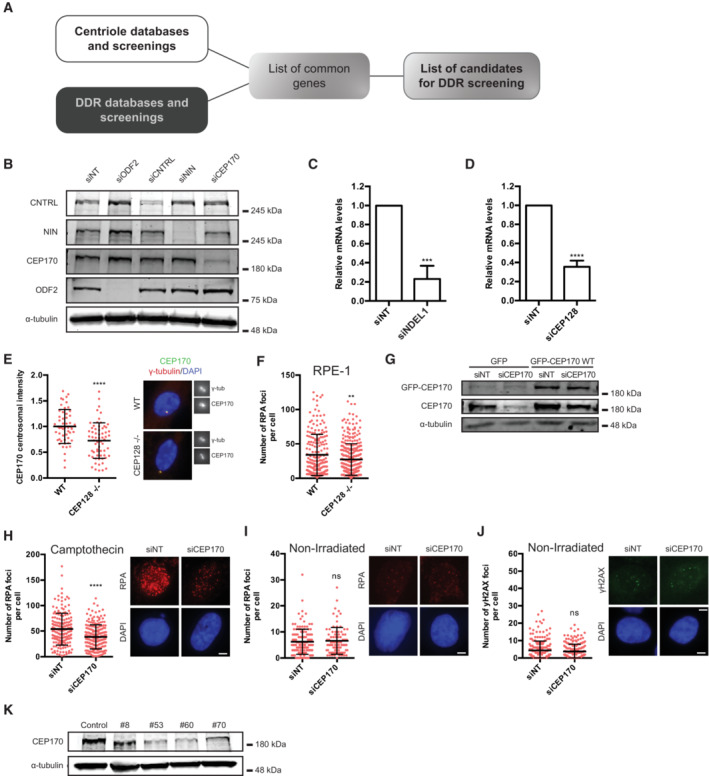
Pipeline for identification of candidate genes involved in the connection between the centrosome and the DDR.
- B
U2OS cells were transfected with the indicated siRNAs and 48 h later, protein samples were prepared, resolved in SDS‐PAGE and blotted with the indicated antibodies.
- C, D
(C) U2OS cells were transfected with the indicated siRNAs. Forty‐eight hours later, total RNA was isolated and the levels of the NDEL1 RNA were calculated using Q‐PCR. The levels were normalized to the sample transfected with a control siRNA, taken as one. The average and standard deviation of three experiments is plotted. Statistical significance was calculated using a Student's t‐test. (D) Same as (C) but in cells transfected with a siRNA against CEP128 and using Q‐PCR primers against the mRNA for this protein.
- E
Same as Fig 2D but for RPE‐1 CEP128 KO or RPE‐1 control cells. The centriolar intensity of CEP170 was measured at least in 50 cells per condition and quantified using FIJI software and plotted. The average and standard deviation of one representative experiment out of three biological replicas that rendered similar results in shown.
- F
Same as Fig 1C but for RPE‐1 CEP128 KO or RPE‐1 control cells. The number of RPA foci per cell for at least 200 cells per condition was quantified automatically using FIJI software and plotted. One representative experiment out of three biological replicas that rendered similar results in shown.
- G
Protein samples were prepared from cells treated as in Fig 2F, resolved in SDS‐PAGE and blotted with anti‐GFP, anti‐CEP170 and anti‐alpha-Tubulin antibodies as indicated. Note that the faint band observed with the anti‐GFP antibody in the first two lanes is unspecific. Also note that CEP170 and GFP‐CEP170 bands could not be resolved with the anti‐CEP170 antibody due to the high size of these proteins.
- H
Same as Fig EV1C but in CEP170 siRNA‐depleted or siRNA control cells.
- I, J
Same as in Fig EV1J but for CEP170 siRNA‐depleted or siRNA control cells stained with anti‐RPA antibodies (I) or γH2AX antibodies (J).
- K
Protein samples were prepared from U2OS CEP170 heterozygous KO clones, resolved in SDS‐PAGE and blotted with the indicated antibodies.
- A
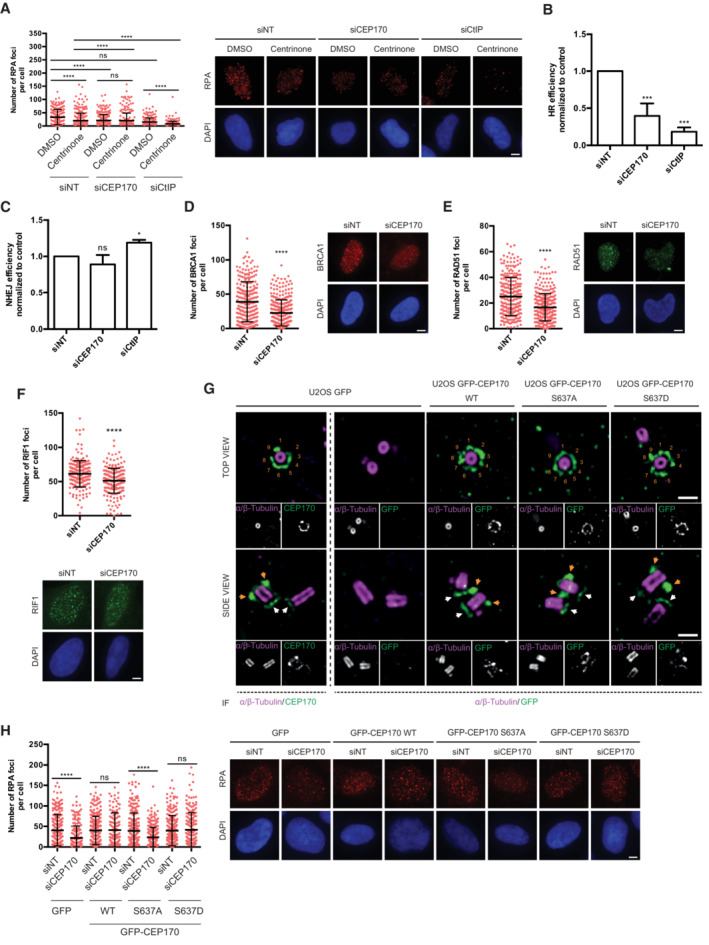
U2OS cells were treated with centrinone or the vehicle DMSO and transfected with the indicated siRNAs. The number of RPA foci per cell for at least 200 cells per condition was quantified automatically using FIJI software and plotted. One representative experiment out of three performed with similar results is shown (left). Representative images are shown (right). Scale bar in white represents 7 μm. Statistical significance was calculated using a two‐way ANOVA.
- B, C
(B) HR was studied as indicated in Fig 1A in cells bearing the DR‐GFP reporter depleted for the indicated factors. (C) Same as (B), but using cells harboring the NHEJ reporter EJ5‐GFP.
- D–F
(D) The number of BRCA1 foci per cell for at least 200 cells transfected with a siRNA against CEP170 or a siRNA control was quantified automatically using FIJI software and plotted. One representative experiment out of three performed with similar results is shown (left). Representative image on the right side. (E) Same as (D) but using an antibody against RAD51 (left). Representative images on the right side. (F) Same as (D) but using an antibody against RIF1 (top). Representative images at the bottom.
- G
Ultrastructure expansion microscopy (U‐ExM) images of U2OS expressing GFP, GFP‐CEP170 WT, GFP‐CEP170 S637A, or GFP‐CEP170 S637D. Images show one representative top view (top panels) and side view (bottom panels). Cells were co‐immunostained against alpha and beta tubulin and endogenous CEP170 or GFP as indicated. Orange numbers label the nine SDAs. Orange arrows point to subdistal appendage localization and white arrows to centriole proximal localization of CEP170 variants. Scale bar 500 nm.
- H
Same as (A) but in cells stably expressing the indicated CEP170 variant tagged with GFP or the control GFP plasmid and transfected with siCEP170 or a control sequence (left). Representative images on the right side. The number of RPA foci per cell for at least 200 cells per condition was quantified automatically using FIJI software and plotted. One representative experiment out of three biological replicates that rendered similar results is shown. Scale bar in white represents 7 µm.
- A
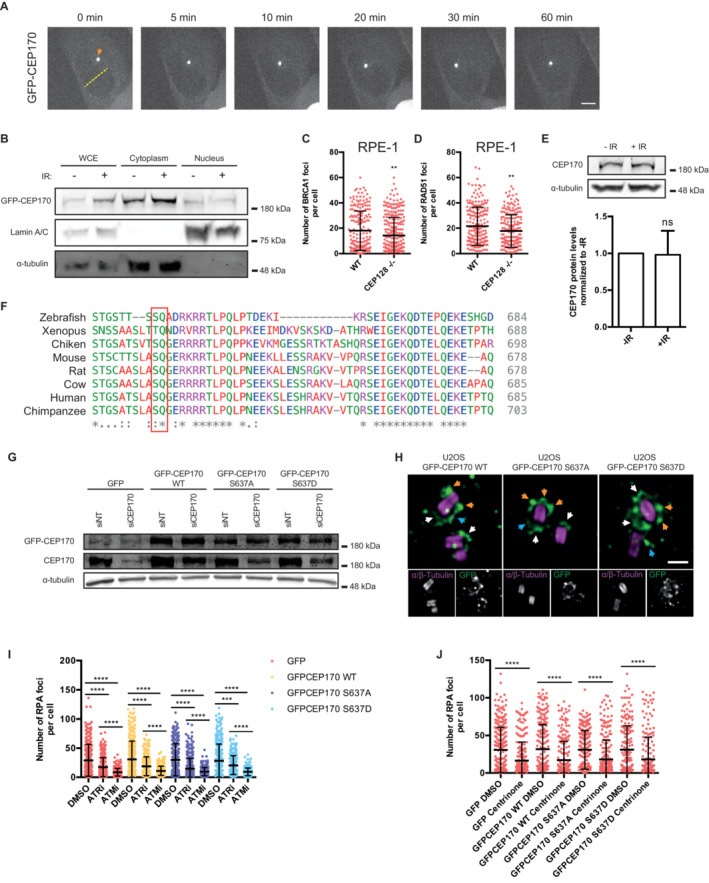
A representative U2OS cell of a total of 20 inspected expressing GFP‐CEP170 and exposed to laser micro irradiation (yellow dashed line). Cells were monitored over 1 h taking images every 5 min. The orange arrow points to centrosomal CEP170 signal. Scale bar 7 μm.
- B
U2OS cells stably expressing a GFP‐CEP170 construct were irradiated (10 Gy, plus sign) or not (minus sign). Protein samples were prepared 1 h later by nuclear fractionation as described in the Materials and Methods section. Samples were resolved in SDS‐PAGE and blotted with the indicated antibodies. Size ladder marker is shown on the right side. A representative image of three independent experiments is shown.
- C, D
Same as Fig 1D and E but for RPE‐1 CEP128 KO or RPE‐1 control cells.
- E
Total levels of endogenous CEP170 were immunodetected in protein samples from U2OS cells irradiated (10 Gy, +IR) or not (−IR) resolved in SDS‐PAGE using an antibody against this protein. Size ladder marker is shown on the right side. A representative image of four independent experiments is shown on the top, and the average and standard deviation of the quantification of the western blots at the bottom.
- F
Alignment of human CEP170 sequence flanking Serine‐637 (red box) with the homologous sequences from the indicated vertebrates.
- G
Protein samples were prepared from cells treated as in Fig 3H, resolved in SDS‐PAGE and blotted with anti‐GFP, anti‐CEP170 and anti‐Tubulin antibodies as indicated. Note that the faint band observed with the anti‐GFP antibody in the first two lanes is unspecific. Also note that CEP170 and GFP‐CEP170 bands could not be resolved with the anti‐CEP170 antibody due to the high size of these proteins.
- H
Same as in Fig 3G but examples of ectopic centrosomal localization of GFP tagged CEP170 WT and mutant versions. Orange arrows point to subdistal appendage localization, white arrows to centriole proximal localization and blue arrows point to ectopic centrosomal localization of CEP170 variants. Scale bar 500 nm.
- I
Same as Fig 3H, but in cells pretreated for 1 h with inhibitors against ATM (ATMi), ATR (ATRi) or DMSO as a control.
- J
Same as Fig 1C but in cells treated with centrinone or DMSO and stably expressing the indicated GFP constructs.
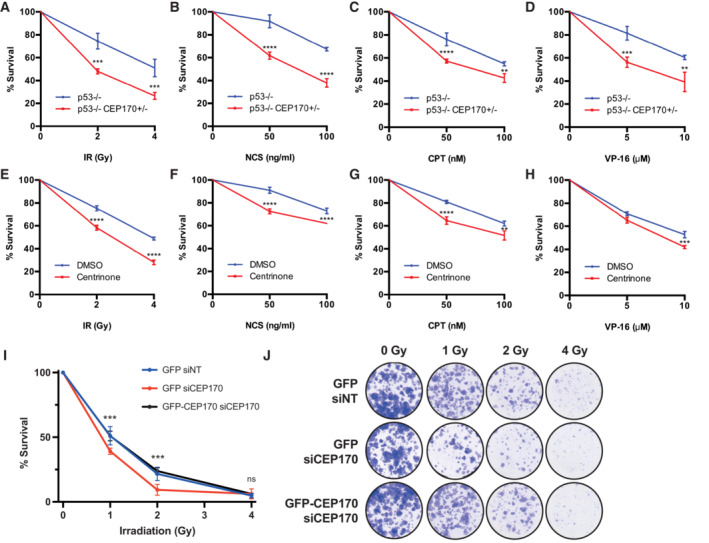
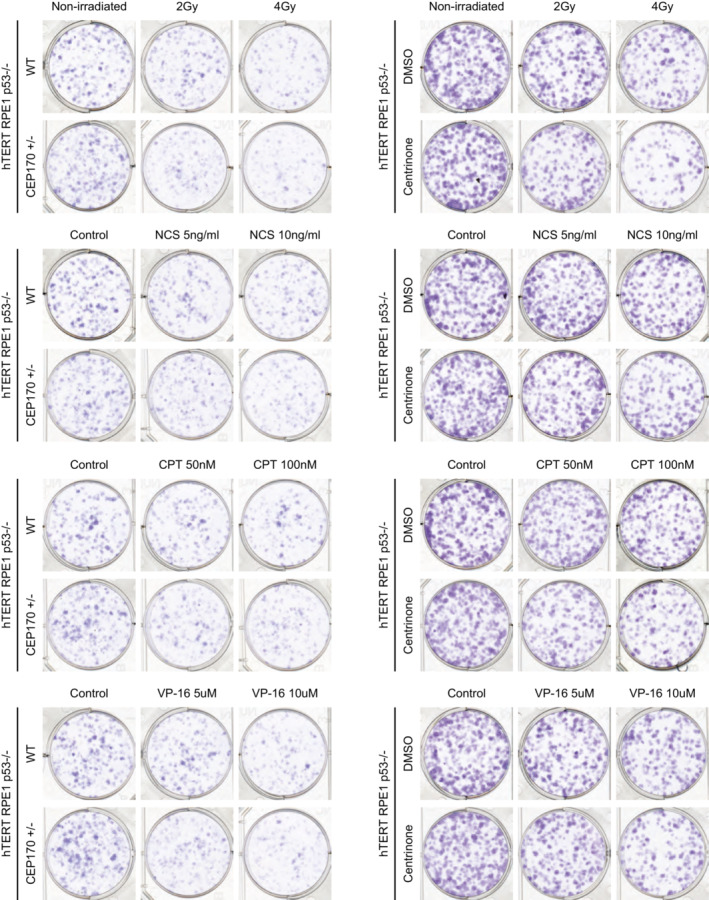
- A–H
(A) RPE‐1 cells knocked out for p53 and heterozygous for CEP170 (red) or a control RPE‐1 p53 KO cells (blue) were exposed to the indicated doses of ionizing radiation. Cell survival was analyzed as described in the Materials and Methods section using a clonogenic assay. Statistical significance was calculated using a two‐way ANOVA. (B) Same as (A) but treating cells with the indicated doses of NCS. (C) Same as (A) but in cells treated with the indicated doses of CPT. (D) Same as (A) but in cells treated with the indicated doses of VP‐16. (E) Same as (A) but in RPE p53−/− cells treated with centrinone (red) or DMSO (blue) for 7 days prior the treatment with ionizing radiation. (F) Same as (E) but in cells treated with the indicated doses of NCS. (G) Same as (E) but in cells treated with the indicated doses of CPT. (H) Same as (E) but in cells treated with the indicated doses of VP‐16.
- I
U2OS cells expressing GFP or GFP‐CEP170 and transfected with siRNA against CEP170 or non‐target sequence were exposed to ionizing irradiation or mock treated. Cell survival was analyzed as in (A).
- J
Representative scanned images of clonogenic assay represented in (I).
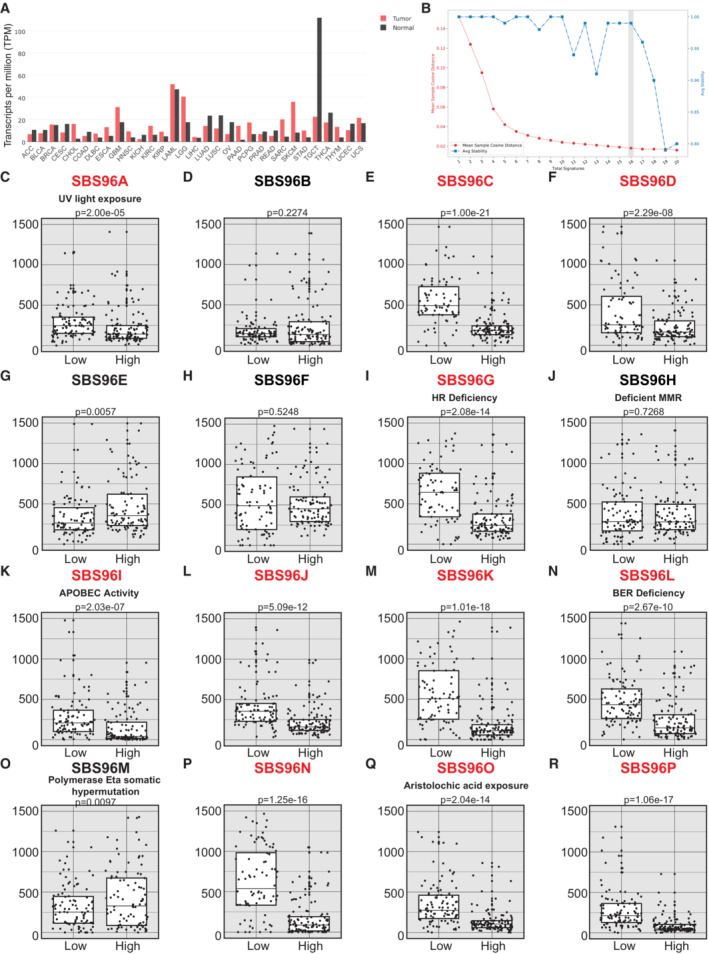
- A
CEP170 levels in tumor samples (red) and the equivalent healthy tissue (black), studied as indicated in the Materials and Methods section. Tumor acronyms are: ACC, adrenocortical carcinoma; BLCA, bladder urothelial carcinoma; BRCA, breast invasive carcinoma; CESC, cervical squamous cell carcinoma and endocervical adenocarcinoma; CHOL, cholangiocarcinoma; COAD, colon adenocarcinoma; DLBC, lymphoid neoplasm diffuse large B‐cell lymphoma; ESCA, esophageal carcinoma; GBM, glioblastoma multiforme; HNSC, head and neck squamous cell carcinoma; KICH, kidney chromophobe; KIRC, kidney renal clear cell carcinoma; KIRP, kidney renal papillary cell carcinoma; LAML, acute myeloid leukemia; LGG, brain lower grade glioma; LHIC, liver hepatocellular carcinoma; LUAD, lung adenocarcinoma; LUSC, lung squamous cell carcinoma; OV, ovarian serous cystadenocarcinoma; PAAD, pancreatic adenocarcinoma; PCPG, pheochromocytoma and paraganglioma; PRAD, prostate adenocarcinoma; READ, rectum adenocarcinoma; SARC, sarcoma; SKCM, skin cutaneous melanoma; STAD, stomach adenocarcinoma; TGCT, testicular germ cell tumors; THCA, thyroid carcinoma; THYM, thymoma; UCEC, uterine corpus endometrial carcinoma; UCS, uterine carcinosarcoma.
- B
Cancer samples from PCAWG database containing mutation and CEP170 expression data were analyzed using SigProfiler to determine the number of significant signatures that could be analyzed in the dataset. The average stability and Mean Sample Cosine were plotted, and the number of optimal signatures was defined as 16. For other details, see the Materials and Methods section.
- C–R
Each of the 16 optimal mutational signatures were analyzed in samples (i.e., independent tumors) at the lower quartile of CEP170 (low) or at the highest (high). The number of mutations in each sample associated to each signature was plotted. The central band represents the median, the lower and upper hinges correspond to the first and third quartiles and the upper and lower whiskers extends from the hinge to the largest value no further than 1.5 inter‐quartile range. Statistical significance was calculated using a Wilcoxon test, and the P‐value is shown on top of the graph. The assigned name of the signature is shown on top. The name of those signatures that show statistically significant changes between samples with high and low expression of CEP170 is written in red. For those signatures associated with a known etiology according to the COSMIC database, this is depicted between the name and the P‐value.
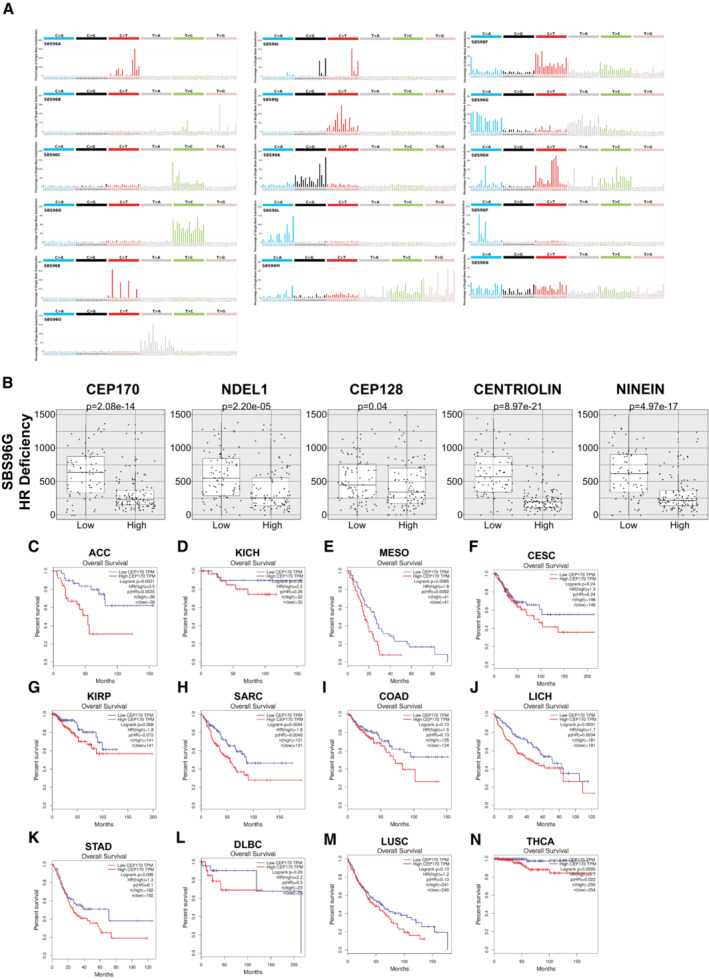
- A
For each signature analyzed, the distribution of single base substitution considering the previous and following base is shown. Each signature presents a unique profile of mutations.
- B
Same as in Fig 5I but for samples at the lower quartile (low) or at the highest (high) of the indicated centriolar subdistal appendages proteins. The central band represents the median, the lower and upper hinges correspond to the first and third quartiles and the upper and lower whiskers extends from the hinge to the largest value no further than 1.5 inter‐quartile range.
- C–N
Survival data in different cancer types with different CEP170 expressions were collected from the web‐based tool GEPIA. Samples were split in two categories, the ones with an expression above the median (high; red lines) or below the median (low; blue lines). The number of individuals for each category is indicated in the top right corner of each chart. Overall survival of each category in each cancer type were plotted in Kaplan‐Meyer graphs. Statistical significance was calculated using a Log‐rank (Mantel–Cox) test and the P‐values are included. Tumor types: (C) ACC, adrenocortical carcinoma. (D) KICH, kidney chromophobe. (E) MESO, mesothelioma. (F) CESC, cervical squamous cell carcinoma and endocervical adenocarcinoma. (G) KIRP, kidney renal papillary cell carcinoma. (H) SARC, sarcoma. (I) COAD, colon adenocarcinoma. (J) LICH, liver hepatocellular carcinoma. (K) STAD, stomach adenocarcinoma. (L) DLBC, lymphoid neoplasm diffuse large B‐cell lymphoma. (M) LUSC, lung squamous cell carcinoma. (N) THCA, thyroid carcinoma.
References
-
- Alderton GK, Galbiati L, Griffith E, Surinya KH, Neitzel H, Jackson AP, Jeggo PA, O'Driscoll M (2006) Regulation of mitotic entry by microcephalin and its overlap with ATR signalling. Nat Cell Biol 8: 725–733 - PubMed
-
- Al‐Dosari MS, Shaheen R, Colak D, Alkuraya FS (2010) Novel CENPJ mutation causes Seckel syndrome. J Med Genet 47: 411–414 - PubMed
-
- Andersen JS, Wilkinson CJ, Mayor T, Mortensen P, Nigg EA, Mann M (2003) Proteomic characterization of the human centrosome by protein correlation profiling. Nature 426: 570–574 - PubMed
Publication types
MeSH terms
Substances
Grants and funding
- P18-RT-1204/Consejeria de Transformacion Economica, Industria, Conocimineto y Universidades
- ALTF 1039-2021/European Molecular Biology Organization (EMBO)
- Fundación Científica Asociación Española Contra el Cáncer (AECC)
- PID2019-104195G/MEC | Agencia Estatal de Investigación (AEI)
- Ministerio de Educación y Formación Profesional (MEFP)
LinkOut - more resources
Full Text Sources
Research Materials
