. 2023 Dec;27(23):3744-3759.
doi: 10.1111/jcmm.17943. Epub 2023 Sep 4.

Glucose dysregulation promotes oncogenesis in human bladder cancer by regulating autophagy and YAP1/TAZ expression

Affiliations

Glucose dysregulation promotes oncogenesis in human bladder cancer by regulating autophagy and YAP1/TAZ expression

Shi Li et al. J Cell Mol Med. 2023 Dec.

Abstract

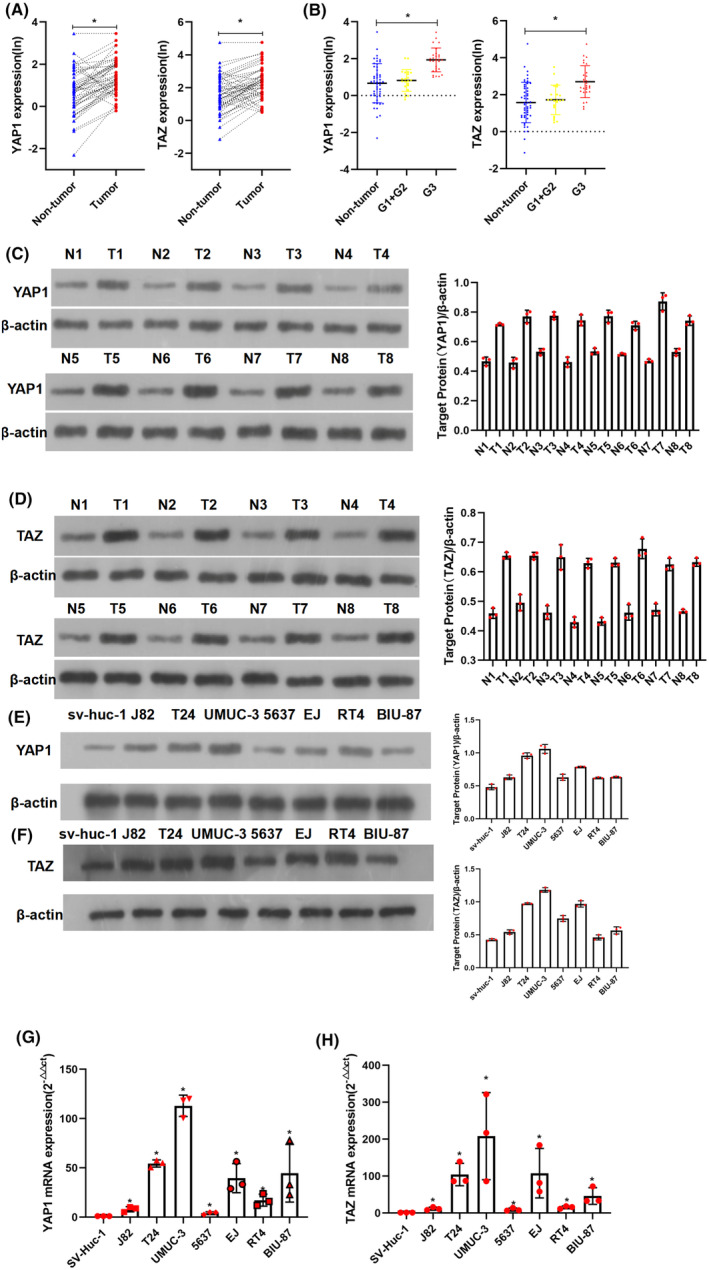
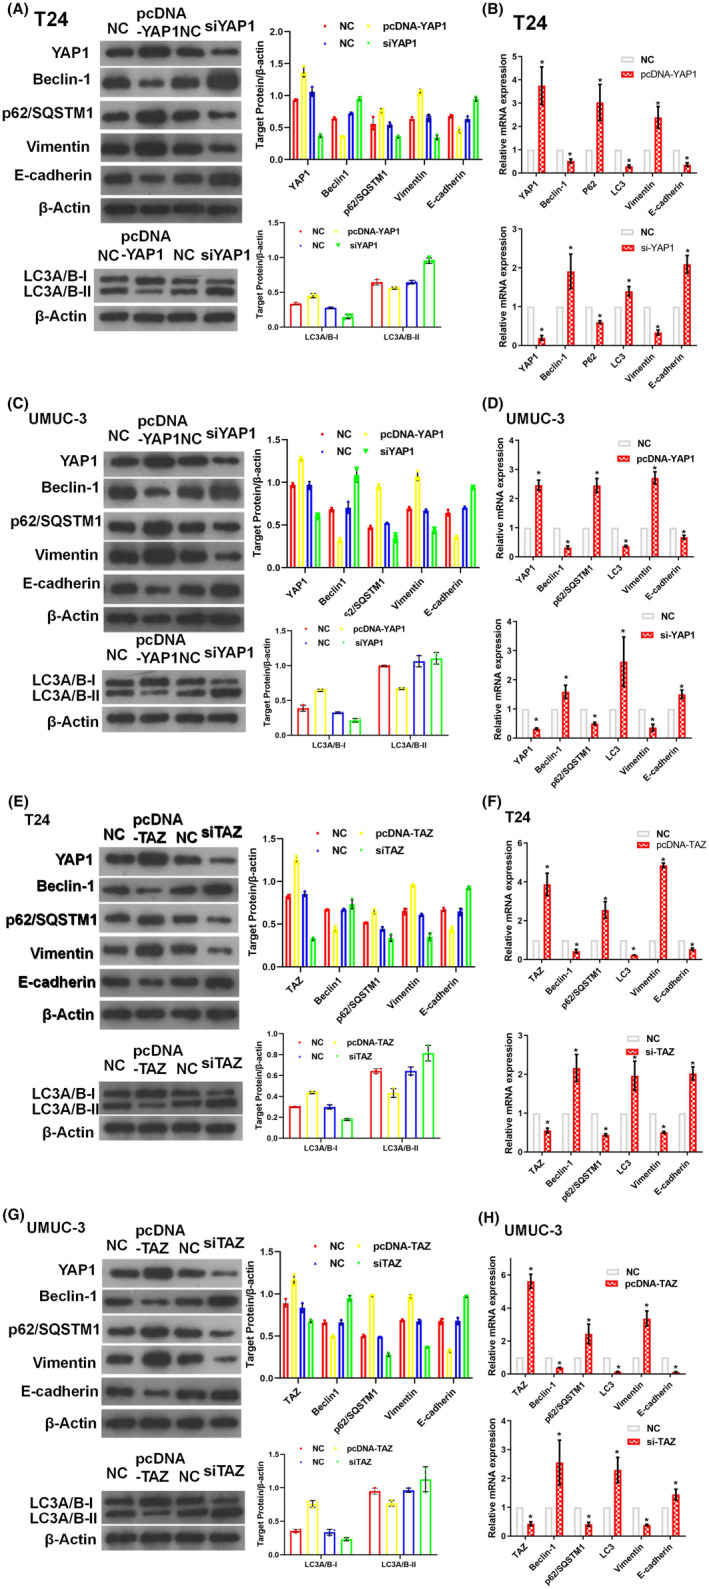
Glucose dysregulation is strongly correlated with cancer development, and cancer is prevalent in patients with Type 2 diabetes (T2D). We aimed to elucidate the mechanism underlying autophagy in response to glucose dysregulation in human bladder cancer (BC). 220 BC patients were included in this retrospective study. The expression of YAP1, TAZ and AMPK, EMT-associated markers, and autophagy marker proteins was analysed by immunohistochemistry, western blotting, and quantitative real-time PCR (qPCR). Further, T24 and UMUC-3 BC cells were cultured in media with different glucose concentrations, and the expression of YAP1, TAZ, AMPK and EMT-associated markers, and autophagy marker proteins was analysed by western blotting and qPCR. Autophagy was observed by immunofluorescence and electron microscopy. BC cell viability was tested using MTT assays. A xenograft nude mouse model of diabetes was used to evaluate tumour growth, metastasis and survival. A poorer pathologic grade and tumour-node-metastasis stage were observed in patients with BC with comorbid T2D than in others with BC. YAP1 and TAZ were upregulated in BC samples from patients with T2D. Mechanistically, high glucose (HG) promoted BC progression both in vitro and in vivo and inhibited autophagy. Specifically, various autophagy marker proteins and AMPK were negatively regulated under HG conditions and correlated with YAP1 and TAZ expression. These results demonstrate that HG inhibits autophagy and promotes cancer development in BC. YAP1/TAZ/AMPK signalling plays a crucial role in regulating glucose dysregulation during autophagy. Targeting these effectors exhibits therapeutic significance and can serve as prognostic markers in BC patients with T2D.

Keywords: AMPK; YAP1/TAZ; autophagy; bladder cancer; high glucose.


Conflict of interest statement

The authors declare that they have no competing interests.

Figures

FIGURE 1
FIGURE 1
High expression of YAP1 and TAZ in bladder cancer (BC) patients. (A) The transcript levels of YAP and TAZ were assessed in tumour tissues and surrounding normal tissues using qRT‐PCR (n = 50 BC cases). (B) YAP1 and TAZ expression were positively associated with pathologic grade in BC samples. The transcript levels of YAP and TAZ were elevated with progression of the pathological grade. (C, D) In eight fresh BC tissues, YAP1 and TAZ expression were higher in tumour tissues than in the surrounding normal tissues based on western blotting (WB) analysis. (E, G) qRT‐PCR and WB analyses confirmed upregulated YAP1 levels in seven BC cell lines compared with those in the normal human uroepithelial cell line (SV‐HUC‐1). (F, H) qRT‐PCR and WB analyses confirmed that higher TAZ levels were observed in seven established BC cell lines compared with those in SV‐HUC‐1 cells. A quantitative analysis chart of WB was placed next to all corresponding WB images. * = p < 0.05. N: surrounding normal tissue; T: tumour tissue. ‘T’ and ‘N’ with the same number label represent paired tissues from one patient. We obtained normal surrounding tissues from cancer patients who had undergone cystectomy. We removed the bladder mucosa from a site more than 10 cm away from the tumour tissues to obtain normal surrounding tissues. All experiments were performed at least thrice.
FIGURE 2
FIGURE 2
Higher YAP1 and TAZ levels were positively correlated with poor TNM stage and pathological grade in BC tissues. (A) The expression of YAP1, TAZ, vimentin, E‐cadherin, p62/SQSTM1 and Beclin1 expressions was determined in BC specimens of different pathological grades and normal samples using immunohistochemistry (IHC). IHC was photographed at 40× and 200×, respectively. The expression of YAP1, TAZ, vimentin and p62/SQSTM1 was the highest in HGUC BC specimens and lowest in LGUC BC specimens. The expression of E‐cadherin and beclin1 was lower in HGUC samples and higher in LGUC BC samples. (B) Based on 220 BC samples, YAP1 and TAZ scores were positively associated with pathological grade in BC tissues using IHC. (C) YAP1 and TAZ scores were positively associated with the T stage in BC tissues using IHC. (D) Higher expression of YAP1 and TAZ was observed in BC tissues with higher T stage. N: normal surrounding tissues; HGUC: high‐grade urothelial carcinoma; LGUC: low‐grade urothelial carcinoma; NC: normal control. All experiments were performed at least thrice. (*p < 0.05).
FIGURE 3
FIGURE 3
Dysregulation of glucose altered the expression of YAP1/TAZ, autophagy markers, and epithelial–mesenchymal transition (EMT) in BC cell lines. Elevated expression of YAP1, TAZ, p62/SQSTM1, and vimentin; decreased expression of pYAP1, Beclin‐1, E‐cadherin; and reduced LC3A/B‐II:LC3A/B‐I ratio were observed under high‐glucose (HG: 25 mM) conditions using western blotting (WB) (A) and qPCR (B) tests in T24. However, the reverse trend was observed under low‐glucose (LG: 2.8 mM) conditions. Increased expression of YAP1, TAZ, p62/SQSTM1 and vimentin, decreased expression of pYAP1, Beclin‐1, E‐cadherin and reduced LC3A/B‐II:LC3A/B‐I ratio were observed under HG conditions using WB (C) and qPCR (D) tests in the UMUC‐3 cell line. The reverse trend was observed under LG conditions. BC cells were cultured in HG or LG medium for 72 h before analyses. T24 and UMUC‐3 cells were cultured in HG medium (25 mM) for the indicated intervals (12, 24, 48 and 72 h). Elevated expression of YAP1, TAZ, p62/SQSTM1, vimentin; decreased expression of pYAP1, Beclin‐1, and E‐cadherin; and reduced LC3A/B‐II/LC3A/B‐I ratio with time were observed using WB and qPCR test in T24 (E, F) and UMUC‐3 (G, H). All experiments were performed at least thrice (*p < 0.05).
FIGURE 4
FIGURE 4
HG levels promoted BC development in vitro and in vivo. (A, B) Electron microscopy analysis indicated that the number of autophagosomes suppressed under HG (25 mM) and elevated under LG (2.8 mM) in T24 (A) and UMUC‐3 (B) cell lines. Original EM images are provided in Supplementary EM images. (C, D) Immunofluorescence analysis detected autophagic flux using a microscope in T24 (C) and UMUC‐3 (D) cell lines. It indicated a considerable change under HG or LG conditions compared with that in the NC groups. Cells were cultured in HG or LG medium for 72 h. Higher autophagy flux and lower GFP‐RFP ratio were observed in LG conditions than in NC conditions, and lower autophagy flux and higher GFP‐RFP ratio were observed in HG conditions than in the NC conditions. Specifically, the quantification of autophagic flux was performed using ImageJ 1.44p software (Wayne Rasband, National Institutes of Health, Bethesda, Maryland). After microscopy imaging, the yellow spots that appeared following the merging of red and green fluorescence represent autophagosomes, while the red spots correspond to autolysosomes. The strength of autophagic flux was quantified by counting the spots of different colours using ImageJ 1.44p. (E–G) HG promoted BC proliferation in vivo. After establishment of xenograft nude mouse models of diabetes were built using streptozotocin, T24 BC cells were subcutaneously injected into the right lower inguinal mammary fat pads at a density of 5 × 106 cells per mouse. The volumes of the xenotransplanted tumours was measured at 25 days post‐implantation (n = 6). Both weights and volumes of tumours were estimated in the two groups over 25 days. (H) Kaplan–Meier survival curves of the mice in the two different blood glucose level groups. (J) Cell viability was suppressed by LG levels and promoted by HG levels as indicated by MTT assays in T24 and UMUC‐3 cell lines. (I) YAP1, TAZ, vimentin, and p62/SQSTM1 protein expression was elevated, Beclin‐1 and E‐cadherin protein expression was decreased in mice with hyperglycemia (blood glucose levels at ≥30 mmol/L). Representative images of the IHC staining are shown for the two groups. IHC was photographed at 40× and 200×. (K) Cell viability was suppressed after the knockdown of YAP1 or TAZ on MTT assays in T24 and UMUC‐3 cell lines. siRNA was transfected into cells in logarithmic growth phase with Lipofectamine 2000 and further cultivated for 48 h. After digestion of stable silenced cells, they were re‐cultured for MTT assays. All in vitro experiments were performed at least thrice (*p < 0.05).
FIGURE 5
FIGURE 5
YAP1 and TAZ regulate autophagy markers and facilitate EMT in BC cell lines. Overexpression of YAP1 suppressed Beclin‐1 and E‐cadherin expression, reduced the LC3A/B‐II:LC3A/B‐I ratio, and promoted p62/SQSTM1 and vimentin expression. Accordingly, knockdown of YAP1 could promote Beclin‐1 and E‐cadherin, increase LC3A/B‐II:LC3A/B‐I ratio, and suppress p62/SQSTM1 and vimentin expression using western blotting (WB) (A, C) and qPCR (B, D) in T24 (A, B) and UMCU‐3 (C, D). TAZ overexpression suppressed Beclin‐1 and E‐cadherin, reduced the LC3A/B‐II/LC3A/B‐I ratio, and promoted p62/SQSTM1 and vimentin expression. Accordingly, knockdown of YAP1 could promote Beclin‐1 and E‐cadherin, increase LC3A/B‐II/LC3A/B‐I ratio and suppress p62/SQSTM1 and Vimentin expression using WB (E, G) and qPCR (F, H) in T24 (E, F) and UMCU‐3 (G, H) cell lines. siRNA or pcDNA was transfected into cells in logarithmic growth phase with Lipofectamine 2000 and further cultivated for another 48 h. All experiments were performed at least thrice (*p < 0.05).
FIGURE 6
FIGURE 6
HG regulates AMPK expression, and AMPK can regulate YAP/TAZ expression. AMPK was inhibited under HG (25 mM) conditions and enhanced by LG (2.8 mM) levels. Conversely, pAMPK was promoted by HG and suppressed by LG using western blotting (WB) (A, C) and qPCR (B, D) at T24 (A, B) and UMUC‐3 (C, D) cell lines. The expression of AMPK decreased and pAMPK increased with time under HG (25 mM) conditions using WB (E, G) and qPCR (F, H) in T24 (E, F) and UMUC‐3 (G, H) cell lines. AMPK activators (e.g. metformin and 5‐aminoimidazole‐4‐carboxamide ribonucleotide) inhibit and promote YAP1 and pYAP1 expression. Conversely, AMPK inhibitors (e.g. dorsomorphin [compound C]) promoted YAP1 and suppressed YAP1 phosphorylation using WB (I, K) and qPCR (J, L) in T24 (I, J) and UMUC‐3 (K, L) cell lines. Using WB (M, O) and qPCR (N, P), AMPK activators inhibited TAZ expression, and AMPK inhibitors promoted TAZ expression in T24 (M, N) and UMUC‐3 (O, P) cell lines. All treated cells were cultured for additional 48 h after treatment. All experiments were performed at least thrice (*p < 0.05).
FIGURE 7
FIGURE 7
Dysregulation of glucose promotes oncogenesis by regulating the functions of autophagy in BC. (A) Dysregulation of glucose can mediate AMPK activity and phosphorylation of AMPK in BC cells. (B) AMPK can regulate YAP1/TAZ expression. (C) By modulating YAP1, TAZ and AMPK activities, glucose dysregulation can modulate autophagy in BC. (D) Autophagy is associated with BC oncogenic behaviours such as EMT, proliferation, and metastasis. (E) The key effectors of the Hippo pathway, YAP1 and TAZ, can regulate BC oncogenic behaviours, such as EMT, proliferation, and metastasis. (F) The mechanistic network underlying the regulation of malignant progression in BC by the Hippo pathway remains incomplete and requires further elucidation. This will be the focus of our future studies. P: phosphorylation.

Similar articles

Cited by

References

    1. Siegel RL, Miller KD, Fuchs HE, Jemal A. Cancer statistics, 2021. CA Cancer J Clin. 2021;71(1):7‐33. doi:10.3322/caac.21654 - DOI - PubMed
    1. Witjes JA, Bruins HM, Cathomas R, et al. European Association of Urology guidelines on muscle‐invasive and metastatic bladder cancer: summary of the 2020 guidelines. Eur Urol. 2021;79(1):82‐104. doi:10.1016/j.eururo.2020.03.055 - DOI - PubMed
    1. Bose S, Zhang C, Le A. Glucose metabolism in cancer: the Warburg effect and beyond. In: Le A, ed. The Heterogeneity of Cancer Metabolism. Springer International Publishing; 2021:3‐15. - PMC - PubMed
    1. Hoxhaj G, Manning BD. The PI3K‐AKT network at the interface of oncogenic signalling and cancer metabolism. Nat Rev Cancer. 2020;20(2):74‐88. doi:10.1038/s41568-019-0216-7 - DOI - PMC - PubMed
    1. Reinfeld BI, Madden MZ, Wolf MM, et al. Cell‐programmed nutrient partitioning in the tumour microenvironment. Nature. 2021;593(7858):282‐288. doi:10.1038/s41586-021-03442-1 - DOI - PMC - PubMed

Publication types

Substances