. 2023 Nov 15;109(5):618-634.
doi: 10.1093/biolre/ioad104.

Listeria monocytogenes infection in pregnant macaques alters the maternal gut microbiome†

Affiliations

Listeria monocytogenes infection in pregnant macaques alters the maternal gut microbiome†

Anna Marie Hugon et al. Biol Reprod. .

Abstract

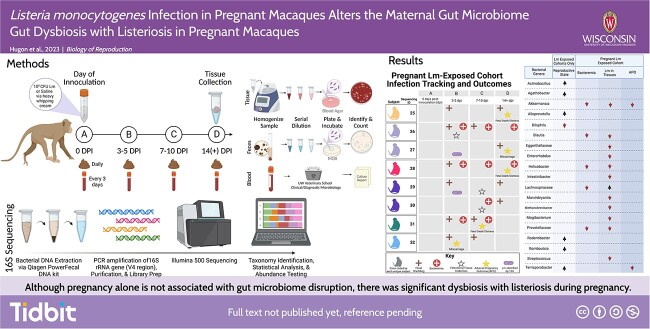
Objectives: The bacterium Listeria monocytogenes (Lm) is associated with adverse pregnancy outcomes. Infection occurs through consumption of contaminated food that is disseminated to the maternal-fetal interface. The influence on the gastrointestinal microbiome during Lm infection remains unexplored in pregnancy. The objective of this study was to determine the impact of listeriosis on the gut microbiota of pregnant macaques.

Methods: A non-human primate model of listeriosis in pregnancy has been previously described. Both pregnant and non-pregnant cynomolgus macaques were inoculated with Lm and bacteremia and fecal shedding were monitored for 14 days. Non-pregnant animal tissues were collected at necropsy to determine bacterial burden, and fecal samples from both pregnant and non-pregnant animals were evaluated by 16S rRNA next-generation sequencing.

Results: Unlike pregnant macaques, non-pregnant macaques did not exhibit bacteremia, fecal shedding, or tissue colonization by Lm. Dispersion of Lm during pregnancy was associated with a significant decrease in alpha diversity of the host gut microbiome, compared to non-pregnant counterparts. The combined effects of pregnancy and listeriosis were associated with a significant loss in microbial richness, although there were increases in some genera and decreases in others.

Conclusions: Although pregnancy alone is not associated with gut microbiome disruption, we observed dysbiosis with listeriosis during pregnancy. The macaque model may provide an understanding of the roles that pregnancy and the gut microbiota play in the ability of Lm to establish intestinal infection and disseminate throughout the host, thereby contributing to adverse pregnancy outcomes and risk to the developing fetus.

Keywords: bacterial infection; listeriosis; microbiome; non-pregnant; pregnancy; primate.


Conflict of interest statement

The authors have declared that no conflict of interest exists.

Figures

Graphical Abstract
Graphical Abstract
Figure 1
Figure 1
Clinical characteristics of experimental cohorts. (a) A violin plot depicting the average change in weight between timepoint A and D. Each cohort is color coded; these colors are carried through subsequent figures. The mean weight change is indicated by the horizontal line in each plot and standard error of the mean (SEM) denoted by bars. (b) A graph with the average diarrhea severity score of each cohort on the y-axis and the timepoint (A–D) during the experiment on the x-axis. Average values are depicted by circles and SEM denoted by bars. Each cohort is color coded. A = pre-inoculation, B = 3–5 days following inoculation, C = 7–10 following inoculation, and D = tissue collection and conclusion of the experiment. (c) Summary table of fecal shedding of Lm, bacteremia, and occurrence of pregnancy outcomes of each subject in the pregnant Lm cohort. Each subject is color coded. Some subjects were utilized in the experimental protocol twice and share a color code. The key at the bottom explains each symbol. The table depicts fecal and bacterial shedding of Lm throughout timepoints A–D, from left to right. The outcome of each pregnancy is denoted by a hollow star indicating tissue collection and a filled star indicating APO. Furthermore, those subjects with Lm identified by sequencing are indicated by a bacterial rod. (d) Diarrhea severity score of each subject within Cohort 4 plotted against the experimental timepoint (A–D). Each subject is color coded. The dashed lines indicate the same subject utilized a second time within the experimental protocol A = pre-inoculation, B = 3–5 days following inoculation, C = 7–10 following inoculation, and D = tissue collection and conclusion of the experiment.
Figure 2
Figure 2
Taxonomy bar plot of 25 most abundant OTUs in fecal samples from experimental cohorts. Each cohort is indicated along the x-axis, and the samples from individual animals as described in Figure 1 are presented chronologically (e.g., samples 1A, 1B, 1C, and 1D are the first presented, followed by 2A, 2B etc.). The top 25 most abundant OTUs are listed at the right in order of highest abundance and classified by the highest level of identification. Each cohort is separated by black bars.
Figure 3
Figure 3
Alpha diversity of the fecal microbiome. (a) Box plot of the alpha-diversity measure by Shannon Entropy Index of the fecal microbiota in the four experimental cohorts. The average H-value is presented with bars indicating SEM. Sample size is listed on the x-axis. Significance is denoted by asterisks and the significantly different cohorts are connected by yellow lines. *P ≤ 0.05, **P ≤ 0.01. (b) Box plot of the alpha-diversity measure by Shannon Entropy Index of the fecal microbiota in the Lm-exposed experimental cohorts only. The average H-value is presented with bars indicating SEM. Sample size is listed on the x-axis. Significance is denoted by asterisks and the significantly different cohorts are connected by yellow lines. *P ≤ 0.05, **P ≤ 0.01.
Figure 4
Figure 4
Alpha diversity measured by Shannon Entropy Index of the pregnant Lm-exposed cohort. Alpha diversity was evaluated with regard to previous exposure (a), bacteremia (b), tissue bacterial burden (c), and adverse pregnancy outcome (d). Fecal shedding of Lm was not analyzed as all subjects were positive for shedding. The average H-value is presented as box plots with bars indicating SEM. “No” indicates negative and “Yes” indicates positive for previous exposure, bacteremia, tissue positive for Lm, or occurrence of APO; the respective n is listed on the x-axis. Outliers are marked by a filled circle. Significance is denoted by asterisks and the significantly different cohorts are connected by yellow lines. *P ≤ 0.05, **P ≤ 0.01.
Figure 5
Figure 5
Beta diversity of the experimental cohorts. (a) Beta diversity by treatment group, depicted via principal coordinate analysis (PCA) calculated using Bray–Curtis dissimilarity matrix at genus-level abundances. Ellipses are color coded by cohort and depict 95% confidence grouping. (b) Beta diversity by treatment group, depicted via principal coordinate analysis (PCA) calculated using weighted UniFrac analysis at genus-level abundances. Ellipses are color coded by cohort and depict 95% confidence grouping. (c) Beta diversity by reproductive state, depicted via principal coordinate analysis (PCA) and calculated using Bray–Curtis dissimilarity matrix at genus-level abundances. Ellipses are color coded by cohort and depict 95% confidence grouping. (d) Beta diversity by reproductive state, depicted via principal coordinate analysis (PCA) calculated using weighted UniFrac analysis at genus-level abundances. Ellipses are color coded by cohort and depict 95% confidence grouping. (e) Beta diversity by subject of the pregnant Lm-exposed cohort depicted via principal coordinate analysis (PCA) and calculated using Bray–Curtis dissimilarity matrix at genus-level abundances. Occurrence of APO is noted by an asterisk shape. Ellipses are color coded by cohort and depict 95% confidence grouping. (f) Beta diversity by subject of the pregnant Lm-exposed cohort depicted via principal coordinate analysis (PCA) and calculated using weighted UniFrac dissimilarity matrix at genus-level abundances. Occurrence of APO is noted by an asterisk shape. Ellipses are color coded by cohort and depict 95% confidence grouping. (g) Beta diversity by APO, depicted via principal coordinate analysis (PCA) calculated using Bray–Curtis analysis at genus-level abundances. Occurrence of APO is noted by an asterisk shape. Ellipses are color coded by cohort and depict 95% confidence grouping. (h) Beta diversity by APO, depicted via principal coordinate analysis (PCA) calculated using weighted UniFrac analysis at genus-level abundances. Occurrence of APO is noted by an asterisk shape. Ellipses are color coded by cohort and depict 95% confidence grouping.
Figure 6
Figure 6
Abundance variation analysis of the fecal microbiome most abundant taxa. (a) The box plot illustrates the variation of abundance reads of the 10 most abundant taxa across all timepoints (A–D) of the Lm-exposed Cohorts 2 and 4. Reproductive state is color coded. OTUs are listed left to right, in order of decreasing abundance. The average abundance of each OTU is indicated by a black line in the middle of the bars and SEM denoted by lines. Outliers are represented by black dots. Significance is denoted by asterisks. *P ≤ 0.05, **P ≤ 0.01. (b) The box plot illustrates the variation of abundance reads of the most abundant taxa across all timepoints (A–D) of the pregnant Lm-exposed Cohort 4. The occurrence of APOs is color coded. OTUs are listed left to right, in order of decreasing abundance. The average abundance of each OTU is indicated by a black line in the middle of the bars and SEM denoted by lines. Outliers are represented by black circles. Significance is denoted by asterisks. *P ≤ 0.05, **P ≤ 0.01. (c) The box plot illustrates the variation of abundance reads of the most abundant taxa across all timepoints (A–D) of each subject in the pregnant Lm-exposed Cohort 4. OTUs are listed left to right, in order of decreasing abundance. Subjects are color coded. Those subjects which were used twice in the experiment are indicated with black diagonal stripes within the bars. The average abundance of each OTU is marked by a black line in the middle of the bars and SEM denoted by lines. Outliers are represented by black dots.
Figure 7
Figure 7
Differential abundance analysis. Differential abundance analysis of OTUs significantly associated with reproductive state in the Lm-exposed cohorts, bacteremia, tissue positive for Lm, and APOs. The change in OTU abundance is presented on a log2 scale along the x-axis, and individual OTUs are listed on the left. Color indicates the phylum designation, and the size of the dot illustrates the relative abundance of that phylum within the whole population. Those data points to the right indicate an increase in abundance with the (a) pregnant state, (b) Lm bacteremia, (c) presence of tissue Lm, and (d) occurrence of an APO, while negative values indicate a decrease in the specific OTU associated with these parameters. Please note that the scale of the x-axis varies by graph. The main findings from this analysis are summarized in Table 1.

References

    1. Pouillot R, Hoelzer K, Jackson KA, Henao OL, Silk BJ. Relative risk of listeriosis in Foodborne Diseases Active Surveillance Network (FoodNet) sites according to age, pregnancy, and ethnicity. Clin Infect Dis 2012; 54:S405–S410. - PubMed
    1. Thønnings S, Knudsen JD, Schønheyder HC, Søgaard M, Arpi M, Gradel KO, Østergaard C, Østergaard C, Arpi M, Gradel KO, Jensen US, Thønnings S, et al. Antibiotic treatment and mortality in patients with Listeria monocytogenes meningitis or bacteraemia. Clin Microbiol Infect 2016; 22:725–730. - PubMed
    1. Olaimat AN, Al-Holy MA, Shahbaz HM, Al-Nabulsi AA, Abu Ghoush MH, Osaili TM, Ayyash MM, Holley RA. Emergence of antibiotic resistance in Listeria monocytogenes isolated from food products: a comprehensive review. Compr Rev Food Sci Food Saf 2018; 17:1277–1292. - PubMed
    1. Sosnowski M, Lachtara B, Wieczorek K, Osek J. Antimicrobial resistance and genotypic characteristics of listeria monocytogenes isolated from food in Poland. Int J Food Microbiol 2019; 289:1–6. - PubMed
    1. Baquero F, Lanza VF, Duval M, Coque TM. Ecogenetics of antibiotic resistance in Listeria monocytogenes. Mol Microbiol 2020; 113:570–579. - PubMed

Publication types

Substances