. 2023 Sep 2;15(17):8993-9021.
doi: 10.18632/aging.205012. Epub 2023 Sep 2.

Identification and validation of a prognostic signature of cuproptosis-related genes for esophageal squamous cell carcinoma

Affiliations

Identification and validation of a prognostic signature of cuproptosis-related genes for esophageal squamous cell carcinoma

Yiping Zhang et al. Aging (Albany NY). .

Abstract

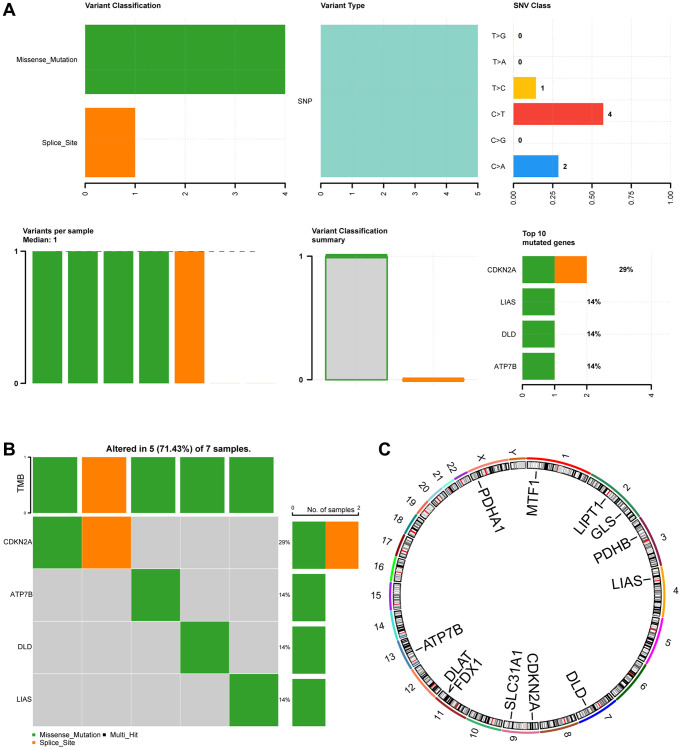
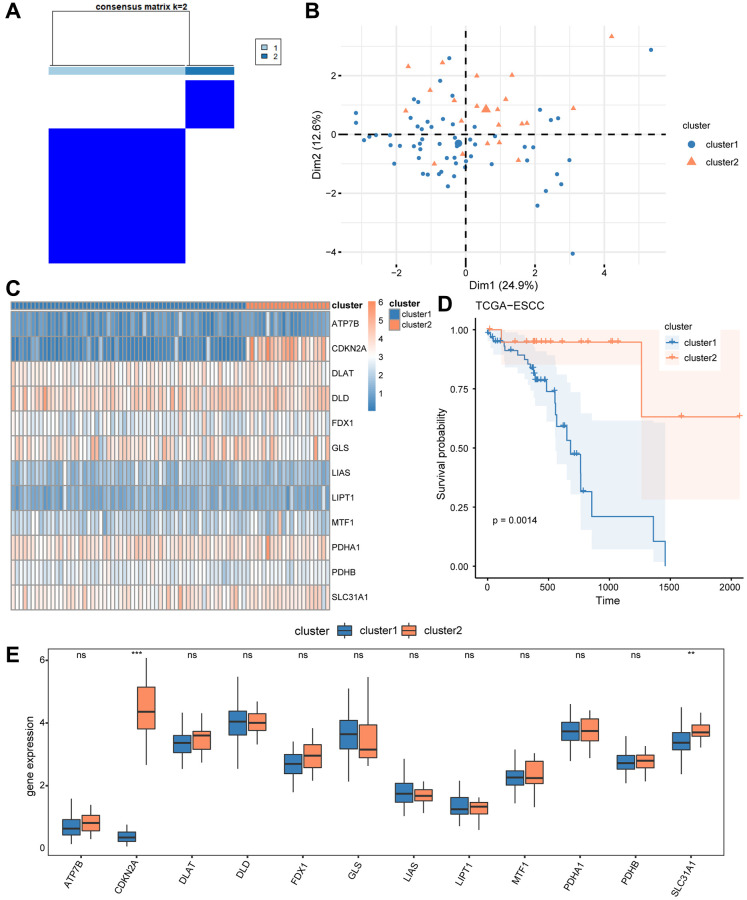
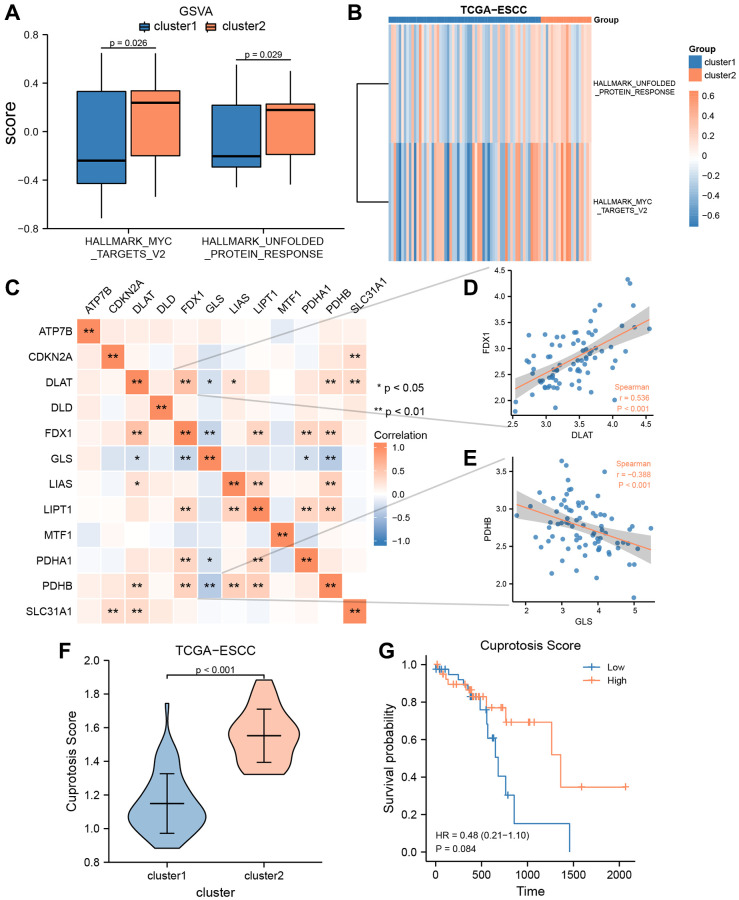
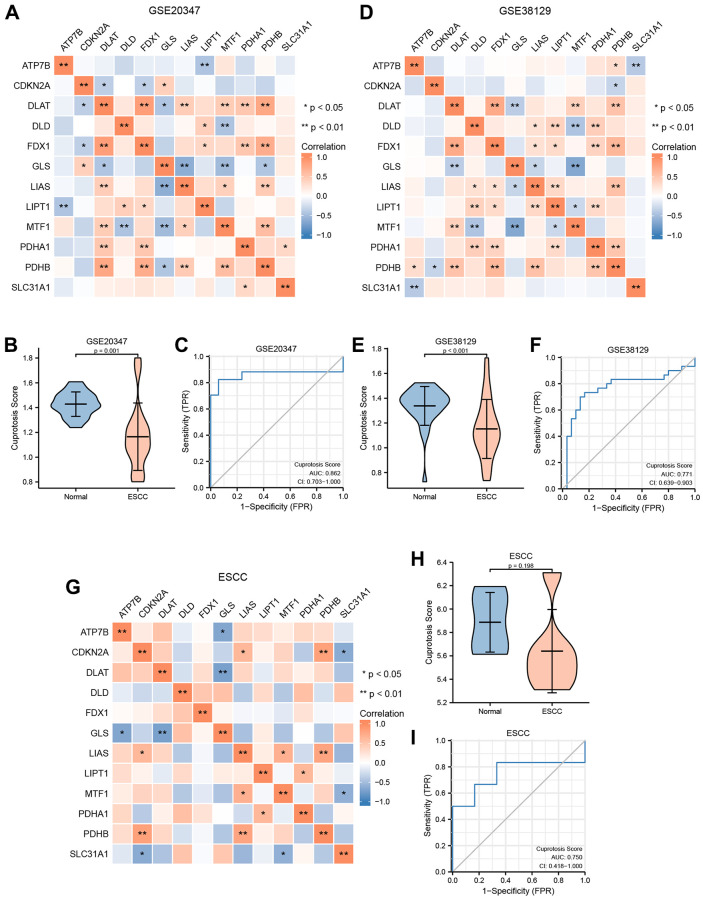
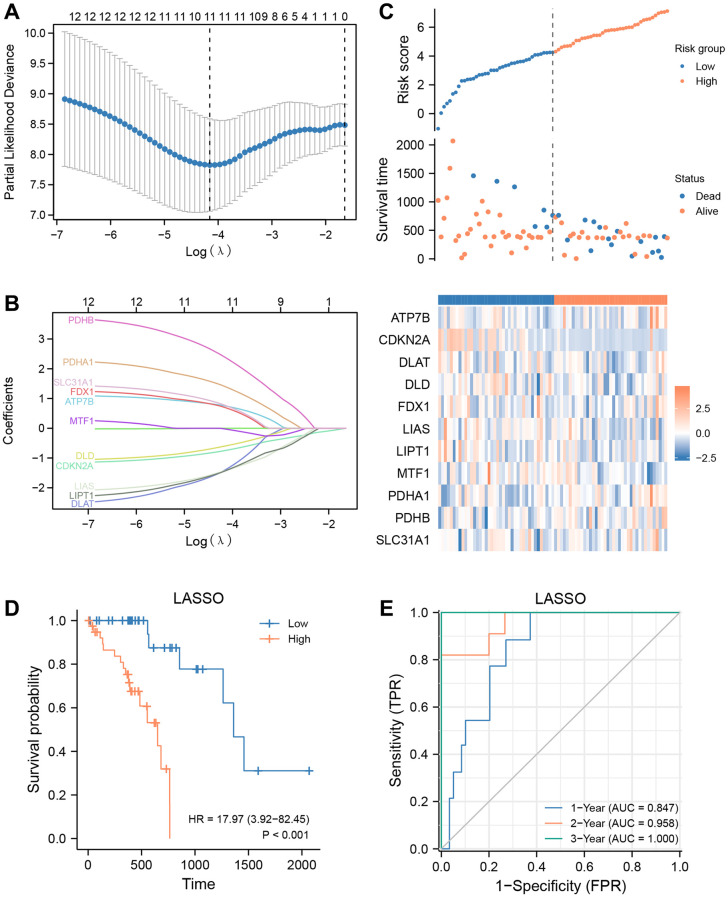
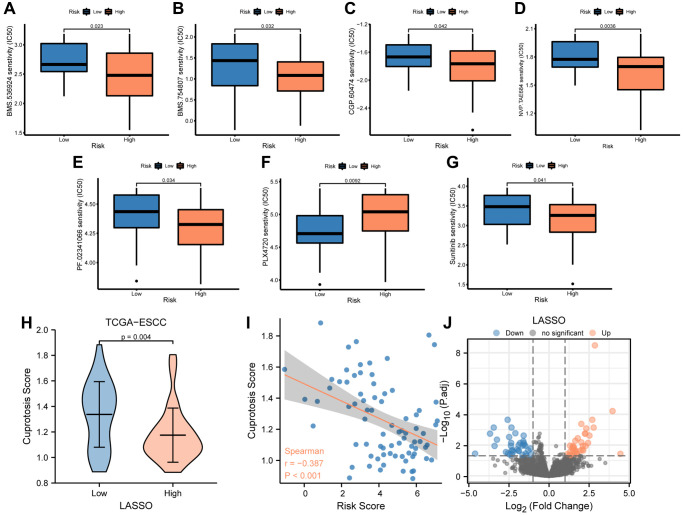
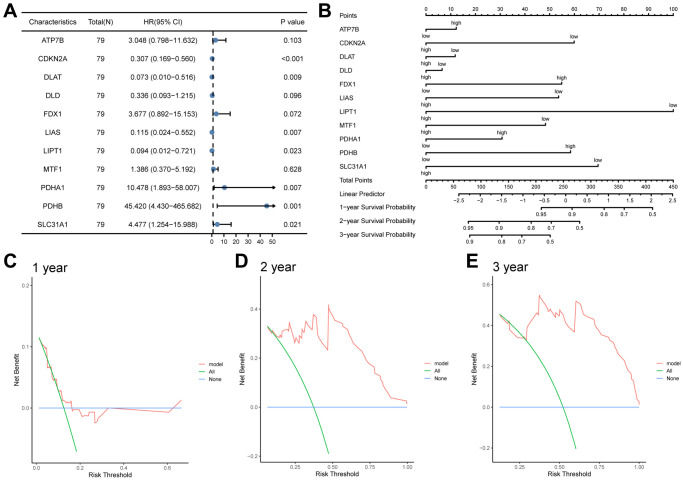
Esophageal squamous cell carcinoma (ESCC) is a highly lethal form of cancer. Cuproptosis is a recently discovered form of regulated cell death. However, its significance in ESCC remains largely unknown. In this study, we observed significant expression differences in most of the 12 cuproptosis-related genes (CRGs) in the TCGA-ESCC dataset, which was validated using GSE20347, GSE38129, and individual ESCC datasets. We were able to divide patients in the TCGA-ESCC cohort into two subgroups based on disease, and found significant differences in survivor outcomes and biological functions between these subgroups. Additionally, we identified 11 prognosis-related genes from the 12 CRGs using LASSO COX regression analysis and constructed a CRGs signature for ESCC. Patients were categorized into high- and low-risk subgroups based on their median risk score, with those in the high-risk subgroup having significantly worse overall survival than those in the low-risk subgroup. The CRGs signature was also highly accurate in predicting prognosis and survival outcomes. Univariate and multivariate Cox regression analyses revealed that 8 of the 11 CRGs were independent prognostic factors for predicting survival in ESCC patients. Furthermore, our nomogram performed well and could serve as a useful tool for predicting prognosis. Finally, our risk model was found to be relevant to the sensitivity of targeted agents and immune infiltration. Functional enrichment analysis demonstrated that the risk model was associated with biological pathways of tumor migration and invasion. In summary, our study may provide a promising prognostic signature based on CRGs and offers potential targets for personalized therapy.

Keywords: cuproptosis; esophageal squamous cell carcinoma; nomogram; prognostic signature; risk score.


Conflict of interest statement

CONFLICTS OF INTEREST: The authors declare no conflicts of interest related to this study.

Figures

Figure 1
Figure 1
Differential expression of 12 CRGs between ESCC tissues and normal tissues in four cohorts. The expression levels of 12 genes from TCGA-ESCC dataset (A), GSE20347 dataset (B), GSE38129 dataset (C), ESCC dataset (D) in ESCC tissue and normal tissue.
Figure 2
Figure 2
Mutation analysis of CRGs in ESCC. (A) Demonstration of CRGs mutations in ESCC. (B) Mutation details of CRGs are displayed. (C) Chromosomal localization map of CRGs.
Figure 3
Figure 3
Construction of disease subtypes associated with ESCC. (A) Results of consensus clustering in ESCC for k = 2 clusters. (B) Presentation of PCA results for two ESCC disease subtypes (cluster1 and cluster2). (C) Complex numerical heat map of CRGs in different subtypes of ESCC disease. (D) KM curve between cluster1 and cluster2. (E) The expression level of CRGs in two distinct subtypes. ns: P > 0.05, *P < 0.05, **P < 0.01, ***P < 0.001.
Figure 4
Figure 4
GSVA and construction of cuproptosis score prognosis signature. (A, B) GSVA enrichment analysis between two consensus clusters in TCGA-ESCC dataset, involved group comparison chart (A) and ComplexHeatmap (B). (C) The heat map indicated a correlation among the expression level of 12 CRGs from TCGA-ESCC dataset. (D, E) Correlation scatter plot showed the correlation between two pairs of CRGs, included DLAT and FDX1 (D), GLS and PDHB (E). (F) Differential analysis of Cuproptosis score among two ESCC subtypes. (G) Kaplan–Meier OS curves for patients in the high-and low- score group.
Figure 5
Figure 5
Construction of cuproptosis score diagnosis signature. (A) The heat map presented the correlation among the expression level of 12 CRGs in GSE20347 cohort. (B) Differential analysis of cuproptosis score between normal group and ESCC group in GSE20347 cohort. (C) ROC curves showed the diagnosis performance of GSE20347 cohort. (D) The heat map presented the correlation among the expression level of 12 CRGs in GSE38129 cohort. (E) Differential analysis of cuproptosis score between normal group and ESCC group in GSE38129 cohort. (F) ROC curves showed the diagnosis performance of GSE20347 cohort (C), GSE38129 cohort. (G) The heat map presented the correlation among the expression level of 12 CRGs in ESCC cohort. (H) Differential analysis of cuproptosis score between normal group and ESCC group in ESCC cohort. (I) ROC curves showed the diagnosis performance of ESCC cohort.
Figure 6
Figure 6
Prognostic signatures construction and prediction. (A) Partial likelihood deviance of different numbers of variables. One thousand-fold cross-validation was applied for tuning penalty parameter selection. (B) LASSO analysis identified 11 CRGs. Each curve corresponds to one gene. (C) Risk score, distribution of patient survival status between the low- and high−risk groups, and expression heatmaps of 11 CRGs. (D) Kaplan–Meier curves indicated that there is a strong relationship between high and low risk score and the overall survival rate. (E) ROC curve was applied to assess the predictive efficiency of the prognostic risk signature.
Figure 7
Figure 7
Analysis of drug sensitivity between low-and high-risk groups. (AG) IC50 of seven drugs, including BMS.536924 (A), BMS.754807 (B), CGP.60474 (C), NVP.TAE684 (D), PF.02341066 (E), PLX4720 (F), and Sunitinib (G) differed for ESCC patients in different risk groups. (H) Difference in cuproptosis score between low- and high-risk groups in TCGA-ESCC dataset. (I) Correlations between cuproptosis score and risk score. (J) The plot showed 36 upregulated and 35 downregulated genes based on the above volcano analysis in high-risk group.
Figure 8
Figure 8
GO enrichment and genome enrichment analysis. (A) The bubble plot and (B) circos plot showing the significantly enriched GO pathways for DEGs between in TCGA-ESCC dataset. (C) The bubble plot and (D) circle plot presenting the results of GO functional enrichment analysis which standardized by logFC values. (E) Four biological characteristics for Gene sets enriched analysis in TCGA-ESCC dataset. (FI) The GSEA showed DEGs of TCGA-ESCC dataset significantly enriched in 4 pathways, including the proteasome degradation pathway (F), biocarta classic pathway (G), complement activation pathway (H), and integrin 3 pathway (I). Ordinate in bubble plot (A) is GO terms, the color of the bubble corresponds to the magnitude of the correlation. In network plots (B), orange color dots represented the detail genes, and Navy blue circles represented the detail pathways. In the bubble plot (C), Cyan dots represented BP pathway, orange circles represented CC pathway, and the Navy blue circles represented MF pathway. In the circle plot, orange dots represented upregulated genes (logFC > 0), Navy blue dots represented downregulated genes (logFC < 0).
Figure 9
Figure 9
CIBERSORTX for immune cell infiltration analysis between the low-and high-risk groups. (A) Boxplot present the infiltration abundances analysis of immune cells from TCGA-ESCC cohort by CIBERSORT algorithm. (B, C) Correlation analysis among infiltration abundance of immune cells in low-risk group (B) and high-risk group (C) from TCGA-ESCC cohort. (D, E) Correlation analysis between infiltration abundance of immune cells and expression levels of CRGs in low-risk group (D) and high-risk group (E).
Figure 10
Figure 10
The prognostic value of the CRGs prognosis model. (A, B) Univariate and multivariate cox regression analysis Forest plots (A), nomogram (B). (C, D) Decision curve analyses (DCA) of LASSO-Cox regression prognosis model for predicting 1-year (C), 2-year (D), and 3-year (E).
Figure 11
Figure 11
The prognostic value of the LASSO-Cox regression prognosis risk model in TCGA-ESCC dataset. (A, B) Boxplots (A) and ROC curve (B) for the risk score levels in the low- and high-risk groups in TCGA-ESCC dataset. (C, D) Boxplots (C) and ROC curve (D) for the risk score levels in the ESCC and normal groups in TCGA-ESCC dataset.

Similar articles

References

    1. Sung H, Ferlay J, Siegel RL, Laversanne M, Soerjomataram I, Jemal A, Bray F. Global Cancer Statistics 2020: GLOBOCAN Estimates of Incidence and Mortality Worldwide for 36 Cancers in 185 Countries. CA Cancer J Clin. 2021; 71:209–49. 10.3322/caac.21660 - DOI - PubMed
    1. Zhu H, Ma X, Ye T, Wang H, Wang Z, Liu Q, Zhao K. Esophageal cancer in China: Practice and research in the new era. Int J Cancer. 2023; 152:1741–51. 10.1002/ijc.34301 - DOI - PubMed
    1. Shen L, Kato K, Kim SB, Ajani JA, Zhao K, He Z, Yu X, Shu Y, Luo Q, Wang J, Chen Z, Niu Z, Zhang L, et al., and RATIONALE-302 Investigators. Tislelizumab Versus Chemotherapy as Second-Line Treatment for Advanced or Metastatic Esophageal Squamous Cell Carcinoma (RATIONALE-302): A Randomized Phase III Study. J Clin Oncol. 2022; 40:3065–76. 10.1200/JCO.21.01926 - DOI - PMC - PubMed
    1. Tsvetkov P, Coy S, Petrova B, Dreishpoon M, Verma A, Abdusamad M, Rossen J, Joesch-Cohen L, Humeidi R, Spangler RD, Eaton JK, Frenkel E, Kocak M, et al.. Copper induces cell death by targeting lipoylated TCA cycle proteins. Science. 2022; 375:1254–61. 10.1126/science.abf0529 - DOI - PMC - PubMed
    1. Ge EJ, Bush AI, Casini A, Cobine PA, Cross JR, DeNicola GM, Dou QP, Franz KJ, Gohil VM, Gupta S, Kaler SG, Lutsenko S, Mittal V, et al.. Connecting copper and cancer: from transition metal signalling to metalloplasia. Nat Rev Cancer. 2022; 22:102–13. 10.1038/s41568-021-00417-2 - DOI - PMC - PubMed

Publication types