Review
. 2023 Nov:92:101252.
doi: 10.1016/j.plipres.2023.101252. Epub 2023 Sep 4.

The skin barrier: An extraordinary interface with an exceptional lipid organization

Affiliations
Review

The skin barrier: An extraordinary interface with an exceptional lipid organization

Joke A Bouwstra et al. Prog Lipid Res. 2023 Nov.

Abstract

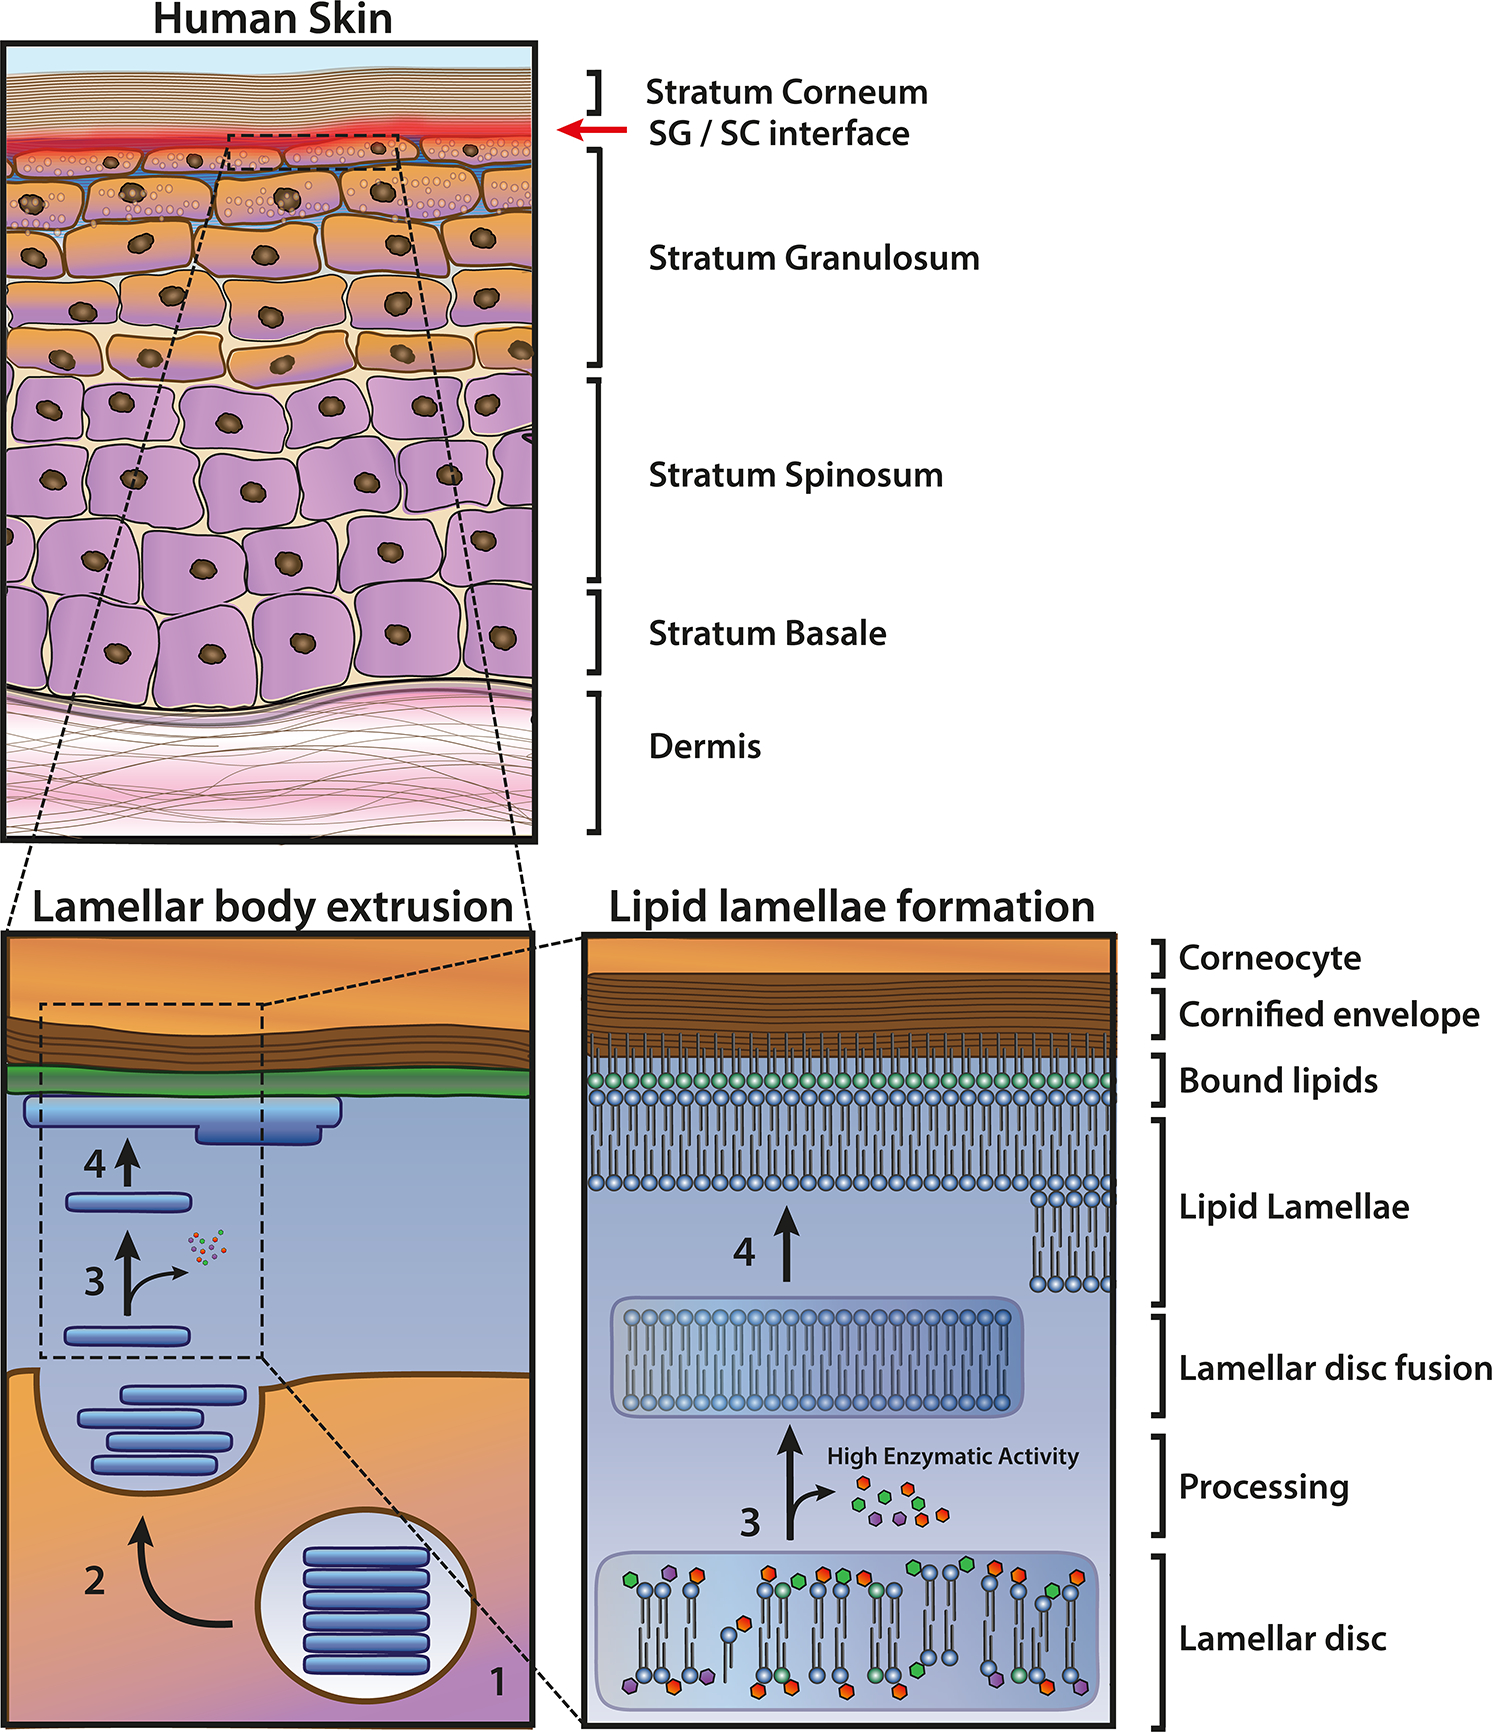
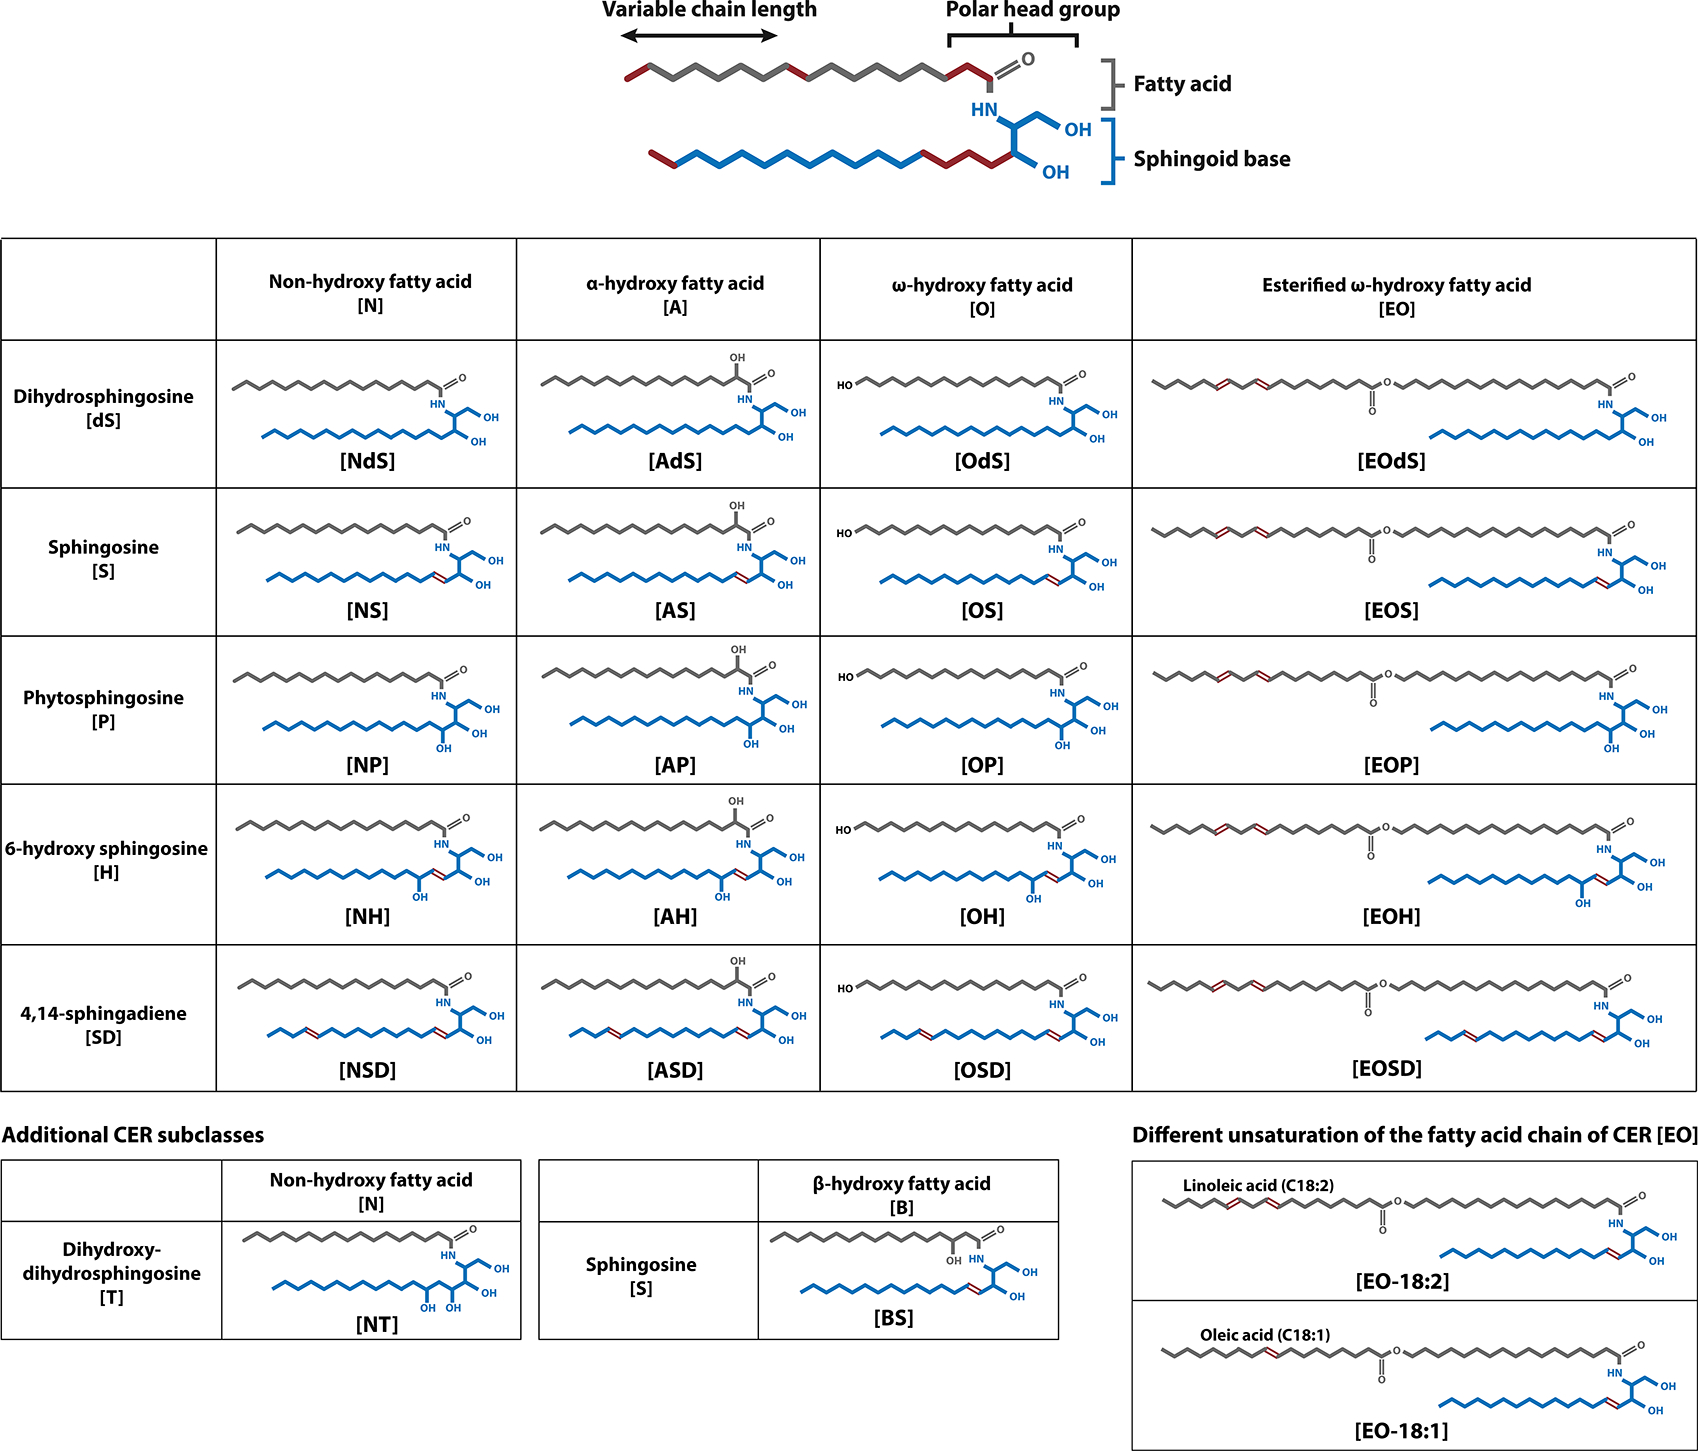
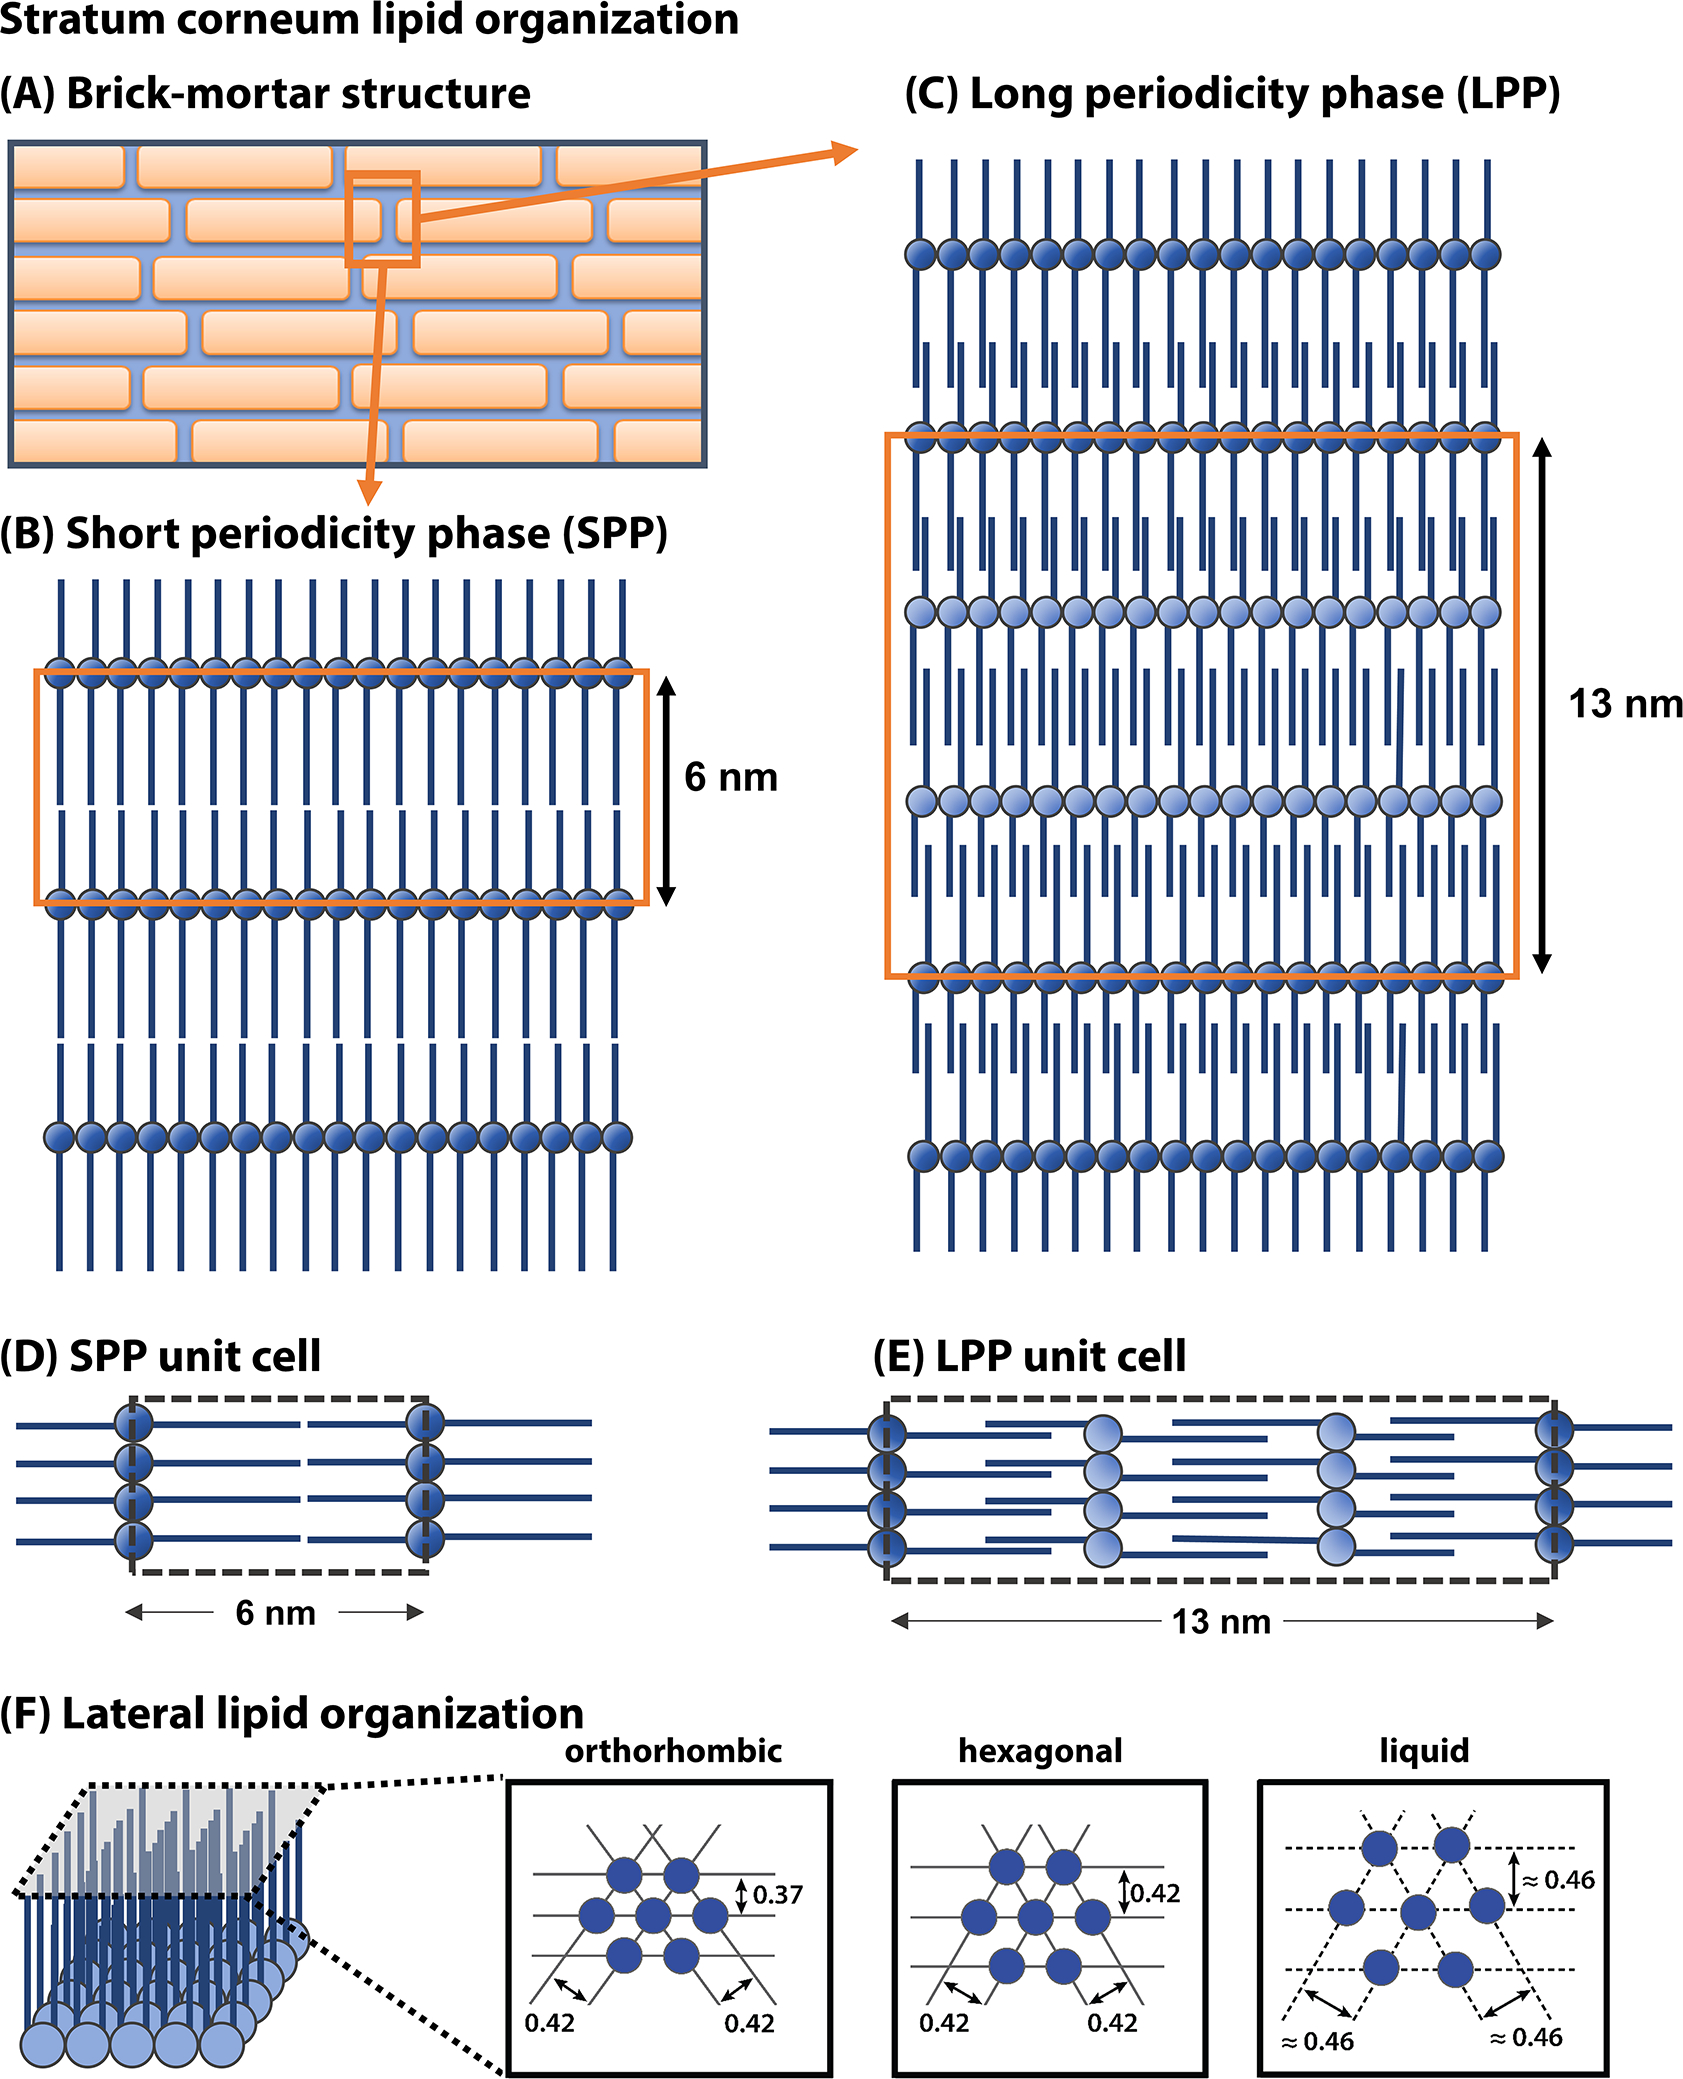
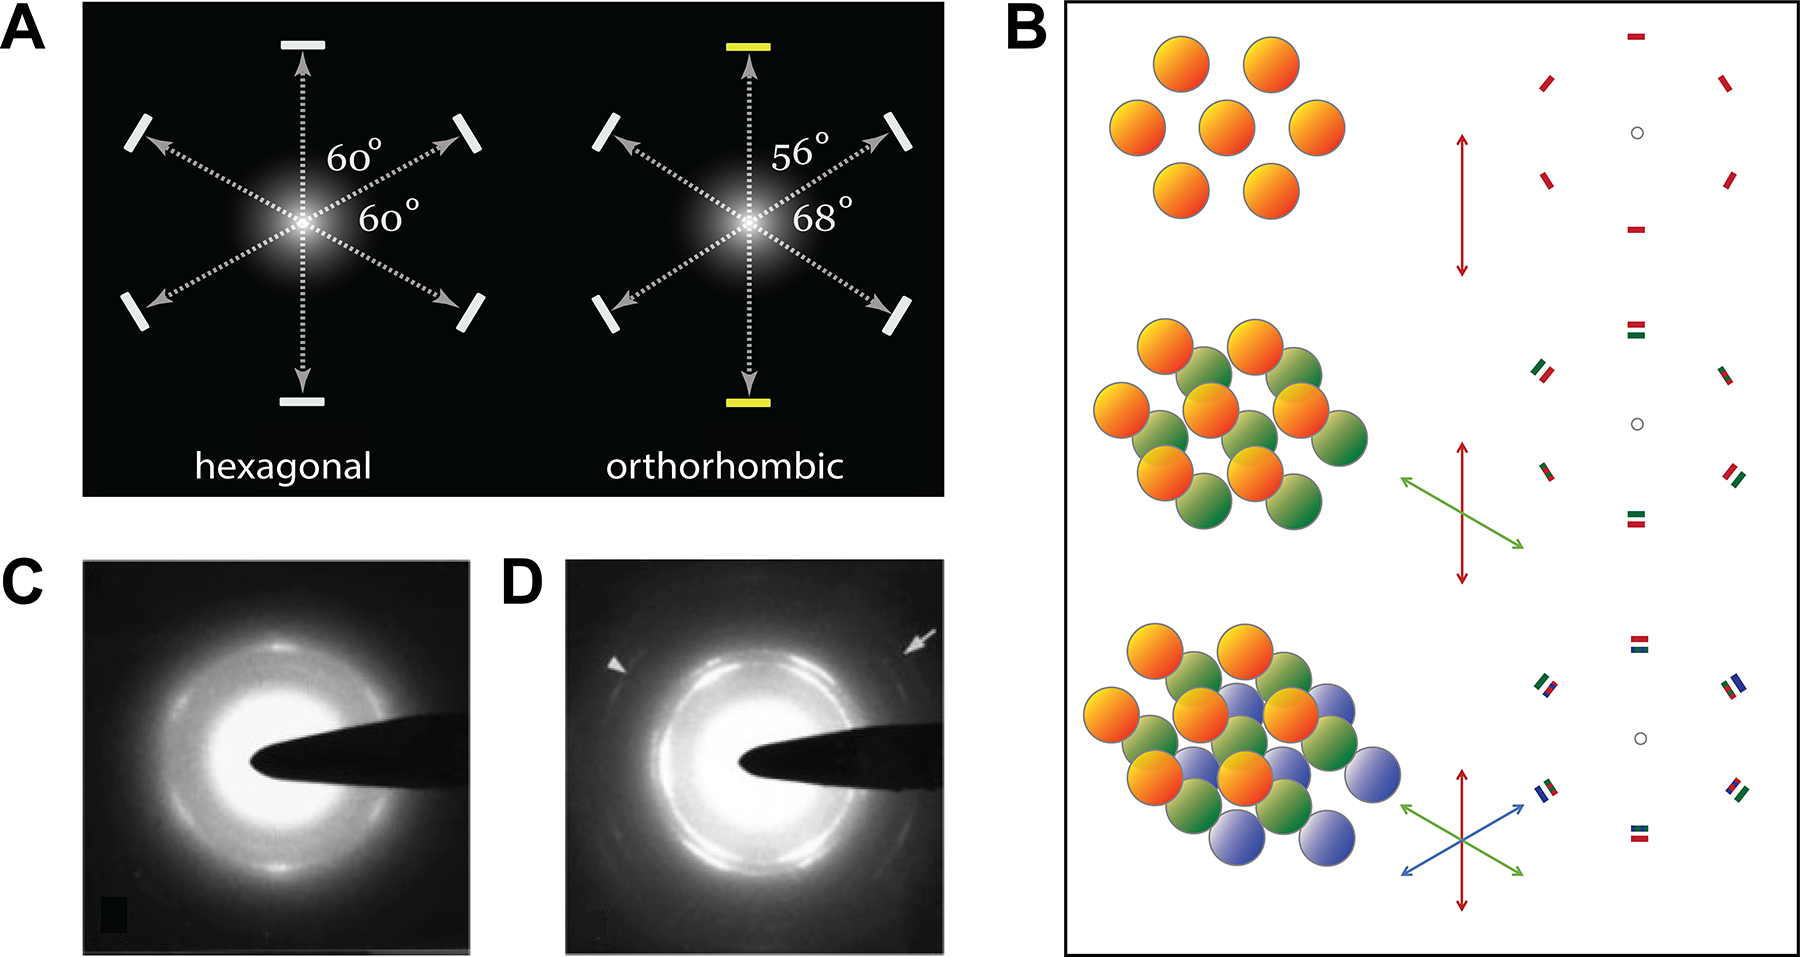
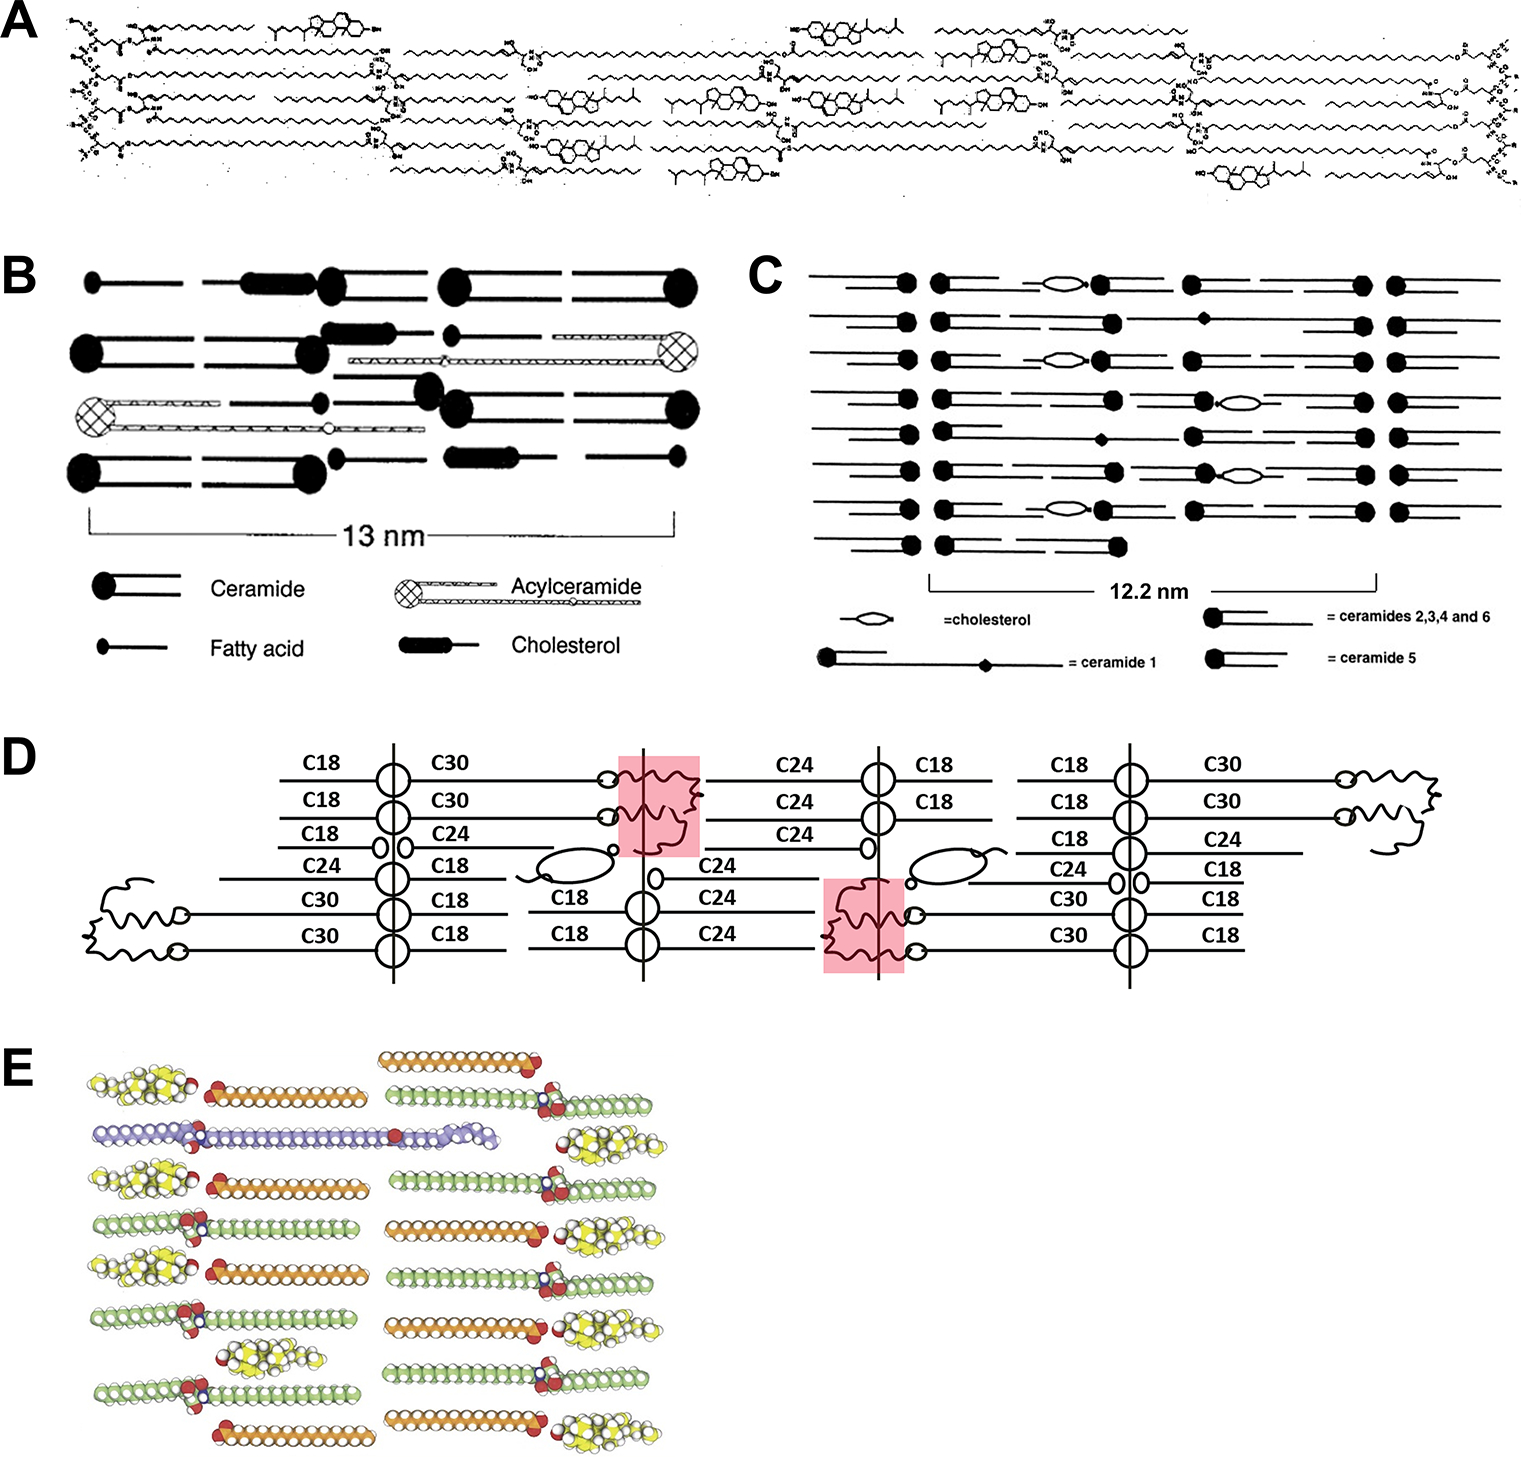
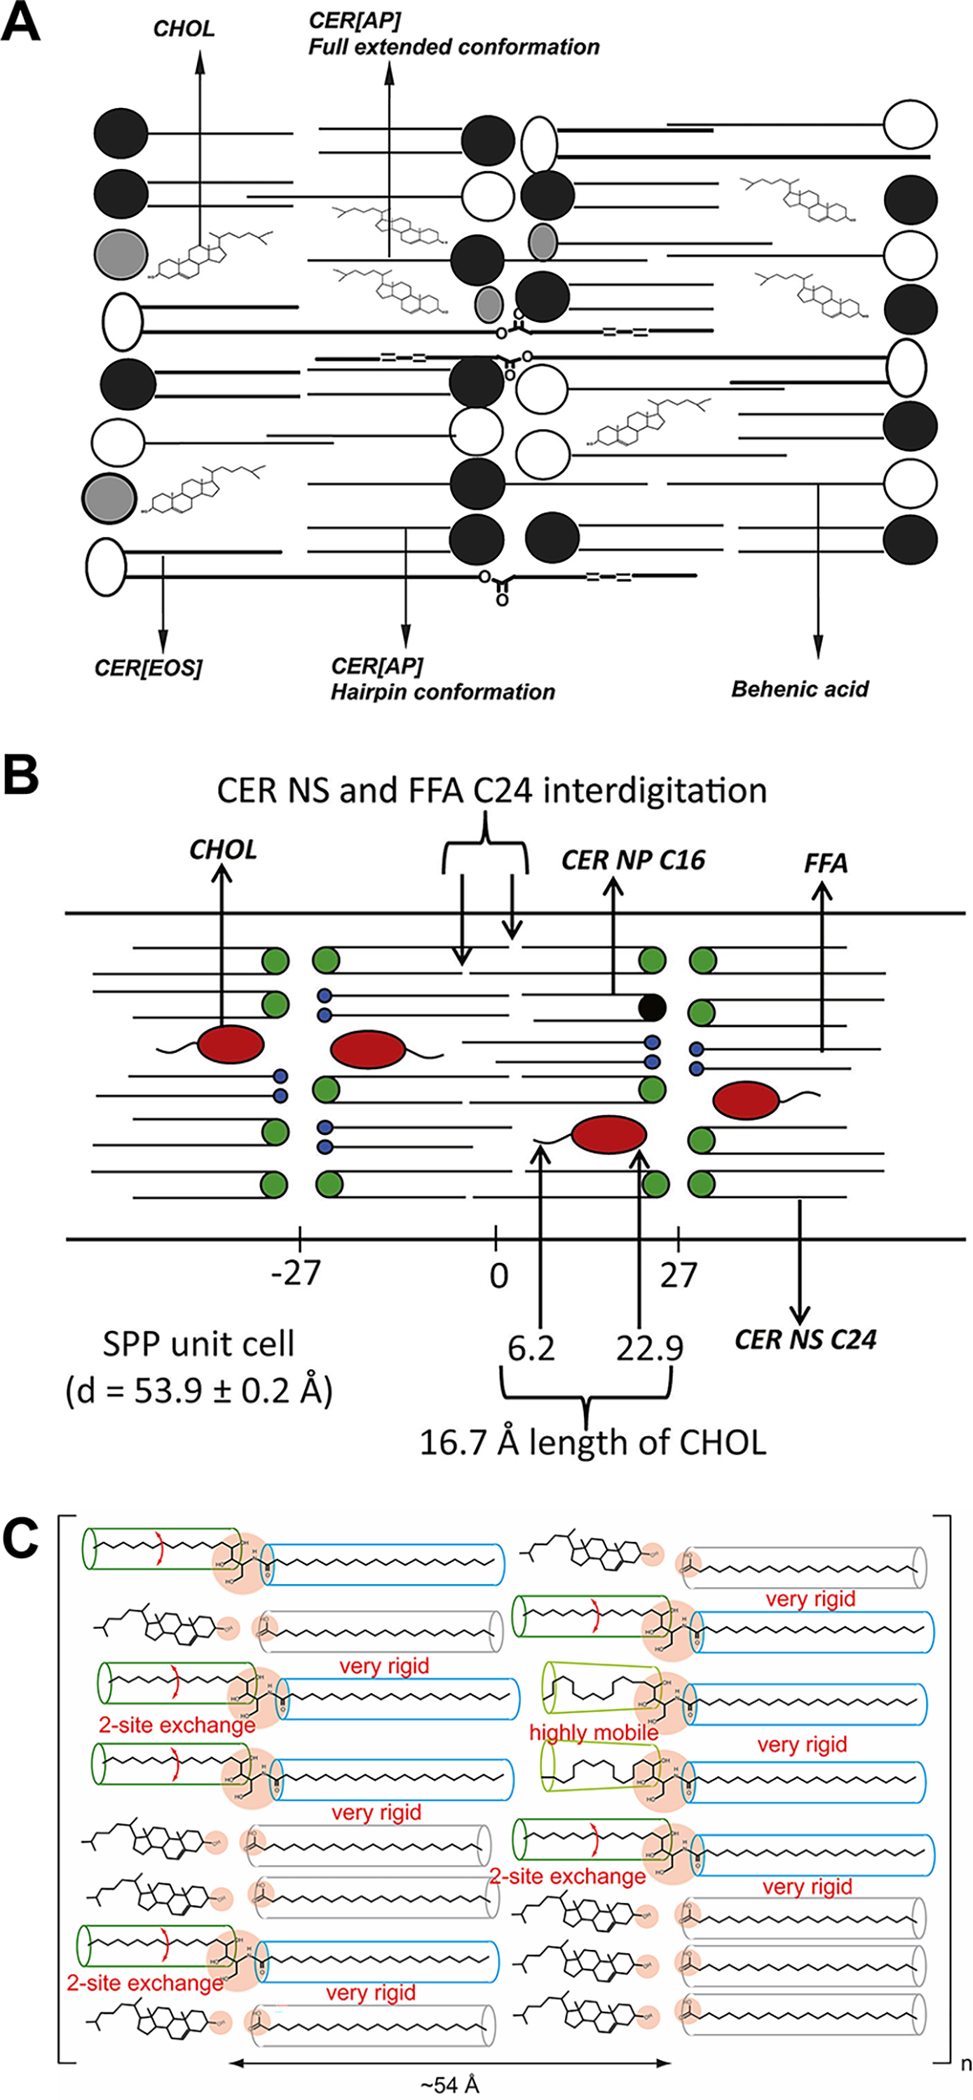
The barrier function of the skin is primarily located in the stratum corneum (SC), the outermost layer of the skin. The SC is composed of dead cells with highly organized lipid lamellae in the intercellular space. As the lipid matrix forms the only continuous pathway, the lipids play an important role in the permeation of compounds through the SC. The main lipid classes are ceramides (CERs), cholesterol (CHOL) and free fatty acids (FFAs). Analysis of the SC lipid matrix is of crucial importance in understanding the skin barrier function, not only in healthy skin, but also in inflammatory skin diseases with an impaired skin barrier. In this review we provide i) a historical overview of the steps undertaken to obtain information on the lipid composition and organization in SC of healthy skin and inflammatory skin diseases, ii) information on the role CERs, CHOL and FFAs play in the lipid phase behavior of very complex lipid model systems and how this knowledge can be used to understand the deviation in lipid phase behavior in inflammatory skin diseases, iii) knowledge on the role of both, CER subclasses and chain length distribution, on lipid organization and lipid membrane permeability in complex and simple model systems with synthetic CERs, CHOL and FFAs, iv) similarity in lipid phase behavior in SC of different species and complex model systems, and vi) future directions in modulating lipid composition that is expected to improve the skin barrier in inflammatory skin diseases.

Keywords: Inflammatory skin diseases; Permeability; Skin barrier function; Stratum corneum lipid composition; Stratum corneum lipids.


Conflict of interest statement

Declaration of Competing Interest The authors declare no competing financial interest.

Figures

Figure 1.
Figure 1.
Schematic view of the epidermal cross section, the lamellar body extrusion process and lipid lamellae formation. The epidermis is composed of 4 layers. The basal layer is the stratum basale in which keratinocytes divide. On top of the basal layer is stratum spinosum. In the stratum spinosum the keratinocytes start to differentiate and the formation of lamellar bodies, containing the precursors of the barrier lipids, is initiated. In the next viable layer, stratum granulosum, synthesis of these precursor lipids is intensified and the concentration of lamellar bodies increases. When the keratinocytes arrive at the superficial part of the stratum granulosum, the final differentiation product, the SC, is generated. The bounding membranes of the lamellar bodies fuse into the plasma membrane of the uppermost granular cells, and the contents of the lamellar bodies are extruded into the intercellular space between stratum granulosum and SC, and they release their content into the intercellular space. During this extrusion process the phosphoglycerides are converted into fatty acids, while glucosylceramides and sphingomyelin are converted into CERs. Enzymes catalyzing these chemical modifications are also stored in the lamellar bodies. Simultaneously with the changes in lipid composition, the lamellar disks fuse together and form the crystalline lipid lamellae. Most probably the lipids bound to the cornified envelope serve as a template for this fusion process. Adapted from [273].
Figure 2.
Figure 2.
Stratum corneum ceramide subclasses, nomenclature and structure. The CERs are composed of a large number of subclasses. All CERs consist of a sphingoid base and an acyl chain. According to the nomenclature introduced by Motta, the acyl chains and the sphingosine chain are indicated by 1 or 2 letters [18]. The acyl chains are either the non-hydroxy (N), α-hydroxy (A), β-hydroxy (B), ω-hydroxy (O) or linoleic acid esterified to an ω-hydroxy acyl chain (EO). The sphingoid base is either dihydrosphingosine (dS), sphingosine (S), phytosphingosine (P), 6-hydroxysphingosine (H) or 4, 14 sphingadiene (SD) and dihydro dihydrospingosine (T). For example, CER NS is a non-hydroxy acyl chain linked to a sphingosine, CER AP is an α-hydroxy acyl chain linked to an phytosphingosine base and CER EOH is an linoleic esterified to an ω-hydroxy acyl chain linked to an 6-hydroxysphingosine. The subclasses with the esterified ω-hydroxy acyl chain (EO), that is CER EOS, CER EOH, CER EOP and CER EOdS, are referred to as CER EO. The subclasses with the ω-hydroxy acyl chain are referred to as CER O. In each CER subclass there is a distribution of acyl chain lengths and sphingoid base chain length. In general, the acyl chain length distribution is much broader than the sphingoid base chain length distribution. All CER subclasses identified in human stratum corneum that consist of a sphingoid base and one acyl chain are depicted in the figure. In addition oleate and linoleate linked to the ω-hydroxy acyl chain are depicted separately.
Figure 3.
Figure 3.
A schematic illustration of the lamellar and lateral organization in stratum corneum. The stratum corneum (SC) consists of corneocytes with a lipid matrix in the intercellular space (A). The lipids in the intercellular space are arranged in two lamellar phases: the short periodicity phase (SPP) with a repeat distance of around 6 nm (B) and the long periodicity phase (LPP) with a repeat distance of around 13 nm (C). A lamellar phase consists of a series of repeating units referred to as the unit cell with a length equal to the repeat distance. A schematic presentation of the unit cell is provided in figure D and E for the SPP and LPP, respectively. F. Within the plane perpendicular to the unit cell direction, the lipids can form either a very dense orthorhombic packing, a less dense hexagonal packing or a disordered liquid packing. The orthorhombic packing has two distances between the lattice planes (a lattice plane is a plane with a high electron density) of approximately 0.42 and 0.37 nm. In this dense packing the lipids are not able to rotate along their longest axis. In the hexagonal packing, the distance between the lattice planes is around 0.42 nm and the lipids are able to rotate along their longest axis. Finally, in the fluid phase the distance between the lattice planes vary to some extent, but is approximately 0.46 nm.
Figure 4.
Figure 4.
Electron diffraction patterns obtained from stratum corneum. Electron diffraction patterns can be used to distinguish between an orthorhombic and hexagonal packing when only a single crystal or a few crystals are exposed to the electron beam. (A) When the incident beam is perpendicular to the paper plane, the hexagonal packing results in a hexagonal pattern with all angles between two adjacent spots and the primary beam equal to 60 °. In case of an orthorhombic lattice the orthorhombic packing is also characterized by 6 spots, but the angle between two adjacent spots is not equal to 60 °. Furthermore 2 out of 6 spots have a longer distance (yellow spots) to the primary beam. (B) Frequently an orthorhombic packing was observed based on three crystals, oriented such that the spots were rotated over a fixed angle. When the incident beam is perpendicular to the plane of the paper, this give rise to the formation of 6 doublet spots as shown in the figure. (C) An example of diffraction pattern from a hexagonal packing. (D) An example of an orthorhombic diffraction pattern that can be explained by the three orientations. Adapted and modified from [86, 128].
Figure 5.
Figure 5.
Diffraction patterns of controls and atopic dermatitis patients. Diffraction patterns of (A) control subjects, and (B) atopic dermatitis patients non-lesional skin and (C) boxplot showing the variance of the main peak position in the diffraction pattern. 1st and 3rd indicate the 1st and 3rd order diffraction peaks of the long periodicity phase (LPP). ① and ② indicate patients with an altered diffraction profile. In both diffraction patterns the main peak position shifted to higher q-value. (* and **) and in ② the shoulder attributed to 3rd order diffraction peak of the LPP is not present. # indicates a diffraction peak attributed to crystalline CHOL. The main peak is caused by the 1st order diffraction peak of the short periodicity phase and the 2nd order of the LPP, see supplement Figure S1 for explanations. Reproduced from Janssens et al. [108].
Figure 6.
Figure 6.
Lipid membranes studied by different methods. After spraying and equilibration, the resulting lipid membrane can be studied using various methods. Lipids are sprayed on a support. After equilibration and hydration, the sprayed lipid membrane model can be used for either permeability studies of a model compound including water (TEWL measurements). The lipid models can also be used to examine the lateral packing, conformational ordering, hydrogen bonding network, or mixing properties of the lipids. Finally, the sprayed lipids can be examined by diffraction to determine the long range ordering, lateral packing, and the position of water or the lipids in the unit cell.
Figure 7.
Figure 7.
Similarity of the calculated electron density profiles of the long periodicity phase unit cell. A comparison of the electron density profiles of the LPP unit cell observed by McIntosh (top; 2:1:1 molar ratio of isolated porcine CERs:CHOL:FFA C16) and Groen et al. (bottom, 2:1:1 isolated porcine CERs:CHOL:FFAmix) [96, 202]. The layer suggested by McIntosh as a water layer in the electron density profile is the same as the central hydrocarbon layer in the model of Groen et al. In both models, the electron density is higher than the other two hydrocarbon layers, but lower than in the head group regions. The dashed lines indicate equal positions with high electron density in two profiles. The position of CHOL in both unit cells is the same in both studies (shown by an arrow in both unit cells, see also Figure 8). The CHOL position in the McIntosh unit cell model was determined by the swelling method, while the position of CHOL in the Groen unit cell was determined by neutron diffraction (see Figures 8E and 8F [97]. The figures are adapted from [96, 202].
Figure 8.
Figure 8.
The location of the water and lipids based in the unit cell of the long periodicity phase based on the scattering length density (SLD) profiles. A 1:1:1 CER:CHOL:FFA m/m ratio was used in all studies. (A) The SLD profile of water [79]. A higher SLD value means a higher concentration of water. The water is expected to be located at the lipid head group in the unit cell. (B) The SLD profile of the lipid mixture containing synthetic porcine CERs with deuterated linoleate esterified to the ω-hydroxy acyl chain of CER EOS. The corresponding location of linoleate is also shown. [97] (C) The SLD profile of the lipid mixture containing synthetic porcine CERs with the terminally deuterated sphingosine chain of CER EOS. (D) The SLD profile with perdeuterated FFA C24 [79]. (E) The SLD profile of a lipid mixture containing synthetic porcine CERs with deuterated head group of CHOL [97]. (F) The SLD profile of a lipid mixture containing synthetic porcine CERs with deuterated tail of CHOL [97]. (G) The SLD profile of the lipid mixture containing CER NS either perdeuterated acyl chain or perdeuterated terminal moiety of the sphingoid base [90]. For abbreviations CER subclasses, see Figure 2.
Figure 9.
Figure 9.
The lipid arrangement in the repeating unit (unit cell) of the LPP as proposed by various molecular models. (A) The molecular model based on the broad-narrow-broad lucent ruthenium tetroxide pattern [69]. (B). A revised model also based on the broad-narrow-broad lucent ruthenium tetroxide pattern obtained with lipid mixtures [228]. (C) A molecular model based on the electron density profile obtained from X-ray diffraction [186]. (D) A molecular model based on the location of the lipids in the unit cell obtained by neutron diffraction [97]. (E) A molecular model based on the pattern obtained by cryo-electron microscopy combined with simulations [99].
Figure 10.
Figure 10.
The lipid arrangement in the repeating unit (unit cell) of the short periodicity phase as proposed by various molecular models. (A) The model based on the neutron diffraction studies. The model is based on the presence of CER AP C18 in the mixture, which has a dominant effect on the formation of the unit cell. Partially deuterated FFA C22 is localized in this structure. CER EOS is arranged in the short periodicity phase spanning a whole bilayer [224]. (B) The model is based on the localization of FFA C24, CHOL head group and tail and the acyl chain of CER NS using neutron diffraction [259]. At that time it was not yet known whether the CERs were in a linear or hairpin conformation. (C) The model of the unit cell based on NMR and FTIR studies. The FTIR studies showed that the acyl chains and fatty acid form large domains suggesting a linear arrangement of the CER NS [245]. For abbreviations CER subclasses, see Figure 2.

References

    1. Menon GK, Cleary GW, Lane ME. The structure and function of the stratum corneum. Int J Pharm 2012;435(1):3–9. 10.1016/j.ijpharm.2012.06.005 - DOI - PubMed
    1. Ponec M, Weerheim A, Lankhorst P, Wertz P. New acylceramide in native and reconstructed epidermis. J Invest Dermatol 2003;120(4):581–8. 10.1046/j.1523-1747.2003.12103.x - DOI - PubMed
    1. Wertz PW. Epidermal Lipids. Seminars in Dermatology 1992;11(2):106–13. - PubMed
    1. Pascher I, Lundmark M, Nyholm PG, Sundell S. Crystal structures of membrane lipids. Biochim Biophys Acta 1992;1113(3–4):339–73. 10.1016/0304-4157(92)90006-v - DOI - PubMed
    1. Brandner JM. Importance of Tight Junctions in Relation to Skin Barrier Function. Curr Probl Dermatol 2016;49:27–37. 10.1159/000441541 - DOI - PubMed

Publication types