. 2023 Oct;17(10):1953-1961.
doi: 10.1002/1878-0261.13515. Epub 2023 Sep 11.

Assay-agnostic spatial profiling detects tumor microenvironment signatures: new diagnostic insights for triple-negative breast cancer

Affiliations

Assay-agnostic spatial profiling detects tumor microenvironment signatures: new diagnostic insights for triple-negative breast cancer

Colleen Ziegler et al. Mol Oncol. 2023 Oct.

Abstract

The role of the tumor microenvironment (TME) in immuno-oncology has driven demand for technologies that deliver in situ, or spatial, molecular information. Compartmentalized heterogeneity that traditional methods miss is becoming key to predicting both acquired drug resistance to targeted therapies and patient response to immunotherapy. Here, we describe a novel method for assay-agnostic spatial profiling and demonstrate its ability to detect immune microenvironment signatures in breast cancer patients that are unresolved by the immunohistochemical (IHC) assessment of programmed cell death ligand-1 (PD-L1) on immune cells, which represents the only FDA microenvironment-based companion diagnostic test that has been approved for triple-negative breast cancer (TNBC). Two distinct physiological states were found that are uncorrelated to tumor mutational burden (TMB), microsatellite instability (MSI), PD-L1 expression, and intrinsic cancer subtypes.

Keywords: immuno-oncology; spatial profiling; triple-negative breast cancer; tumor microenvironment.


Conflict of interest statement

The authors declare no conflict of interest.

Figures

Fig. 1
Fig. 1
mPrint workflow and study overview. Molecular Fingerprint (mPrint) uses microfluidics and optical cavitation to remove cells from tissue sections and indexes and transports them to a microplate where they are processed using any desired modality, such as next‐generation sequencing (NGS), quantitative polymerase chain reaction (qPCR), and methylation analysis. (A1) A tissue slide is imaged and single cells or regions of interest (ROIs) are selected for removal. (A2) The tissue slide or serial section is attached to microfluidic cartridge. (A3) Laser‐induced cavitation bubbles lift cells from the slide and fluid flow transports material away. (A4) Collected material is dispensed onto a 96‐well plate, or other compatible format. (A5) DNA, RNA, or protein is isolated and (A6) material is analyzed using any commercially available assay such as NGS or qPCR. (B1) A cohort of 22 patients consisting of 14 triple‐negative breast cancer (TNBC), 4 HER2+, and 4 luminal‐like patients was identified. (B2) Tissues from each patient were analyzed using hematoxylin and eosin (H&E) and standard immunohistochemistry staining (IHC). (B3) ROIs were identified by a pathologist and imported into the system's software. (B4) ROIs were removed using optical cavitation. (B5) Material was analyzed using qPCR on a panel of 248 genes, and results were digitally reconstructed, as a map overlaid on the original tissue imagery for analysis. (B6) Correlations between gene expression and spatial location were assessed.
Fig. 2
Fig. 2
RNA quality and correlation to protein expression detected by immunohistochemistry (IHC). (A) High‐quality nucleic acids are important for successful downstream analysis by methods such as next‐generation sequencing (NGS) or quantitative polymerase chain reaction (qPCR). To evaluate the effect of optical cavitation on RNA quality, cells isolated by mPrint were compared with hand‐scraped cells directly from the tissue block, and their quality was compared. Using a bioanalyzer, the RNA integrity number (RIN) was determined to measure the overall fragmentation of nucleic acids, and the percentage of RNA fragments greater than 200 base pairs (DV200) was measured to establish its suitability for sequencing. Ten samples were tested with N = 5/group, and SD plotted on the graph, showing no significant differences in quality between mPrint and hand‐scraping specimen. (B) Representative whole slide and ROI images used for immunohistochemistry (IHC) quantification. Shown is CD3 expression by IHC with pathologist annotations indicating regions of healthy, interface, cancer, and necrotic tissue. The scale bar is 2 mm in the main image, and 250 μm in the image inserts. (C) Protein expression measured by IHC was correlated with gene expression of the protein‐encoding gene measured by qPCR. Overall coefficients of correlation (R 2) were determined for CD3, CD8, and CD20 across N = 22 patients. Representative correlative graphs are shown for each gene where protein expression is plotted by quantifying the level of diaminobenzidine (DAB) in the IHC image, and gene expression is co‐plotted by measuring linearized cycle threshold (C T) values from qPCR.
Fig. 3
Fig. 3
Patients cluster differently based on the tumor microenvironment (TME). A 248‐gene panel measuring gene expression in the tumor microenvironment (TME) was performed on N = 22 patients. Whole tissue sections of formalin‐fixed paraffin‐embedded (FFPE) tissues were analyzed in addition to pathologist‐identified regions of interest (ROI) from the tumor center and tumor interface from each patient. Hierarchical clustering is shown based on whole tissue sections (Left) compared with clustering based on only interface ROIs (Middle) and tumor ROIs (Right). Clear groups of samples with overall upregulated or downregulated gene expression are observed in the whole tissue slices, and patients considered ‘hot’ based on whole tissue analysis are designated by arrows. However, both the expression levels and patient clustering differ drastically in ROI‐specific analysis, illustrated in the redistribution of ‘hot’ patients across new clusters due to heterogeneity in the TME.
Fig. 4
Fig. 4
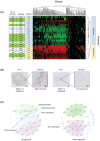
Spatial clustering analysis identifies correlations unrelated to tumor subtype or PD‐1/PD‐L1 expression. (A) Hierarchical clustering analysis from a 248‐gene panel performed on interface regions of the tumor microenvironment (TME) on N = 22 patients reveals two main subgroups with overall gene expression upregulation or downregulation. Samples were also assessed for molecular subtype and programmed death ligand 1 (PD‐L1) expression as determined by immunohistochemistry (IHC). (B) Patients within the same upregulated subgroup demonstrated both high and low expression of PD‐L1 as measured by IHC. The scale bar for patient 13 is 2 mm, and the image insert is 200 μm. The scale bar for patient 4 is 2 mm, and its insert is 400 um. (C) Gene co‐expression networks for up‐ and downregulated subgroups visualizing correlations between genes and their TME compartments (healthy, interface, tumor, necrotic). In the diagram, each node represents a gene from a TME compartment (gene–region pair), the node color indicates the gene pathway it belongs to, lines indicate correlations between gene–region pairs (positive correlation greater than R 2 = 0.7 or inverse correlations greater than R 2 = 0.5), and line colors indicate purely intra‐correlated groups. Shared nodes between groups indicate a shared gene–region pair between groups. In the upregulated cohort, programmed cell death 1 (PD‐1) in the tumor interface correlates to expression of other immune genes, while in the downregulated cohort no such correlations are present.

References

    1. Binnewies M, Roberts EW, Kersten K, Chan V, Fearon DF, Merad M, et al. Understanding the tumor immune microenvironment (TIME) for effective therapy. Nat Med. 2018;24:541–550. 10.1038/s41591-018-0014-x - DOI - PMC - PubMed
    1. Mani NL, Schalper KA, Hatzis C, Saglam O, Tavassoli F, Butler M, et al. Quantitative assessment of the spatial heterogeneity of tumor‐infiltrating lymphocytes in breast cancer. Breast Cancer Res. 2016;18:78. 10.1186/s13058-016-0737-x - DOI - PMC - PubMed
    1. Pitt JM, Marabelle A, Eggermont A, Soria J. Targeting the tumor microenvironment: removing obstruction to anticancer immune responses and immunotherapy. Ann Oncol. 2016;27:1–43. - PubMed
    1. Finotello F, Eduati F. Multi‐Omics profiling of the tumor microenvironment: paving the way to precision immuno‐oncology. Front Oncol. 2018;8:430. 10.3389/fonc.2018.00430 - DOI - PMC - PubMed
    1. Allegrezza MJ, Conejo‐Garcia JR. Targeted therapy and immunosuppression in the tumor microenvironment. Trends Cancer. 2017;3(1):19–27. 10.1016/j.trecan.2016.11.009 - DOI - PubMed

Publication types

MeSH terms