. 2023 Sep 4;14(1):5380.
doi: 10.1038/s41467-023-40907-5.

Genome-resolved correlation mapping links microbial community structure to metabolic interactions driving methane production from wastewater

Affiliations

Genome-resolved correlation mapping links microbial community structure to metabolic interactions driving methane production from wastewater

Brandon Kieft et al. Nat Commun. .

Abstract

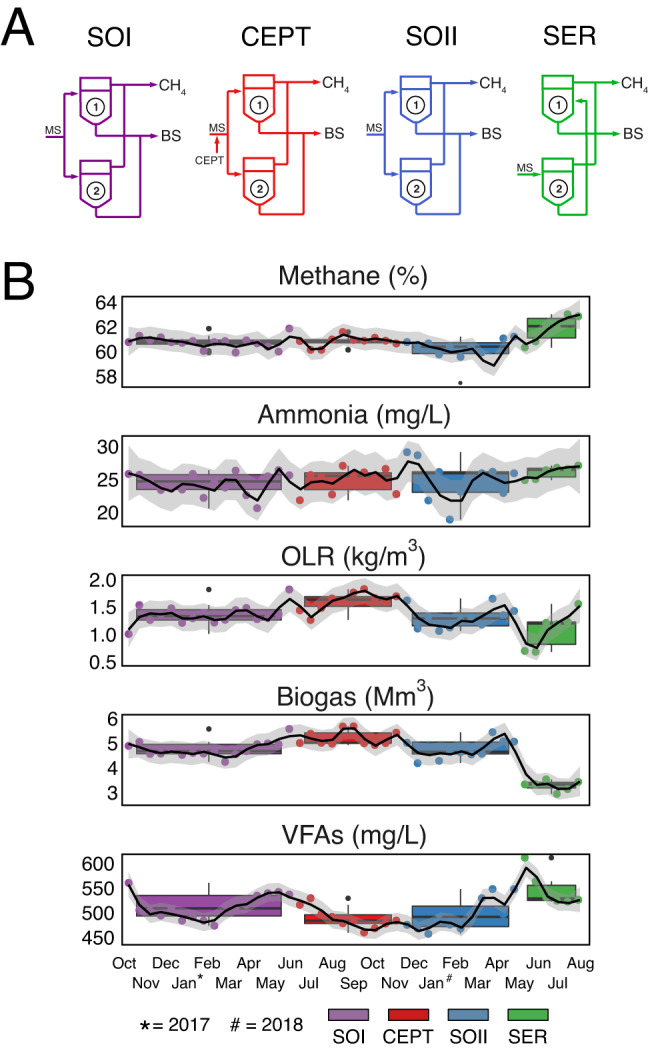
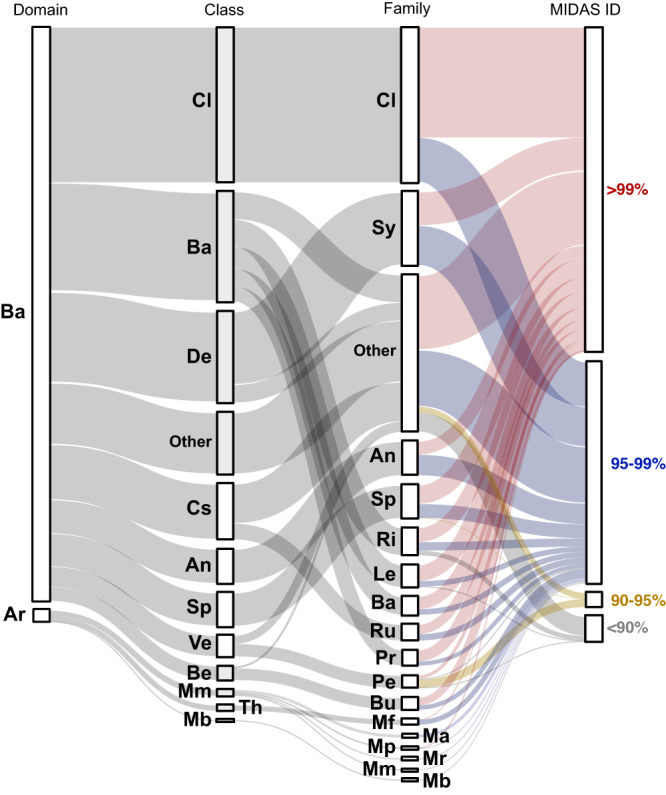
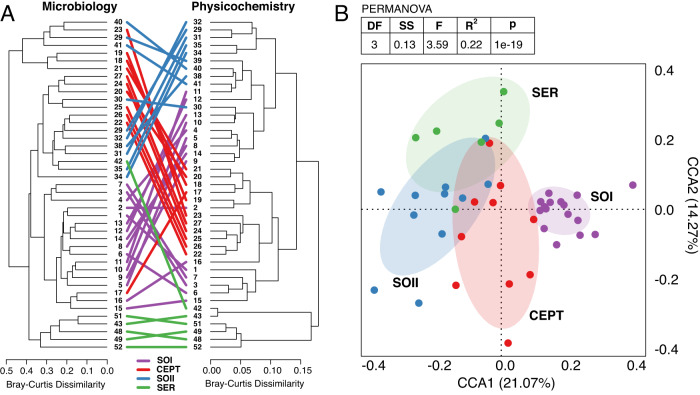
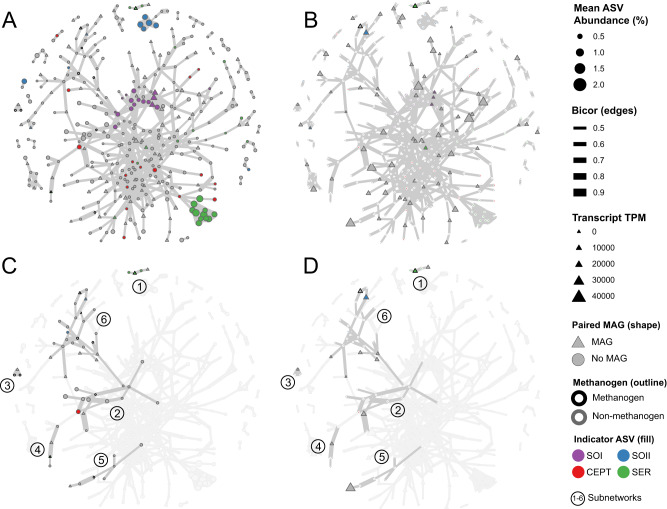
Anaerobic digestion of municipal mixed sludge produces methane that can be converted into renewable natural gas. To improve economics of this microbial mediated process, metabolic interactions catalyzing biomass conversion to energy need to be identified. Here, we present a two-year time series associating microbial metabolism and physicochemistry in a full-scale wastewater treatment plant. By creating a co-occurrence network with thousands of time-resolved microbial populations from over 100 samples spanning four operating configurations, known and novel microbial consortia with potential to drive methane production were identified. Interactions between these populations were further resolved in relation to specific process configurations by mapping metagenome assembled genomes and cognate gene expression data onto the network. Prominent interactions included transcriptionally active Methanolinea methanogens and syntrophic benzoate oxidizing Syntrophorhabdus, as well as a Methanoregulaceae population and putative syntrophic acetate oxidizing bacteria affiliated with Bateroidetes (Tenuifilaceae) expressing the glycine cleavage bypass of the Wood-Ljungdahl pathway.


Conflict of interest statement

S.J.H. is a co-founder of Koonkie Inc., a bioinformatics consulting company that designs and provides scalable algorithmic and data analytics solutions in the cloud. The remaining authors declare no competing interests.

Figures

Fig. 1
Fig. 1. Summaries of the operating conditions and physicochemical conditions of the digester across the time series.
A Wire diagram of the four process configurations across the two-year time series. SOI Standard Operation I, CEPT Chemically Enhanced Primary Treatment Operation, SOII Standard Operation II, SER Serial Operation, MS mixed sludge waste from primary and secondary treatment), CH4 (biogas), BS biosolids, Labels “1” and “2” indicate the two anaerobic digesters (all samples for this study were taken from AD1). B Temporal physicochemical sparklines of AD performance. Methane % volumetric percent of biogas as methane, HRT hydraulic retention time, OLR organic loading rate, Biogas (total volumetric biogas generated), VFAs volatile fatty acids. Box plots of configuration groups represent 75th, 50th (median), and 25th percentiles, with whiskers representing 90th percentiles and outlier position as filled points above whiskers (n = 16 for SOI, 10 for CEPT, 11 for SO II, and 6 for SER).
Fig. 2
Fig. 2. A Sankey diagram of microbial community structure shown as relative abundances of family-level taxa grouped into their respective domains and classes.
The width of ribbons represents the cumulative relative abundances of all ASVs within each taxonomic lineage. The final column assigns ASVs to categories of percent identity of their V4 16S sequences to the MiDAS database. The two-letter codes on the plot represent taxonomic names. Domain: Ba Bacteria, Ar Archaea. Class: Cl Cloacimonadia, Ba Bacteroidia, De Deltaproteobacteria, Ot Other, Cs Clostridia, An Anaerolineae, Sp Spirochaetia, Ve Verrucomicrobiae, Be Betaproteobacteria, Mm Methanomicrobia, Th Thermococci, Mb Methanobacteria, Family: Cl Cloacimonadaceae, Sy Syntrophaceae, Ot Other, An Anaerolineaceae, Sp Spirochaetaceae, Ri Rikenellaceae, Le Lentimicrobiaceae, Ba Bacteroidetes (vadinHA17), Ru Ruminococcaceae, Pr Prolixibacteraceae, Pe Pedosphaeraceae, Bu Burkholderiaceae, Mf Methanofastidiosaceae, Ma Methanosaetaceae, Mp Methanospirillaceae, Mr Methanoregulaceae, Mm Methanomicrobiaceae, Mb Methanobacteriaceae.
Fig. 3
Fig. 3. Relationships between microbial community structure and physicochemical conditions.
A The structures of the AD microbial community (ASV data) and the AD physicochemical data are expressed as Bray-Curtis dissimilarity plotted in a dendrogram. Identical samples in each data-type dendrogram are connected with a line and colored corresponding to their process configuration. B The combined table of ASV and physicochemical data underwent principal coordinate analysis and samples were plotted in the first two coordinate dimensions. The variance explained by each dimension is shown as a percent in the axis text. Samples are colored by their process configuration and ellipses sized by the 95% confidence of the centroid of each configuration group are laid in the background. The two-sided PERMANOVA table above the plot shows results of a test between the four configuration groups.
Fig. 4
Fig. 4. A weighted co-occurrence network of the microbial community depicting multiple-test-corrected biweight midcorrelation values (edges) of ASVs (nodes) across the two-year time series.
Panels (A) and (C) depict the network wherein node sizes represent ASV mean relative abundance across all samples, while Panels (B) and (D) depict node sizes which represent transcript expression levels (TPM) of the representative node MAG. Nodes are shaded with color if they are indicator ASVs for a given process configuration, outlined in black if they are methanogen ASVs, and shaped as triangles if they have a representative MAG. Subnetworks are numbered and highlighted in Panels (C) and (D).

Similar articles

Cited by

References

    1. Adekunle KF, Okolie JA. A review of biochemical process of anaerobic digestion. Adv. Biosci. Biotechnol. 2015;06:205.
    1. Jimenez J, et al. Instrumentation and control of anaerobic digestion processes: a review and some research challenges. Rev. Environ. Sci. Biotechnol. 2015;14:615–648.
    1. Shaw GT-W, Liu A-C, Weng C-Y, Chou C-Y, Wang D. Inferring microbial interactions in thermophilic and mesophilic anaerobic digestion of hog waste. PLoS ONE. 2017;12:e0181395. - PMC - PubMed
    1. Werner JJ, et al. Bacterial community structures are unique and resilient in full-scale bioenergy systems. Proc. Natl Acad. Sci. USA. 2011;108:4158–4163. - PMC - PubMed
    1. Zhang T, Shao M-F, Ye L. 454 Pyrosequencing reveals bacterial diversity of activated sludge from 14 sewage treatment plants. ISME J. 2012;6:1137–1147. - PMC - PubMed

Publication types