Clinical Trial
. 2023 Sep 4;14(1):5384.
doi: 10.1038/s41467-023-41042-x.

Impact of dietary interventions on pre-diabetic oral and gut microbiome, metabolites and cytokines

Affiliations
Clinical Trial

Impact of dietary interventions on pre-diabetic oral and gut microbiome, metabolites and cytokines

Saar Shoer et al. Nat Commun. .

Abstract

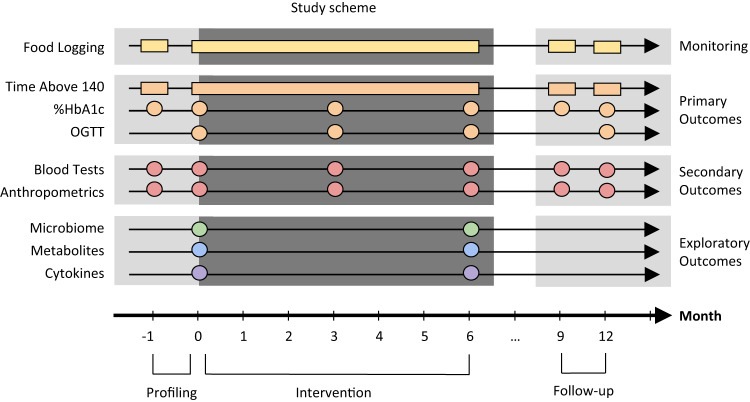
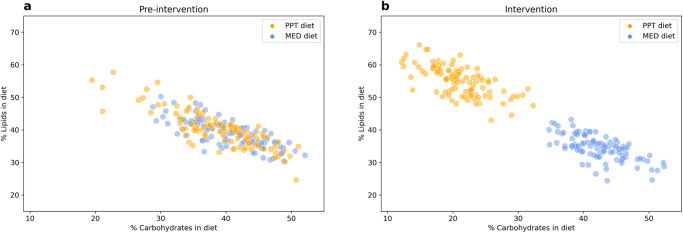
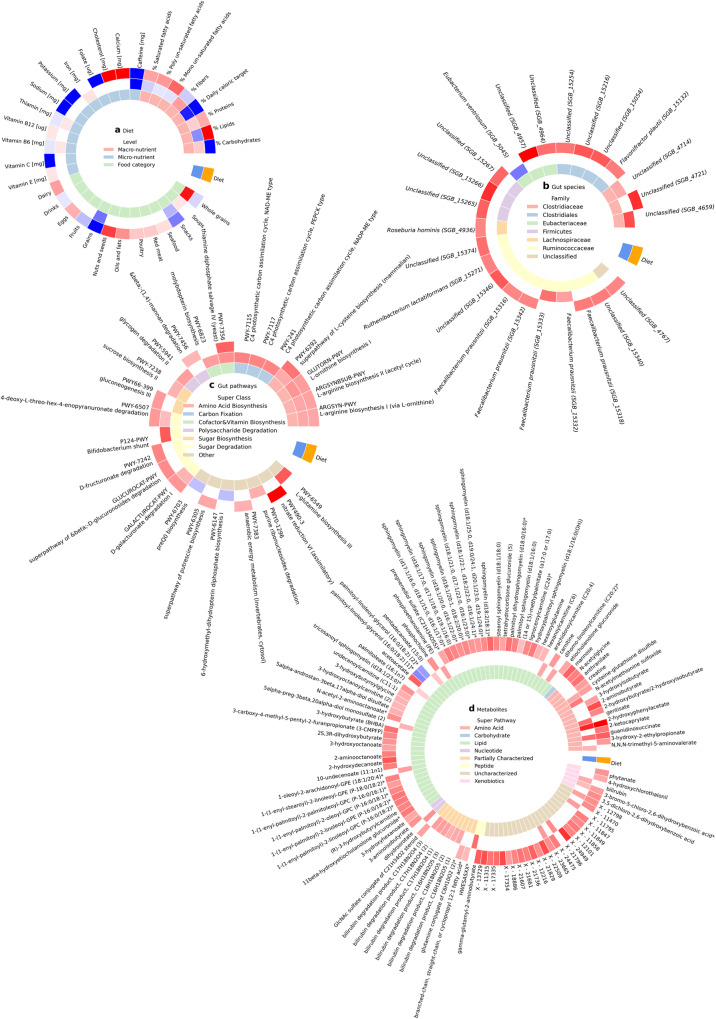
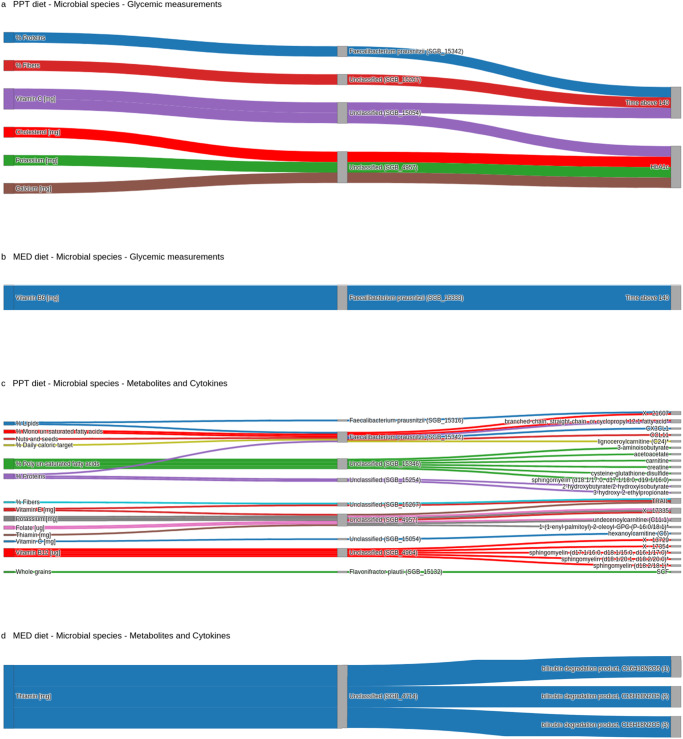
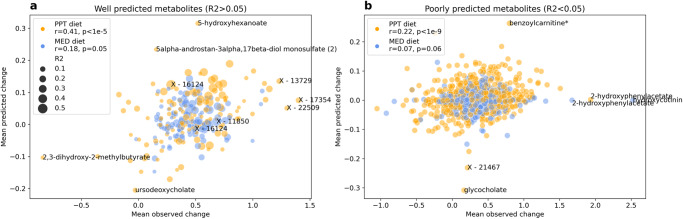
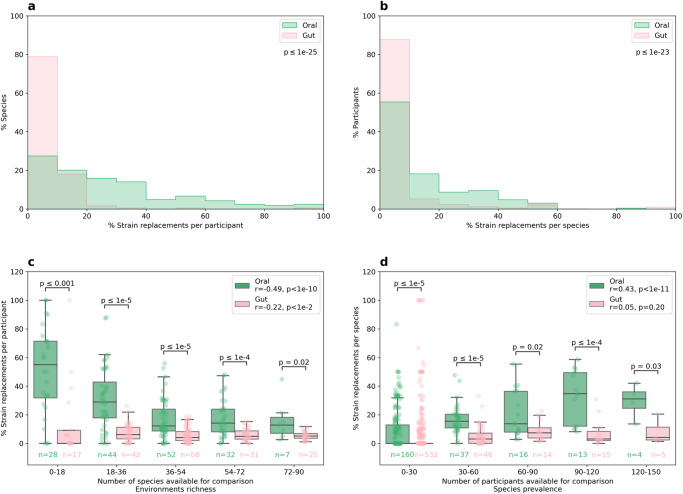
Diabetes and associated comorbidities are a global health threat on the rise. We conducted a six-month dietary intervention in pre-diabetic individuals (NCT03222791), to mitigate the hyperglycemia and enhance metabolic health. The current work explores early diabetes markers in the 200 individuals who completed the trial. We find 166 of 2,803 measured features, including oral and gut microbial species and pathways, serum metabolites and cytokines, show significant change in response to a personalized postprandial glucose-targeting diet or the standard of care Mediterranean diet. These changes include established markers of hyperglycemia as well as novel features that can now be investigated as potential therapeutic targets. Our results indicate the microbiome mediates the effect of diet on glycemic, metabolic and immune measurements, with gut microbiome compositional change explaining 12.25% of serum metabolites variance. Although the gut microbiome displays greater compositional changes compared to the oral microbiome, the oral microbiome demonstrates more changes at the genetic level, with trends dependent on environmental richness and species prevalence in the population. In conclusion, our study shows dietary interventions can affect the microbiome, cardiometabolic profile and immune response of the host, and that these factors are well associated with each other, and can be harnessed for new therapeutic modalities.


Conflict of interest statement

The authors declare no competing interests.

Figures

Fig. 1
Fig. 1. Study scheme.
The study included three periods—profiling, intervention and follow-up illustrated as a timeline (x-axis). Each row is a type of measurement processed from a specific time point (circles) or continuously (rectangles). Study defined primary outcomes are measures of glycemic response, secondary outcomes are blood tests and anthropometrics, and exploratory outcomes include oral and gut microbiome, serum metabolites and cytokines. Time above 140 daily time of blood glucose levels above 140 mg/dL, HbA1c glycated hemoglobin, OGTT oral glucose tolerance test. Figure adjusted with permission from Ben-Yacov et al..
Fig. 2
Fig. 2. Dietary interventions in pre-diabetes.
a Pre-intervention and (b) during the intervention, percentage of carbohydrates consumed (x-axis) and percentage of lipids consumed (y-axis) in diet per participant (dot). Stratified by the dietary intervention, “PPT diet” in orange (n = 100) and “MED diet” in blue (n = 100). Source data are provided as a Source Data file.
Fig. 3
Fig. 3. The PPT diet had bigger effect on the microbiome and metabolites than the MED diet.
a Dietary features, (b) gut microbial species, (c) gut microbial pathways and (d). serum metabolites that significantly changed in the “PPT diet” (outer ring, orange) or in the “MED diet” (middle ring, blue) (Bonferroni corrected p < 0.05, two-sided Wilcoxon paired signed-rank test). Color indicates the mean change of the feature, red—increased, blue—decreased and white—not statistically significant. The inner ring is the type of dietary feature in (a), the family of the species in (b), the super class of the pathway in (c), and the super pathway of the metabolite in (d). There was no significant difference between the two diet groups at baseline in any of the 2803 molecular features tested (Bonferroni corrected p > 0.05, two-sided Mann–Whitney U test). Source data are provided as a Source Data file.
Fig. 4
Fig. 4. The microbiome mediates the diet’s effect.
Each alluvial plot shows paths from diet to outcomes that are mediated by oral and gut microbial species (two-sided bootstrap p < 0.05). The outcomes in (a) and (b) are glycemic measurements, and in (c) and (d) the outcomes are metabolites and cytokines. (a) and (c) Show paths of the “PPT diet”, while (b) and (d) show paths of the “MED diet”. Source data are provided as a Source Data file.
Fig. 5
Fig. 5. The change in microbiome composition is associated with the change in metabolites.
a Well predicted serum metabolites by the gut microbiome composition (R2 > 0.05 in the training set) and (b) poorly predicted serum metabolites (R2 < 0.05 in the training set) mean observed change (x-axis) and mean predicted change (y-axis) over this study participants per metabolite (dot). Stratified by the dietary intervention, “PPT diet” in orange and “MED diet” in blue, and sized in (a) by the coefficient of determination (R2) of each metabolite in the training set. r, p in the legend—Pearson correlation between the mean observed and mean predicted change in each diet.
Fig. 6
Fig. 6. The oral microbiome is genetically more dynamic than the gut microbiome.
Normalized histograms of the percentage of strains replaced (a) per participant and (b) per species. Percentage of strains replaced (c) per participant and (d) per species (y-axis), binned by the number of species or participants available for comparison, respectively (x-axis). Boxes show the quartiles of the data (0.25, 0.50, 0.75) while the whiskers extend to 1.5 of the inter quartile range, points beyond the whiskers are considered to be outliers. All panels are stratified by the environment, “Oral” in green and “Gut” in pink. p below the legends in the upper panels and on top of the boxes in the lower panels is between the oral and gut percentage of strains replaced (two sided Mann–Whitney U test). r, p in the legend—Pearson correlation between the percentage of strains replaced and the quantity available for comparison in each environment. n below the boxplot—number of participants or species in each bin and environment.

References

    1. Echouffo-Tcheugui JB, Selvin E. Prediabetes and what it means: the epidemiological evidence. Annu. Rev. Public Health. 2021;42:59–77. doi: 10.1146/annurev-publhealth-090419-102644. - DOI - PMC - PubMed
    1. Saeedi P, et al. Global and regional diabetes prevalence estimates for 2019 and projections for 2030 and 2045: Results from the International Diabetes Federation Diabetes Atlas, 9th edition. Diabetes Res. Clin. Pract. 2019;157:107843. doi: 10.1016/j.diabres.2019.107843. - DOI - PubMed
    1. Tinajero MG, Malik VS. An update on the epidemiology of type 2 diabetes: A global perspective. Endocrinol. Metab. Clin. North Am. 2021;50:337–355. doi: 10.1016/j.ecl.2021.05.013. - DOI - PubMed
    1. Berbudi A, Rahmadika N, Tjahjadi AI, Ruslami R. Type 2 diabetes and its impact on the immune system. Curr. Diabetes Rev. 2020;16:442–449. - PMC - PubMed
    1. Morze J, et al. Metabolomics and type 2 diabetes risk: An updated systematic review and meta-analysis of prospective cohort studies. Diabetes Care. 2022;45:1013–1024. doi: 10.2337/dc21-1705. - DOI - PMC - PubMed

Publication types