. 2023 Sep 4;14(1):5382.
doi: 10.1038/s41467-023-40986-4.

Lrig1-expression confers suppressive function to CD4+ cells and is essential for averting autoimmunity via the Smad2/3/Foxp3 axis

Affiliations

Lrig1-expression confers suppressive function to CD4+ cells and is essential for averting autoimmunity via the Smad2/3/Foxp3 axis

Jae-Seung Moon et al. Nat Commun. .

Abstract

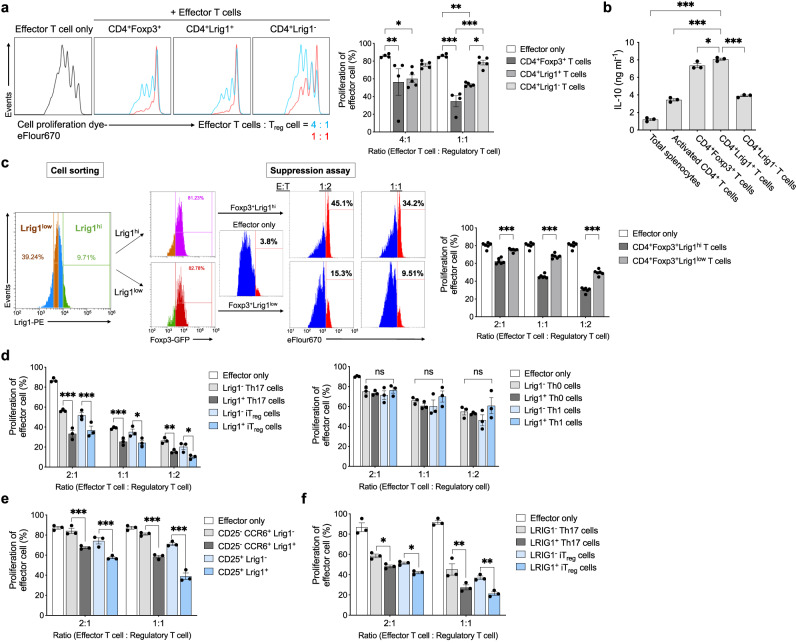
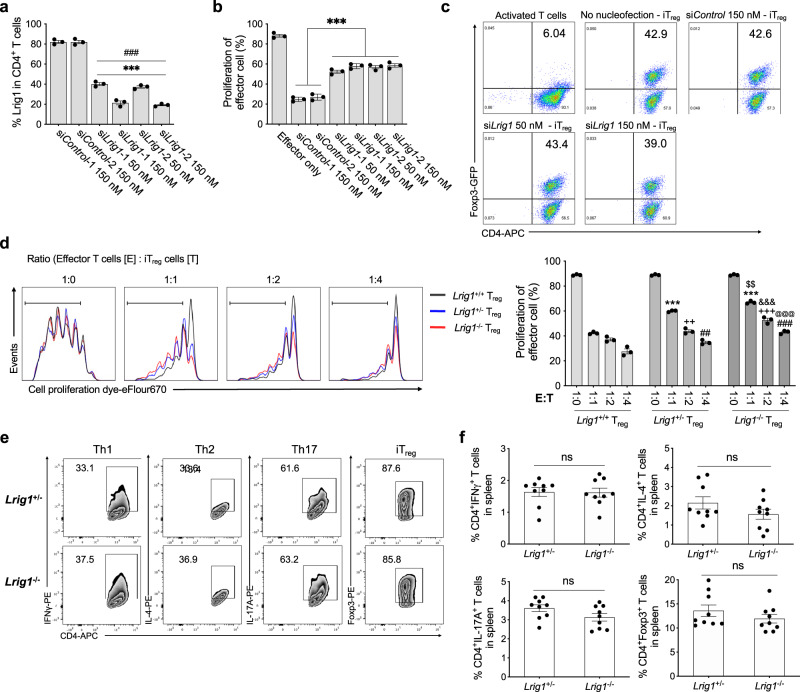
Regulatory T cells (Treg) are CD4+ T cells with immune-suppressive function, which is defined by Foxp3 expression. However, the molecular determinants defining the suppressive population of T cells have yet to be discovered. Here we report that the cell surface protein Lrig1 is enriched in suppressive T cells and controls their suppressive behaviors. Within CD4+ T cells, Treg cells express the highest levels of Lrig1, and the expression level is further increasing with activation. The Lrig1+ subpopulation from T helper (Th) 17 cells showed higher suppressive activity than the Lrig1- subpopulation. Lrig1-deficiency impairs the suppressive function of Treg cells, while Lrig1-deficient naïve T cells normally differentiate into other T cell subsets. Adoptive transfer of CD4+Lrig1+ T cells alleviates autoimmune symptoms in colitis and lupus nephritis mouse models. A monoclonal anti-Lrig1 antibody significantly improves the symptoms of experimental autoimmune encephalomyelitis. In conclusion, Lrig1 is an important regulator of suppressive T cell function and an exploitable target for treating autoimmune conditions.


Conflict of interest statement

An invention disclosure describing Lrig1 and mAb has been filed based on the data generated in this study and is owned by Good T Cells, Inc. S.K.L. as a founder of Good T Cells, Inc. The remaining authors declare no competing interests.

Figures

Fig. 1
Fig. 1. Lrig1 is a new surface protein dominantly expressed in mouse and human Treg cells.
a Relative mRNA amount of Lrig1 in Treg cells or different T cell subsets by qRT-PCR (n = 3). Data are expressed as mean ± S.E.M (***P < 0.0001). b The level of Lrig1 expressing cells among mouse T cell subsets. Naïve: n = 4, Th0: n = 8, Th1: n = 6, Th2: n = 6, Th17: n = 9, iTreg: n = 8. Data are expressed as mean ± S.E.M (***P < 0.0001). c The level of Lrig1 expressing cells was analyzed when mouse naïve CD4+ T cells were cultured in iTreg-polarizing condition with the different concentrations (0–5 ng ml−1) of TGF-β1. 0 or 0.5 ng ml−1: n = 4, 1, or 5 ng ml−1: n = 3. Data are expressed as mean ± S.E.M (**P = 0.0032, ***P < 0.0001). d Examination of human LRIG1 on the surface of various human T cell subsets. Naïve: n = 3, Th0: n = 4, Th1: n = 4, Th2: n = 3, Th17: n = 4, iTreg: n = 5. Data are expressed as mean ± S.E.M (***P < 0.0001). e Representative images of frequencies of Lrig1+Foxp3+ T cells among mouse CD4+ T cells in the spleen, thymus, or inguinal lymph node. f The expression level of PD-1, CD25, Foxp3, or IL-10 in mouse splenic CD4+Lrig1+ or Lrig1 T cells. Data are combined from at least three independent experiments. Statistics were calculated by ordinary one-way ANOVA with Tukey’s multiple comparisons test (a) or ordinary one-way ANOVA with Dunnett’s multiple comparisons test (bd). Source data are provided as a Source Data file.
Fig. 2
Fig. 2. Lrig1 is required for the suppressive population of Treg and Th17 cells.
a Suppressive potential of CD4+Lrig1+ cells, CD4+Lrig1 cells, or CD4+GFP+ cells (Foxp3+) toward eFlour 670-labeled effector T cells with a different ratio. Effector only or CD4+Foxp3+ T cells: n = 4, CD4+Lrig1+ T cells or CD4+Lrig1 T cells: n = 5. Data are expressed as mean ± S.E.M (in ratio 4:1 *P = 0.02, **P = 0.007; in ratio 1:1 *P = 0.01, **P = 0.002, ***P < 0.001). b The level of IL-10 in the culture medium of total splenocytes, activated CD4+ T cells, CD4+Foxp3+ T cells, or CD4+Lrig1+ or Lrig1 T cells in mouse spleen (n = 3). Data are expressed as mean ± S.E.M (*P = 0.03, ***P < 0.001). c Representative images (left) and quantification (right) of suppression activity of CD4+Foxp3+Lrig1hi or CD4+Foxp3+Lrig1low T cells expressing a similar level of Foxp3 (n = 6). Data are expressed as mean ± S.E.M (***P < 0.001). d, e Comparison of the suppressive activity of Lrig1+ and Lrig1 cells from mouse Th17, iTreg, Th0, or Th1 cells (d) (n = 3) or mouse Lrig1+ and Lrig1 cells from CD25CCR6+ T cells or CD25+ T cells in the splenocytes (e) (n = 3). Data are expressed as mean  ±  S.E.M (in d 2:1 ratio, ***P < 0.0001 Lrig1 Th17 vs Lrig1+ Th17, ***P = 0.0003 Lrig1 iTreg vs Lrig1+ iTreg; 1:1 ratio, *P = 0.012, ***P = 0.0007; 1:2 ratio, *P = 0.0127, **P = 0.0099; in e ***P < 0.0001). f The suppressive potential of human LRIG1+ and LRIG1 cells from human blood differentiated Th17 or iTreg cells (n = 3). Data are expressed as mean ± S.E.M (*P = 0.0479 LRIG1 Th17 vs LRIG1+ Th17, *P = 0.0471 LRIG1 iTreg vs LRIG1+ iTreg, **P = 0.0014 LRIG1 Th17 vs LRIG1+ Th17, **P = 0.0032 LRIG1 iTreg vs LRIG1+ iTreg). Ordinary one-way ANOVA with Dunnett’s multiple comparisons test (b) or two-way ANOVA with Tukey’s multiple comparisons test (a, cf). All experiments were repeated at least three times. Source data are provided as a Source Data file.
Fig. 3
Fig. 3. Lrig1-deficiency in Treg cells impairs the suppressive activity.
a The level of Lrig1 expression on the cell surface of iTreg cells whose Lrig1 expression was knocked down by 50 nM or 150 nM of 2 different siRNAs targeting Lrig1 (siLrig1) or 150 nM of scrambled sequences (siControl) (n = 3). Data are expressed as mean ± S.E.M (***P < 0.001 versus siControl-1, ###P < 0.001 versus siControl-2). b Quantification of the suppressive activity of Lrig1-silenced iTreg cells (n = 3) Data are expressed as mean ± S.E.M (***P < 0.0001). c siLrig1- or siControl- nucleofected naïve CD4+ T cells from Foxp3-IRES-GFP mice were induced to differentiate into iTreg cells, and the level of Foxp3 in CD4+Foxp3+ (GFP+) cells was examined. d Representative images (left), and quantification (right) of the suppressive potential of iTreg cells from Lrig1+/+, Lrig1+/−, or Lrig1−/− mice (n = 3). Data are expressed as mean ± S.E.M (***P < 0.001, ++P = 0.005, +++P < 0.001, ##P = 0.002, ###P < 0.001, $$P = 0.002, &&&P < 0.001, @@@P < 0.001). * symbol shows versus 1:1 of Lrig1+/+, + symbol shows versus 1:2 of Lrig1+/+, # symbol shows versus 1:4 of Lrig1+/+, $ symbol shows versus 1:1 of Lrig1+/−, & symbol shows versus 1:2 of Lrig1+/−, @ symbol shows versus 1:4 of Lrig1+/−. e Representative dot plots of the level of IFNγ, IL-4, IL-17A, or Foxp3 in each cell type differentiated from Lrig1+/− or Lrig1−/− mice. f Mouse splenocytes were isolated from Lrig1+/− or Lrig1−/− mice, and the level of IFNγ+, IL-4+, IL-17A+, or Foxp3+ in CD4+ T cells was examined (n = 9). Data are expressed as mean ± S.E.M (IFNγ: P = 0.9341, IL-4: P = 0.1721, IL-17A: P = 0.0934, Foxp3: P = 0.2866). Ordinary one-way ANOVA with Dunnett’s multiple comparisons test (a, b), two-way ANOVA with Tukey’s multiple comparisons test (d) or two-tailed unpaired Student’s t test (f). All experiments were repeated at least three times. Source data are provided as a Source Data file.
Fig. 4
Fig. 4. Adoptive transfer of CD4+Lrig1+ T cells into IBD mice significantly alleviates the autoimmune symptoms.
a Body weight change of Rag1-deficient mice transferred with CD45.1+CD4+CD45RBhigh T cell alone (n = 3), or together with CD4+Foxp3+ T cells from Foxp3-IRES-GFP mice (n = 5), CD4+Lrig1+ (n = 6) or Lrig1 (n = 4) T cells from C57BL/6 mice. Data are expressed as mean ± S.E.M (week 1 + P = 0.0121; week 2 *P = 0.0122, +P = 0.0336, ++P = 0.0042; ***P < 0.0001, +++P < 0.0001). + symbol shows versus CD4+Lrig1 T cells, * symbol shows versus CD4+CD45RBhigh T cells only. b Representative image of macroscopic changes in the colon from each recipient group. c Representative images of hematoxylin and eosin (H&E) staining (left) and the combined histopathological clinical scores (right) of large intestines. Scale bar indicates 200 μm. CD45.1+CD4+CD45RBhigh T cell alone (n = 5), or together with CD4+Foxp3+ T cells (n = 5), CD4+Lrig1+ (n = 6), or Lrig1 (n = 3) T cells. Data are expressed as mean ± S.E.M (**P = 0.0022 CD45RBhi only vs + CD4+Foxp3+, **P = 0.0017 CD45RBhi only vs + CD4+Lrig1+, ***P = 0.0007 + CD4+Foxp3+ vs + CD4+Lrig1, ***P = 0.0005 + CD4+Lrig1 vs + CD4+Lrig1+). d Representative images of splenomegaly from each recipient group. e The level of CD4+Foxp3+ cells among CD45.2+TCRβ+ T cells in the re-stimulated lymphocytes from the colonic lamina propria of each recipient group (n = 3). Data are expressed as mean ± S.E.M (*P = 0.0456 + CD4+Foxp3+ vs + CD4+Lrig1, *P = 0.0107 + CD4+Lrig1 vs + CD4+Lrig1+, **P = 0.009 CD45RBhi only vs +CD4+Foxp3+, **P = 0.0024 CD45RBhi only vs +CD4+Lrig1+). f Serum concentration of TNFα or IL-1β in each recipient mice (n = 3). Data are expressed as mean ± S.E.M (*P = 0.0347, ***P = 0.0004). g Heatmap showing the expression level of suppressive signature genes in Lrig1+ or Lrig1 cells from mouse splenic CD4+ T cells (n = 3). h GSEA plots comparing CD4+Lrig1+ and CD4+Lrig1 T cell populations using the gene sets of Foxp3-target clusters and the upregulated genes in Treg cells compared to conventional T cells (cgp.v.7.4.symbols and ImmuneSigDB.v.7.4.symbols). Data were collected from at least three independent experiments. Statistical significance was measured by two-way ANOVA with Tukey’s multiple comparisons test (a), one-way ANOVA with Tukey’s multiple comparisons test (c, e), and two-tailed unpaired Student’s t test (f). Source data are provided as a Source Data file.
Fig. 5
Fig. 5. Lrig1 stimulation enhances Foxp3 expression via induction of Smad2/3 phosphorylation.
a, b Representative images (left) or the percentage (right) of CD4+Foxp3+ (a) (n = 3) or p-Smad2/3+ (b) (n = 3) T cells by 6F01 stimulation in a dose-dependent manner during iTreg differentiation. Treatment of 5 ng ml−1 TGF-β1 was used as a positive control. Data are expressed as mean ± S.E.M (in a Day 2 *P = 0.0226, **P = 0.0019 Isotype IgG vs 6F01, **P = 0.0024 Isotype IgG vs iTreg; Day3 *P = 0.0156, **P = 0.0012, ***P < 0.001) (in b *P = 0.0123, **P = 0.0081). c Representative dot plots (upper) or quantification of the level of CD4+Foxp3+ T cells in SIS3 treatment with 6F01 or isotype IgG during iTreg differentiation in a dose-dependent manner (n = 3). Data are expressed as mean ± S.E.M (***P < 0.001). d The level of Foxp3 mRNA from mouse iTreg cells stimulated with 6F01 or isotype control normalized with GAPDH (left) (n = 3) or Hprt (right) (n = 4) level. Data are expressed as mean ± S.E.M (in left panel **P = 0.0029 No vs 6F01, **P = 0.0044 Isotype IgG vs 6F01; in right panel *P = 0.0141, **P = 0.0062). e The level of EGFR expression of Th0 or iTreg cells in response to isotype IgG or various 6F01 treatment using western blot analysis. β-actin was used as a quality control. The experiment was repeated three times independently with similar results. fh Quantification of MFI of phosphorylated AKT (Ser473), mTOR (Ser2448), or FoxO1 (Ser256) by stimulation of 6F01 or isotype control (n = 3 for each group). Data are expressed as mean ± S.E.M (p-AKT: *P = 0.0164 No vs 6F01, *P = 0.0112 Isotype IgG vs 6F01; p-mTOR: **P = 0.005 No vs 6F01, **P = 0.001 Isotype IgG vs 6F01, ***P < 0.001; p-FoxO1: ***P < 0.001). One-way ANOVA with Dunnett’s multiple comparisons test (a, b) or one-way ANOVA with Tukey’s multiple comparisons test (d, fh) or two-way ANOVA with Šídák’s multiple comparisons test (c). Source data are provided as a Source Data file.
Fig. 6
Fig. 6. Therapeutic efficacy of Lrig1-specific monoclonal antibody (6F01) in the experimental autoimmune encephalomyelitis (EAE) model.
a Clinical score of EAE symptoms until 27 days after EAE onset. EAE model mice were treated with isotype IgG2a (n = 8), 50 μg of 6F01 (n = 8), or anti-IL-17A mAb (n = 8). Each arrow indicates the injection day of isotype IgG2a, 50 μg of 6F01 or anti-IL-17A monoclonal antibody (mAb). Data are expressed as mean ± S.E.M (***P < 0.0001). b Representative images showing the level of inflammatory cell infiltration into the spinal cord and the level of spinal cord demyelination by H&E or LFB staining, respectively. Scale bar indicates 50 μm. The experiment was repeated two times independently with similar results. cf The level of Lrig1+Foxp3+ (c), total Foxp3+ (d), IL-17A+ (e), or IFNγ+ cells (f) among CD4+ T cells in the spinal cord (SC) or lymph node (LN) of the isotype IgG2a-, 6F01-, or anti-IL-17A mAb-treated EAE animals (n = 5 for each group). Data are expressed as mean ± S.E.M (in c, SC **P = 0.0064, ***P = 0.0001; LN ***P < 0.001) (in d, SC *P = 0.0288, ***P = 0.0007; LN **P = 0.0089, ***P = 0.0008) (in e, SC *P = 0.022, **P = 0.0071; LN ***P < 0.001) (in f, SC **P = 0.0067; LN **P = 0.0011, ***P = 0.0002). ns not significant. Two-way ANOVA with Dunnett’s multiple comparisons test (a), One-way ANOVA with Tukey’s multiple comparisons test (cf). Source data are provided as a Source Data file.

References

    1. Hori S, Nomura T, Sakaguchi S. Control of regulatory T cell development by the transcription factor Foxp3. Science. 2003;299:1057–1061. - PubMed
    1. Sakaguchi S. Regulatory T cells: key controllers of immunologic self-tolerance. Cell. 2000;101:455–458. - PubMed
    1. Dominguez-Villar M, Hafler DA. Regulatory T cells in autoimmune disease. Nat. Immunol. 2018;19:665–673. - PMC - PubMed
    1. Miyara M, et al. Human FoxP3+ regulatory T cells in systemic autoimmune diseases. Autoimmun. Rev. 2011;10:744–755. - PubMed
    1. Togashi Y, Shitara K, Nishikawa H. Regulatory T cells in cancer immunosuppression—implications for anticancer therapy. Nat. Rev. Clin. Oncol. 2019;16:356–371. - PubMed

Publication types

Substances