Genome-wide analysis identifies novel loci influencing plasma apolipoprotein E concentration and Alzheimer's disease risk
- PMID: 37666928
- PMCID: PMC10827653
- DOI: 10.1038/s41380-023-02170-4
Genome-wide analysis identifies novel loci influencing plasma apolipoprotein E concentration and Alzheimer's disease risk
Abstract
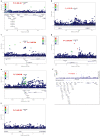
The APOE 2/3/4 polymorphism is the greatest genetic risk factor for Alzheimer's disease (AD). This polymorphism is also associated with variation in plasma ApoE level; while APOE*4 lowers, APOE*2 increases ApoE level. Lower plasma ApoE level has also been suggested to be a risk factor for incident dementia. To our knowledge, no large genome-wide association study (GWAS) has been reported on plasma ApoE level. This study aimed to identify new genetic variants affecting plasma ApoE level as well as to test if baseline ApoE level is associated with cognitive function and incident dementia in a longitudinally followed cohort of the Ginkgo Evaluation of Memory (GEM) study. Baseline plasma ApoE concentration was measured in 3031 participants (95.4% European Americans (EAs)). GWAS analysis was performed on 2580 self-identified EAs where both genotype and plasma ApoE data were available. Lower ApoE concentration was associated with worse cognitive function, but not with incident dementia. As expected, the risk for AD increased from E2/2 through to E4/4 genotypes (P for trend = 4.8E-75). In addition to confirming the expected and opposite associations of APOE*2 (P = 4.73E-79) and APOE*4 (P = 8.73E-12) with ApoE level, GWAS analysis revealed nine additional independent signals in the APOE region, and together they explained about 22% of the variance in plasma ApoE level. We also identified seven new loci on chromosomes 1, 4, 5, 7, 11, 12 and 20 (P range = 5.49E-08 to 5.36E-10) that explained about 9% of the variance in ApoE level. Plasma ApoE level-associated independent variants, especially in the APOE region, were also associated with AD risk and amyloid deposition in the brain, indicating that genetically determined ApoE level variation may be a risk factor for developing AD. These results improve our understanding of the genetic determinants of plasma ApoE level and their potential value in affecting AD risk.
© 2023. The Author(s).
Conflict of interest statement
The authors declare no competing interests.
Figures


References
MeSH terms
Substances
Grants and funding
LinkOut - more resources
Full Text Sources
Medical
Research Materials
Miscellaneous

